
The Fed Delivers As Expected And Hints To QE4 – Equity Downside Limited?
Economic Events September 23 – 27, 2019
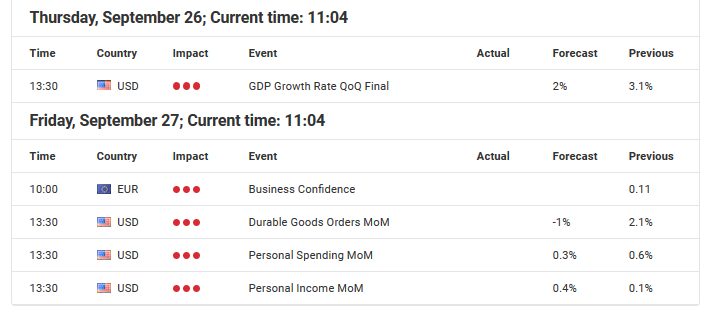
Source: Economic Events Calendar September 23 – 27, 2019 - Admiral Markets' Forex Calendar
DAX30 CFD
The DAX30 CFD didn't deliver anything new from a technical or fundamental perspective despite the Fed rate decision last Wednesday.
While the Fed delivered as expected, cutting the main target rate by 25 basis points to 1.75 – 2%, the attention of the DAX bulls was likely triggered by the comments from Fed chairman Powell who brought up another round of Fed QE (at least between the lines) when he said during the press conference that the Fed may resume organic balance sheet growth earlier than thought.
In addition to the announced "QE-ternity" from the ECB on September 12, the downside in the DAX30 seems currently limited and into the end of the third quarter of 2019, another stint up to the current yearly highs around 12,600/650 points seems likely, at least as long as we trade short-term above 12,300 points.
If a surprising, deeper, corrective move is on its way, probably through another twitter tirade from US president Trump or a liquidity shortage in the repo market arises, the DAX30 CFD should be solidly supported around 11,800/850 points:
(Click on image to enlarge)
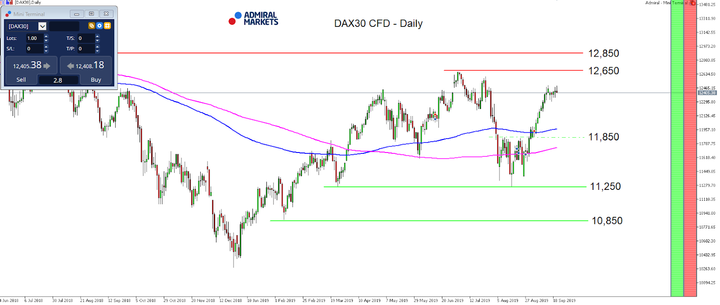
Source: Admiral Markets MT5 with MT5-SE Add-on DAX30 CFD Daily chart (between June 7, 2018, to September 20, 2019). Accessed: September 20, 2019, at 10:00pm GMT - Please note: Past performance is not a reliable indicator of future results, or future performance.
In 2014, the value of the DAX30 CFD increased by 2.65%, in 2015, it increased by 9.56%, in 2016, it increased by 6.87%, in 2017, it increased by 12.51%, in 2018, it fell by 18.26%, meaning that after five years, it was up by 10.5%.
US Dollar
The much anticipated Fed rate decision last Wednesday delivered as expected: the US central bank cut the main target rate by 25 basis points to 1.75 – 2%. The only surprise may have been that the Fed lowered rates on overnight reverse repos by 0.3% to 1.7%. On the other hand, that didn't surprise many market participants after the New York Fed injected 75bn USD into the US financial system on Tuesday, respectively Wednesday to alleviate funding pressures in short-term lending markets.
Here, the cost of repos surged as high as 10% on last Tuesday, pointing to potential illiquidity in the credit market and letting speculation arise that the Fed may rather sooner than later bring QE back on the table.
And in fact, Fed chairman Powell did that (at least between the lines) when he said during the Fed press conference last Wednesday that the Fed may resume organic balance sheet growth earlier than thought.
While (US) equity markets reacted slightly bullish, US yield and Gold didn't take the bait, at least not yet.
Still, we remain cautious with an overly bullish outlook for the Greenback. Not only is another rate cut by 25 basis points in December on the table (market participants currently expect such a step by nearly 60% according to the Fed Watch Tool), but further cuts in an "easing" monetary policy world and a still very aggressive US president who likes the Fed to continue to aggressively cut rates further favour a weaker US dollar over the midterm.
Technically USD Index Future stays neutral between 95 and 98 with a tendency of a push down to 95.00 points if rather sooner than later more and more Fed doves echo US president's Trump call for lower rates and a weaker US dollar:
(Click on image to enlarge)
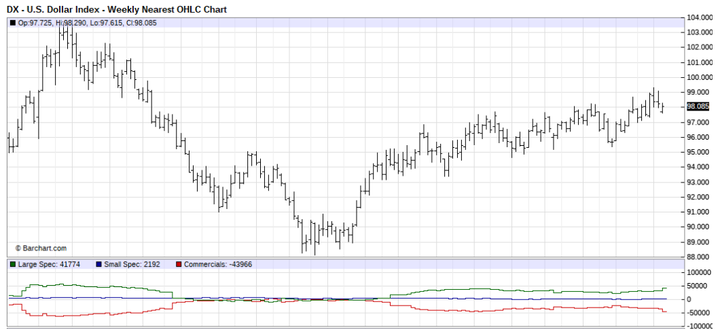
Source: Barchart - U.S Dollar Index - Weekly Nearest OHLC Chart (between May 2016 to September 2019). Accessed: September 20, 2019 at 10:00pm GMT
Don't forget to register for the weekly "Trading Spotlight" webinar with presenters including Jens Klatt, every Monday, Wednesday and Friday at 3pm London time! It's your opportunity to follow Jens and others as they explore the weekly market outlook in detail, so don't miss out!
Euro
After the ECB rate decision on September 12, the overall fundamental picture in the Euro didn't significantly change, despite the Fed rate decision.
After the "QE-ternity" announcement, but sharp Euro reversal back above 1.1000 against the US dollar, likely driven by the fact that the re-launch of QE didn't come with the ECB raising the issuer limit rule, limiting the impact of the ECB-QE-relaunch, it seems that short-term a stint back above 1.1100 in the EUR/USD is a serious option.
The reason for our bullish outlook for the EUR/USD can be found in an interesting statement from Fed chairman Powell during the Fed press conference that the Fed may resume organic balance sheet growth earlier than thought, bringing a relaunch of QE on the table, at least between the lines.
If in addition to that speculation which is most likely weighing on the US dollar, the shortage in the repo market continues and the Fed has to continue to deliver further liquidity to alleviate funding pressures in short-term lending markets, further pressure on the US dollar is realistic and could drive EUR/USD higher, making a break above 1.1100 an option and activating 1.1280/1300 as a target:
(Click on image to enlarge)
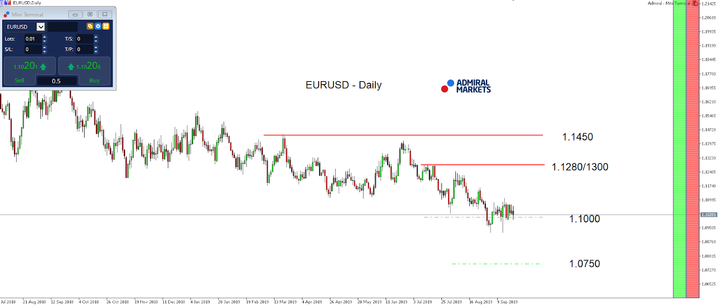
Source: Admiral Markets MT5 with MT5-SE Add-on EUR/USD Daily chart (between July 16, 2018, to September 20, 2019). Accessed: September 20, 2019, at 10:00pm GMT - Please note: Past performance is not a reliable indicator of future results, or future performance.
In 2014, the value of the EUR/USD fell by 11.9%, in 2015, it fell by 10.2%, in 2016, it fell by 3.2%, in 2017, it increased by 13.92%, 2018, it fell by 4.4%, meaning that after five years, it was down by 16.5%.
JPY
As mentioned in our last weekly market outlook, we pointed out the two main events from the last week for USD/JPY traders: the Fed and BoJ rate decision.
As expected, the Fed delivered a 25 basis point rate cut and market participants seeing chances of another rate cut at her December meeting by 0.25% of currently nearly 60% according to the Fed Watch Tool.
What was certainly interesting was that the comments from Fed chairman Powell who said during the press conference that the Fed may resume organic balance sheet growth earlier than thought (bringing a relaunch of QE on the table, at least between the lines) resulted in no sharper yield decline, but instead US yields surged, a move we in fact question and could imagine being sold sooner rather than later, again.
The pullback down to 108.00 was then initiated by the BoJ on Thursday morning where the Japanese central bank remained at her status quo, maintaining the Short-Term Interest Rate Target At -0.1% and the 10-year JGB yield target around 0%.
Later, BoJ governor Kuroda pointed to continuing the overseas economic slowdown which leaves further monetary stimulus on the table and the BoJ judging whether such an easing step is needed at the October meeting.
While over the last few weeks, rumours made rounds that the BoJ could consider cutting rates into deeper negative territory, the neutral stance on Thursday turned such speculations down.
That said and with the technical picture favouring the short-side on a daily time-frame below 108.50/109.00, we still favour over the next weeks and months the short-side and with a drop below 105.80 see a potential wave of further selling being triggered, quickly activating the region around 105.00 again.
If USD/JPY on the other hand captures 108.50/109.00, a stint back above 110 with 110.70 as a target, is on the table:
(Click on image to enlarge)
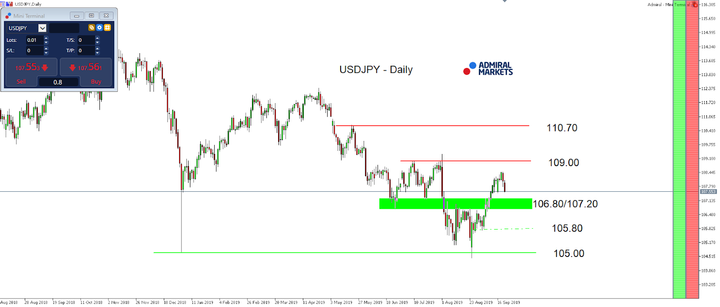
Source: Admiral Markets MT5 with MT5-SE Add-on USD/JPY Daily chart (between June 7, 2018, to September 20, 2019). Accessed: September 20, 2019, at 10:00pm GMT - Please note: Past performance is not a reliable indicator of future results, or future performance.
In 2014, the value of USD/JPY increased by 13.7%, in 2015, it increased by 0.5%, in 2016, it fell by 2.8%, in 2017, it fell by 3.6%, in 2018 it fell by 2.7%, meaning that after five years, it was up by 4.1%.
Gold
While Gold didn't take on further bullish momentum over the last week, instead dropped below 1,500 USD, our mid-term bullish outlook manifested.
As the Fed has cut rates as expected by 25 basis points to 1.75 – 2%, the deeper as expected cut of overnight reverse repos by 0.3% to 1.7% to alleviate funding pressures in short-term lending markets at the beginning of last week, potentially pointing to the first signs of a credit crunch, financial stress and a favourable environment for Gold in general, especially the comments from Fed chairman Powell who said during the press conference that the Fed may resume organic balance sheet growth earlier than thought (bringing a relaunch of QE on the table, at least between the lines) resulted in attention among Gold bulls.
While interesting enough Gold didn't take the bait immediately, we still see the overall advantage in Gold on the upside, technically as long as we trade above 1,380 USD.
In fact, we consider the drop below 1,500 USD not a big deal at all, instead see a potential mid-term long trigger around 1,440/450 USD with an overall potential target around 1,650/700 USD in the weeks to come staying active:
(Click on image to enlarge)
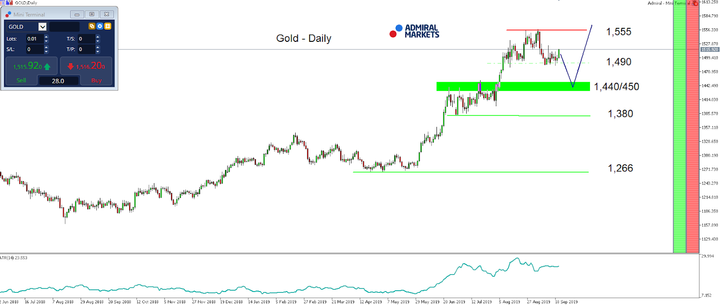
Source: Admiral Markets MT5 with MT5-SE Add-on Gold Daily chart (between June 21, 2018, to September 20, 2019). Accessed: September 20, 2019, at 10:00pm GMT - Please note: Past performance is not a reliable indicator of future results, or future performance.
In 2014, the value of Gold fell by 1.7%, in 2015, it fell by 10.4%, in 2016, it increased by 8.1%, in 2017, it increased by 13.1%, in 2018, it fell by 1.6%, meaning that after five years, it was up by 6.4%.
Disclaimer: The given data provides additional information regarding all analysis, estimates, prognosis, forecasts or other similar assessments or information (hereinafter "Analysis") ...
more

