
The “Factor Zoo”: Some Thoughts On “Is There A Replication Crisis In Finance?”
A few months ago three researchers published an astonishingly ambitious and compendious paper called “Is There a Replication Crisis in Finance?” (Their names are Theis Jensen, Bryan Kelly, and Lasse Pedersen; two are at the Copenhagen Business School, one is at Yale, and two also work for AQR Capital Management.) It attempts to refute several recent papers that have said that there is indeed a replication crisis in finance: that researchers today are unable to replicate the findings of earlier researchers who claimed that going long and/or short certain factors results in improved returns. This new paper appears to prove that factor-based investing actually works. As the authors write,
Our findings challenge the dire view of finance research. We find that the majority of factors do replicate, do survive joint modeling of all factors, do hold up out-of-sample, are strengthened (not weakened) by the large number of observed factors, are further strengthened by global evidence, and the number of factors can be understood as multiple versions of a smaller number of themes. At the same time, a non-trivial minority of factors fail to replicate in our data, but the overall evidence is much less disastrous than some people suggest.
In this article I’m going to summarize their paper and talk about the various factors that they tested, what factors they didn’t test, their factor classification system, some things about their research that remain vague, and some useful conclusions about the results.
The Difference Between This Paper and Previous Ones
What do these researchers do differently than the authors of the you-can’t-replicate-this papers?
- They use one-month holding periods rather than six- or twelve-month periods. (This makes sense to me, as it provides an even playing ground for factors that have short and long look-back periods.)
- They use terciles rather than deciles (earlier papers claimed that a factor didn’t work if the top tenth of stocks ranked by the factor failed to beat the bottom tenth; these authors say that if the top third beats the bottom third, it works; this is a somewhat more forgiving and broader measure).
- They test in 93 different countries. (This is one of the signal merits of this study.)
- They use value-weighted (cap-weighted) results, but winsorize at the 80th percentile of the NYSE, so that massive firms don’t overwhelm the rest. (This makes sense especially if you're designing a system that works for large caps.)
- They exclude factors that the original researchers found insignificant (or at least they say they do, but they end up including a few anyway).
- They measure success for a factor by looking at its alpha rather than its raw return. (This is, in my opinion, exactly the way it should be measured.)
- They use a Bayesian approach to factor evaluation based on the prior assumption that alpha is zero. This, together with considering all factors simultaneously, naturally lowers the p-value threshold for factor success.
As a result, their overall out-of-sample success rate for factors tested in academic papers is a massive 85%. In addition, they find that higher in-sample alphas correspond to higher out-of-sample alphas. Their conclusion: academic research into factors is totally valid.
Why Out-of-Sample Results are Rarely Higher than In-Sample Results
As anyone who does any backtesting can attest, in-sample alpha is always higher than out-of-sample alpha, and this is confirmed by the authors’ testing. The authors don’t explain why, though, so I thought I would.
- Regression to the mean. One must start with the assumption of zero alpha—the assumption that the market is either quite efficient or quite random. In both cases, betting on a factor will prove unprofitable. A researcher will backtest several factors and publish the results for those that work best. Because of the statistical law of regression to the mean, factors that work best over one period are unlikely to work best over another period.
- Arbitrage. Once a factor has been published, investors are going to try to use that factor, thus arbitraging away its effect. For example, let’s say I publish an academic paper that touts a new factor, Factor X, that nobody has used before. A number of investors read that paper and decide to go long stocks with high levels of Factor X and short stocks with low levels of Factor X. If enough investors do this, the prices of stocks with high levels of Factor X will rise and the prices of stocks with low levels of Factor X will fall. After a short while, high–Factor X stocks will be, on the whole, quite expensive and low–Factor X stocks will be quite cheap. This will drastically reduce the profitability of the Factor X–based investing strategy. Very widely used factors such as book-to-market, price-to-earnings, price-to-sales, and return on equity may have been mostly arbitraged away.
- Changes in market structure. There are always going to be fundamental structural changes in market conditions. For example, the elimination of trading commissions has enabled much more frequent placement of small orders. The ready availability of fundamental and aggregate estimate data has enabled a far greater number of people to trade according to factor analysis. The rise of the internet has created huge and fundamental changes in the retail, business-to-business, communications, and technology industries. The creation of new kinds of securities like ETFs and SPACs has fundamentally altered the way people invest. All of these changes create conditions in which replicating the success of past factors will be difficult.
- Manipulation of data. The more certain factors become important to shareholders, the more financial officers at companies will try to give the shareholders what they want. Companies are given rather broad discretion in reporting various expenses, and there is strong evidence that they manipulate earnings, EBITDA, and free-cash-flow numbers to influence their stock price. This makes it harder to replicate findings based on those numbers.
Classification of Factors
The authors algorithmically classified the hundreds of factors they tested into thirteen “themes,” based on the correlation of their returns. Taken all together, these themes attempt to comprise a rather efficient portrait of market behavior. However, there are, in my opinion, many major logical errors in the classification, and there are several additional “themes” that the authors didn’t test. I’ll talk about each one briefly, in alphabetical order.
- Accruals. This theme consists of five factors: operating accruals and total accruals, each divided by total assets, and each divided by net income, along with the one-year change in current operating working capital divided by total assets. (Operating accruals is the difference between net income and operating cash flow; total accruals adds net financial assets to the mix; and current operating working capital is simply the portion of net operating assets that are current assets.) What’s missing here is the traditional definition of accruals as the one-year change in net operating assets; that ends up in the “investment” theme.
- Debt Issuance. While this theme includes three-year growth in debt and changes in liability, it also includes net operating assets to total assets and a factor called “abnormal corporate investment,” which is calculated according to the ratio of capital expenditures to sales. Neither of these have anything to do with new debt issuance or reduction.
- Investment. This is a real grab bag of factors including balance-sheet accruals (change in net operating assets), inventory changes, capex changes, asset growth, changes in noncurrent operating assets, some long-term mean reversion measures, and sales growth. This category is, simply put, a mess.
- Leverage. Another grab bag. This includes a few factors that you’d expect in this category, like assets to equity, cash to assets, debt to price, and the Altman Z-score. It also, however, includes two R&D-related factors, earnings volatility, the high-low bid-ask spread, and the age of the firm.
- Low Risk. Most of these factors are related to market beta, including idiosyncratic volatility and share turnover. Two have to do with the volatility of fundamentals: cash flow volatility and earnings variability. And some of the short-term volatility factors double in a sense as short-term mean reversion factors. But also lumped into this category is free cash flow to price and net total share issuance.
- Momentum. This comprises eight highly related factors, all having to do with six-to-twelve-month momentum but measured in different ways.
- Profit growth. This includes some expected factors like the change in sales minus the change in inventory or the change in return on equity. But it also includes earnings surprises and a few leftover momentum factors that I assume didn’t correlate as well to the others.
- Profitability. This includes Piotroski’s F-score, Ohlson’s O-score, operating cash flow to assets, operating profits to equity, return on equity, profit margin, and so on, along with a couple of completely unrelated factors having to do with the coefficient of variation of share volume.
- Quality. The difference between quality and profitability factors, as the authors categorize them, is a bit fuzzy for me. This category includes asset turnover, gross profits to assets, ROA, operating ROA, gross margin change minus sales change, the number of consecutive quarters with earnings increases, and a few other things.
- Seasonality. I confess I had not come across this concept prior to reading this paper; the idea is that stocks tend to go up and down in the same months year after year, so you go long stocks with large upward price moves five or ten years ago in the same month that you open your position, as well as stocks with large downward price moves five or ten years ago in the other eleven months. But for some reason the authors also stick some completely unrelated factors in this category, e.g. net debt issuance, earnings persistence, and change in long-term investments.
- Size. Interestingly, besides the expected factors—Amihud’s measure, daily dollar volume, market cap, and price per share—R&D expenses to market cap is also included here.
- Skewness. The authors list various skewness measures along with one-month short-term mean reversion.
- Value. These are more or less what you’d expect: earnings yield, price to sales, book to market, dividend yield, various versions of buyback yield and shareholder yield, and operating cash flow to market. But this category includes only two enterprise value-based ratios and no free cash flow or R&D-based ratios. And it includes a real weird one: total assets to market cap, which makes no financial sense (total assets have to be compared to enterprise value, not to equity; this factor apparently comes from Fama and French, who I’d think would know better, so something odd is happening here).
As you’ve undoubtedly noticed, I’m quite skeptical about this factor classification. In addition, there are no estimate-based factors, only one short-term mean-reversion factor, only three or four fundamental stability factors (factors that measure the stability of a company’s fundamentals), no industry-specific factors, and no ownership factors (like insider buying, percent held by institutions, short interest, etc.). The debt and leverage-based factors do not include such common measures as debt to cash flow, debt to EBITDA, current ratio, or quick ratio; there’s no mention of post-earnings-announcement drift; and there’s little use of enterprise value-based ratios.
Factor Performance
The authors tested each factor over the 1975 to 2019 period and isolated the post-publication portion of the returns. I’ll give a few of the results below.
The best five factors for the US market over the entire period were:
- cash-based operating profits to total assets (this is EBITDA plus R&D expenses minus operating accruals all divided by total assets; interestingly, this factor was not found to be significant in the original paper);
- one-year net operating assets change to total assets;
- 12-month residual momentum (this is more or less the Fama-French 3-factor alpha over the last twelve months, not including the most recent month);
- one-year current operating working capital change to total assets; and
- net operating assets to total assets.
The best five factors for the non-US developed market over the entire period were:
- 12-month residual momentum;
- 12-month net equity payout (this is the log of the 12-month increase in price minus the log of the 12-month increase in market cap);
- 21-day idiosyncratic volatility (based on 4-factor alpha);
- six-to-ten-year lagged returns, non-annual (this is the returns of the stock in the other eleven months besides the one you’re in, six to ten years ago, with worse returns being better); and
- 12-month adjusted change in share count (which is essentially the same as the second factor on this list, but measured differently).
This is just a small sample of the hundreds of factors that had positive alpha.
A number of the best-performing factors that the authors tested are variations on one central concept: that net operating assets, cash-based accruals, and net operating working capital (which are all closely related) should be low in comparison to total assets. I wrote an article about this years ago, and it’s been a constantly useful factor for me ever since; it’s nice to see how many variations of this concept there are.
Interestingly, not a single value factor ranks highly. Of the various value factors that were tested, the best was free cash flow to market cap, followed closely by operating cash flow to market cap and shareholder yield (which they call “equity net payout to market cap”). The next two value factors are EBITDA to EV and earnings yield. But they’re all pretty close to each other. The reason they don't rank highly, I suspect, is twofold: first, in testing them, the authors, I believe, compared their values to the entire universe of companies they were testing rather than to the company industry; second, the value factor has had a very high beta lately, which lowers its alpha.
Putting the Authors’ Conclusions into Practice
If we were to put together a multifactor ranking system according to the authors’ conclusions in this paper, in theory it would probably be best to do the following:
- include one factor from each category, since the categories are relatively uncorrelated;
- include the factors with the highest overall alpha, since out-of-sample alpha varies a great deal from factor to factor in terms of what years are covered; and
- weight the factors according to their overall alpha.
I have therefore designed a ranking system that does exactly this, based on the factor alphas in the US. The thirteen factors are, in order of highest to lowest alpha, the five in the above list followed by:
- change in sales minus change in inventory;
- operating cash flow to assets;
- highest five days of return scaled by volatility (this is the average of the five highest out of the last 21 days’ return divided by the volatility of the stock over the last year), lower values better;
- free cash flow to price
- net payout yield (dividends paid plus equity purchased minus equity issued, all divided by market cap)
- years 6 to 10 lagged return, nonannual (see above description);
- R&D to market cap; and
- asset tangibility (a complex measure of how tangible the total assets are; this factor’s alpha is very low, but is the highest in its category, which is “Leverage”).
If you are a Portfolio123 member, you can find the ranking system here. This is what it looks like:
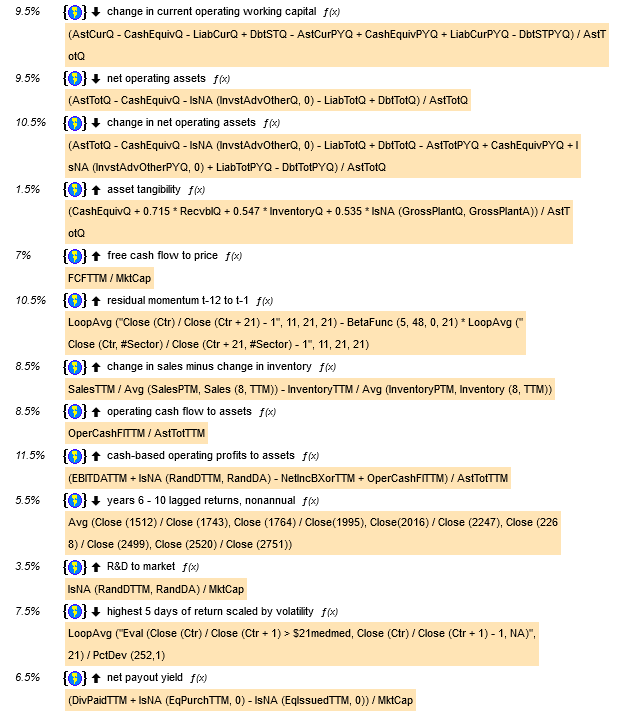
(Two of the above formulas need a little further explanation. First, in the paper, residual momentum is the Fama-French three-factor alpha; I used a simpler version of alpha here since calculating Fama-French beta isn't possible using Portfolio123. Second, the “highest 5 days of return” required a custom formula, which I called “$21medmed,” which is LoopMedian ("Eval (Close (Ctr) / Close (Ctr + 1) > $21med, Close (Ctr) / Close (Ctr + 1), NA)", 21) where $21med is another custom formula, LoopMedian ("Close (Ctr) / Close (Ctr + 1)", 21).)
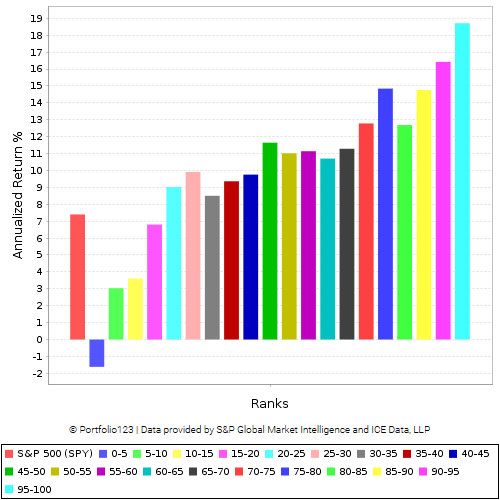
The authors tested their factors on a universe that excluded any stocks with a market cap less than the 20th percentile of the NYSE (currently about $800 million). I was able to approximate this limitation and ran a 20-bucket test using Compustat data with four-week rebalancing covering the years 1999 to 2021. This was the result:
If I run the test to cover only the last ten years, the results aren’t quite as good, but they’re still nothing to sneeze at:
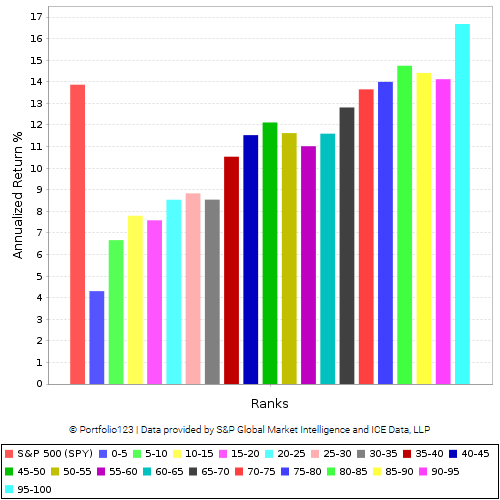
This strikes me as a decent ranking system for mid-caps and large-caps going forward, though there are a large number of improvements I would make.
Currently, the top ten stocks that this system recommends are Medifast (MED), Myovant Sciences (MYOV), Smith & Wesson (SWBI), Evertz Technologies (EVTZF), Sonos (SONO), Translate Bio (TBIO), Overstock (OSTK), Internet Initiative Japan (IIJIY), Tupperware (TUP), and Michaels (MIK).
Conclusions
I found the authors’ conclusions intensely gratifying. Factor-based investing works! I was also immensely pleased that the authors refrained from calling these factors “anomalies,” as is so often done in academic literature.
But I was dismayed by the numerous flaws in the authors’ paper:
- The factor results are presented in a terribly difficult-to-parse manner. The authors use “posterior” and “out-of-sample” seemingly interchangeably, yet some of these papers were published very recently and at one point they make it clear that some of the out-of-sample period was prior to the in-sample period (i.e. in the original paper, the testing period began after 1975 and the authors used the pre-1975 data). In general, the presentation of the results is terribly confusing. The world posterior results are included as a bar chart with labels that are almost too tiny to read and nearly impossible to match to the bars. It took me many hours to figure out which factors worked best, how they were constructed, what category they were in, and what sample period was being used.
- The classification of factors is more or less a joke. It’s an ambitious endeavor and the authors are to be commended for the attempt, but about half of the categories include factors that by no stretch of the imagination belong there, other categories are missing important factors, and a number of factors remain uncategorized. The fact that the best performing (out-of-sample) value factor, free cash flow to market cap, isn’t even classified as a value factor, while its close cousin operating cash flow to market cap is, indicates the problems here.
- A huge number of the factors are simply variations of each other, and a huge number of factors (especially those involving analyst and ownership data) went untested.
- There is no indication whether any of these factors were tested against similar companies. Certainly similar-company testing (testing against other companies in the same industry or sector) has long been a valid approach, and I find it hard to believe that none of the original papers used it. But there’s no sign of this distinction in the authors’ work. I would guess that the value factors would show far better results if they were tested against other companies in the same industry or sector rather than against the universe of stocks as a whole.
It almost goes without saying that a multi-factor approach to investing, in which every stock is subjected to a number of factor tests and those that rank the highest are purchased, makes good sense, and this paper, while neither affirming or condoning the approach, goes a long way toward validating its various inputs. Despite its flaws, it’s a major contribution to the literature.
My CAGR since 1/1/2016: 48%.
Disclosure: My top ten holdings right now: STRT, CTG, PMTS, RMNI, HBP, EVC, WFG, INSE, RCKY, TGLS.


