
The Euro, The Yen, The Loonie: Really The Same Old Song?
Euro looks to be dealing us yet another day characterized as more of the same. Many of you would ask here, does the upswing have legs? Or is it rather a dead cat bounce? Armed with insights to the teeth, it still requires patience to let the market reveal its true colors. Not asleep at the wheel in the meantime, we carefully examine the standing of our other open positions. High time to update you.
EUR/USD – How Serious Are The Bulls Actually?
(Click on image to enlarge)
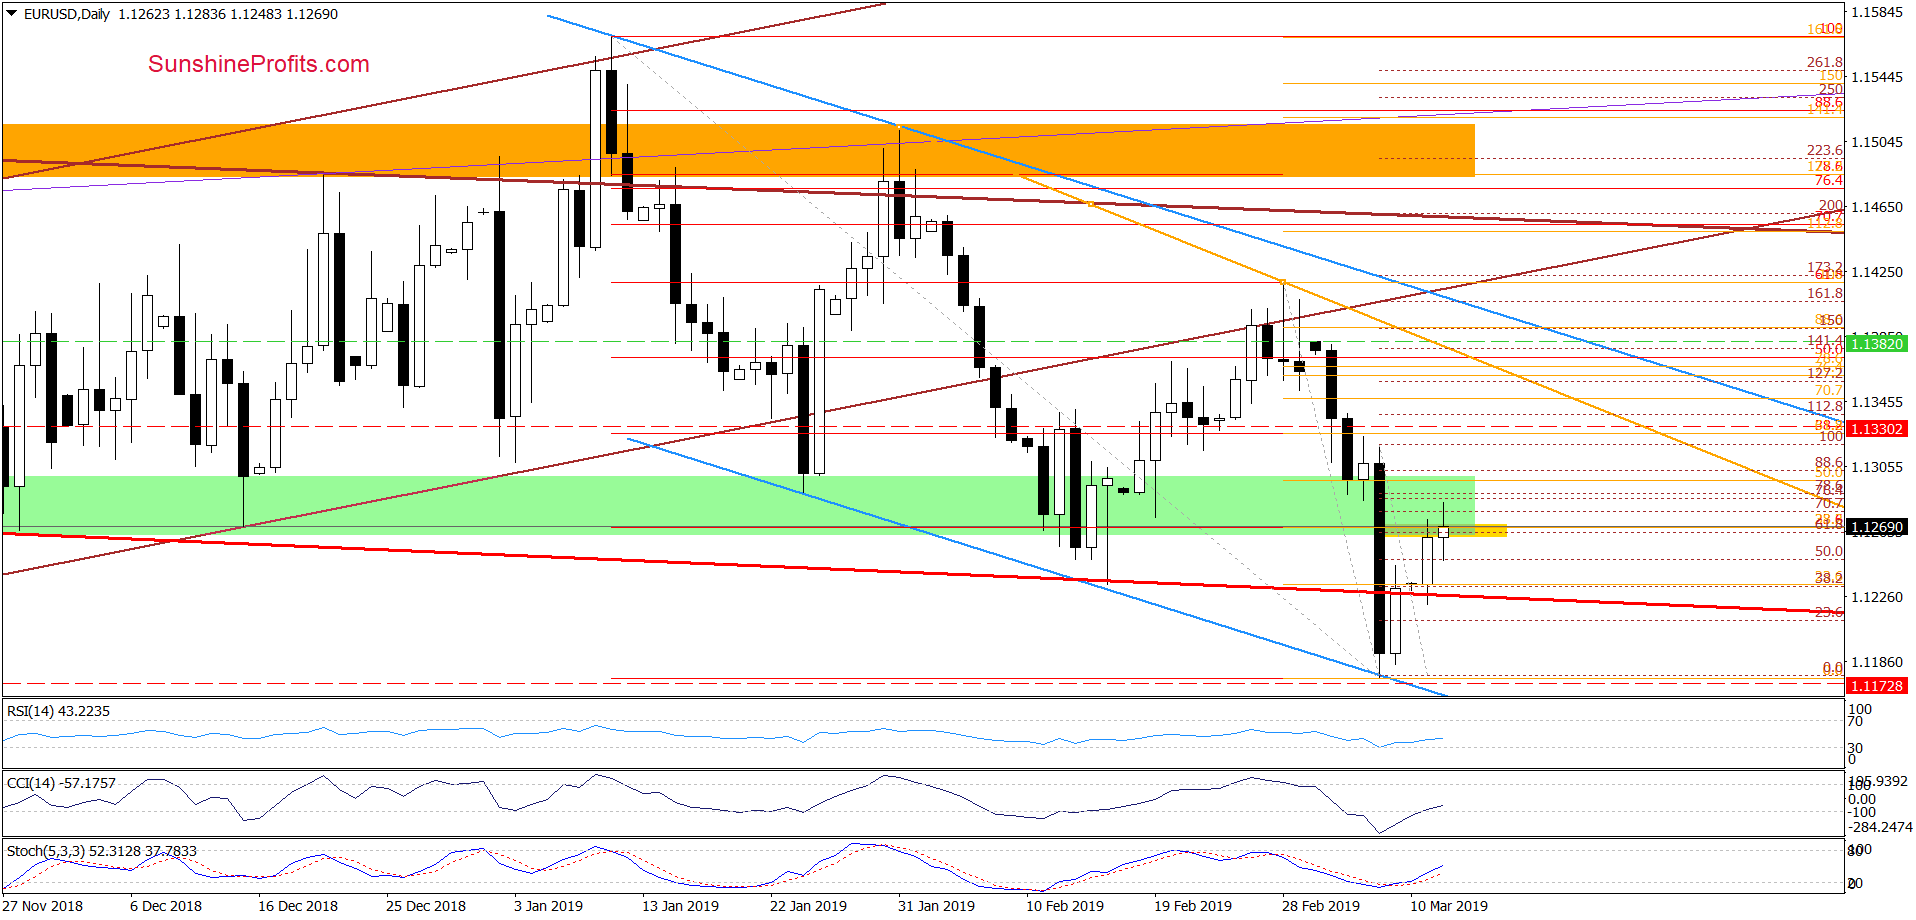
Attempting to build on yesterday’s upside momentum, EUR/USD extended gains earlier today. The result is a climb above the yellow resistance zone the importance of which we discussed yesterday:
(…) the very short-term yellow resistance zone created by three Fibonacci retracements: the 61.8% based on the Thursday’s sharp decline, the 38.2% based on the late-February-early March downward move and the 23.6% based on the entire October-March move.
Despite this improvement, the combination of the 76.4% and 78.6% Fibonacci retracements stopped the buyers. As long as we don’t see any breakout above the peak of Thursday’s candlestick, it looks like another attempt to move lower is just around the corner.
If that’s indeed the case, we’ll likely see at least a test of the last week’s lows or even the lower border of the blue declining trend channel in the following days.
USD/JPY – Hanging On By Its Fingernails
(Click on image to enlarge)
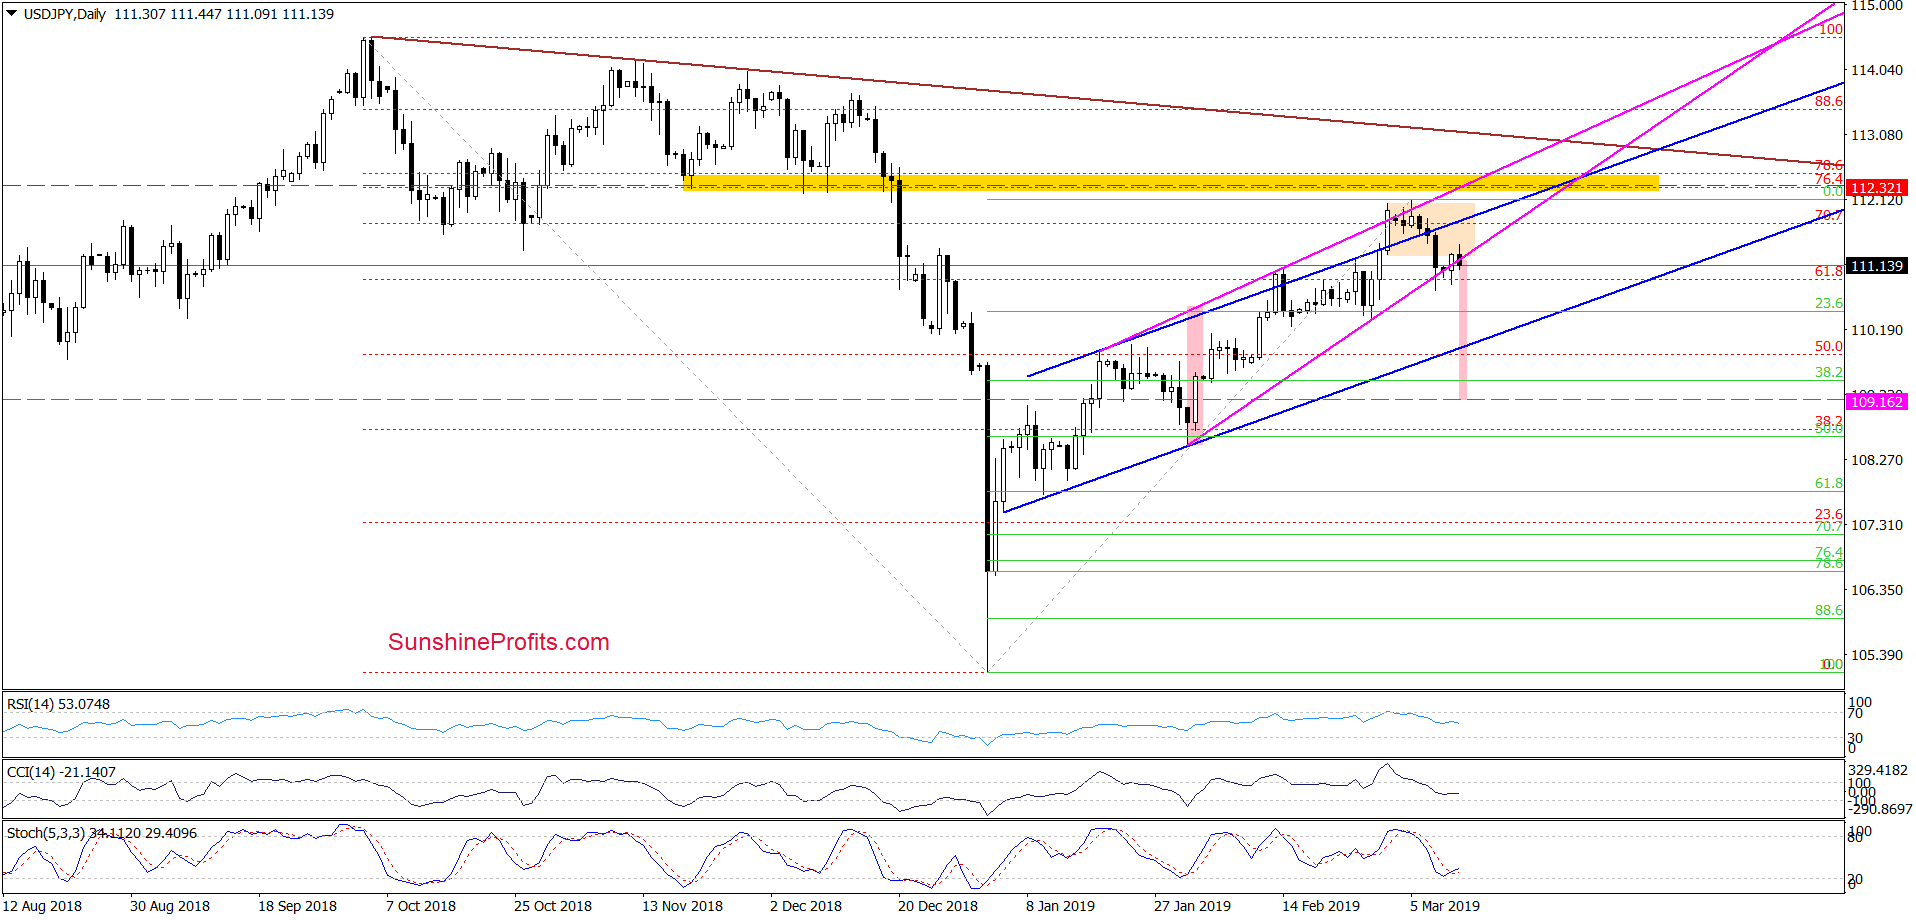
USD/JPY looks to be striving hard to remain inside the pink rising wedge. Bouncing a bit yesterday but the upside move appears to be fizzling out as the pair currently trades at around 111.20.
It means that USD/JPY is moving lower once again and trades back below the lower border of the pink wedge. This increases the likelihood of further deterioration in the coming days.
Should we see a daily close below the above-mentioned wedge border, the pair will likely extend losses and test the lower border of the blue rising trend channel (currently at around 109.93). Additionally, there’s the 50% Fibonacci retracement nearby. Considering the size of the pink wedge in approximating the potential price target, with sufficient commitment currency bears can comfortably push USD/JPY down to around 109.94. That’s as close as it gets in target setting really – both approaches are giving virtually identical targets.
USD/CAD – Bouncing From Support?
(Click on image to enlarge)
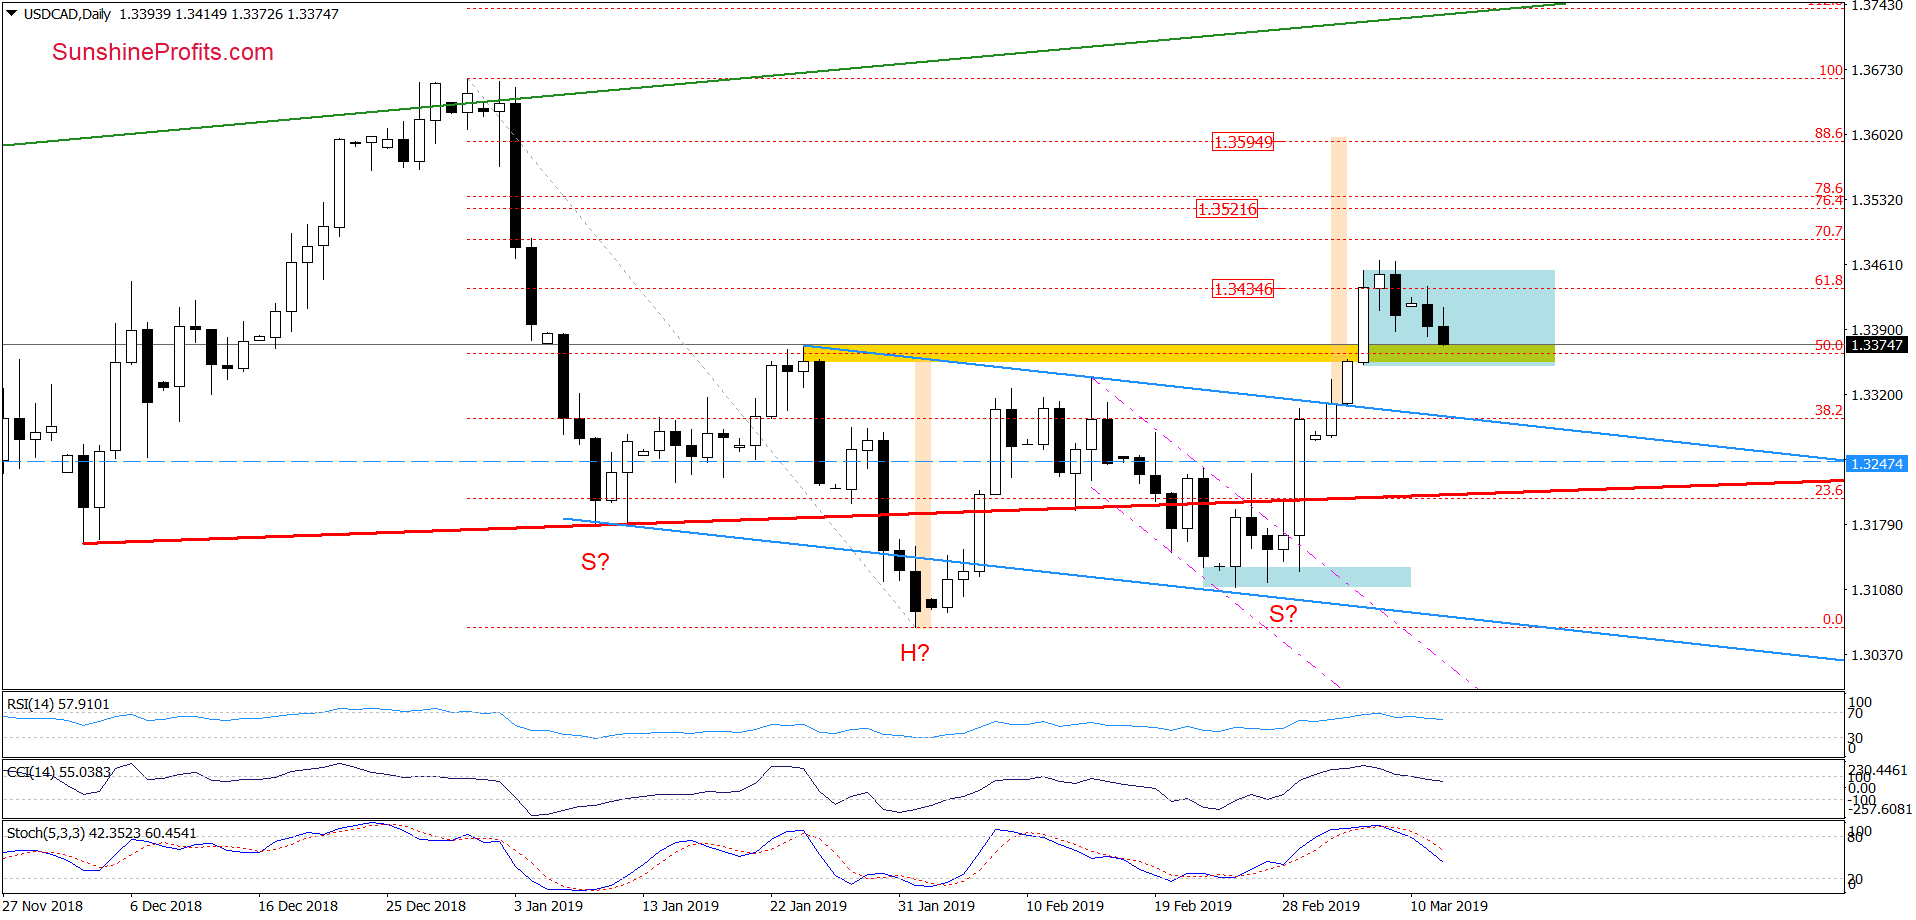
We observed USD/CAD attempting to extend gains late in the previous week that were met with a subsequent pullback. We mentioned on Friday that this:
(…) could be nothing more than a verification of the earlier breakout above the yellow resistance zone.
Indeed, this still looks to be the case today. Therefore, as long as there is no daily close below the yellow resistance-turned-support zone, another attempt to move higher wouldn’t surprise us in the least.


