
The Economy At Trump’s End
In recovery (as Jim noted using GDP), but not recovered. And maybe even declining for certain key indicators.
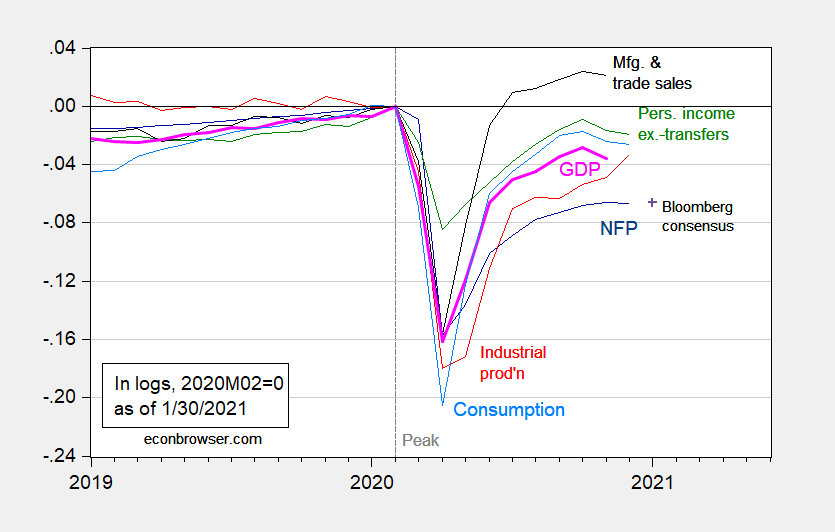
Figure 1: Nonfarm payroll employment (dark blue), Bloomberg consensus for January as of 1/30 (blue square), industrial production (red), personal income excluding transfers in Ch.2012$ (green), manufacturing and trade sales in Ch.2012$ (black), consumption in Ch.2012$ (light blue), and monthly GDP in Ch.2012$ (pink), all log normalized to 2020M02=0. Source: BLS, Federal Reserve, BEA, via FRED, IHS Markit (nee Macroeconomic Advisers) (1/4/2021 release), NBER, and author’s calculations.
These recent trends place in context fears of overheating the economy (e.g., as recounted in Irwin/NYT). The output gap using the most recent CBO estimate of potential is -2.9% (log terms), using the January 2020 estimate is -3.7%. The $1.9 trillion package that has been proposed is seen as risking overheating by some — but if maximal output is a better measure of the economy’s speed limit, then the slack is -4.5%. The multiplier of 0.6 CBO uses for a period of social distancing means that, even with the $900 billion package signed at year end, overheating seems less of a concern.
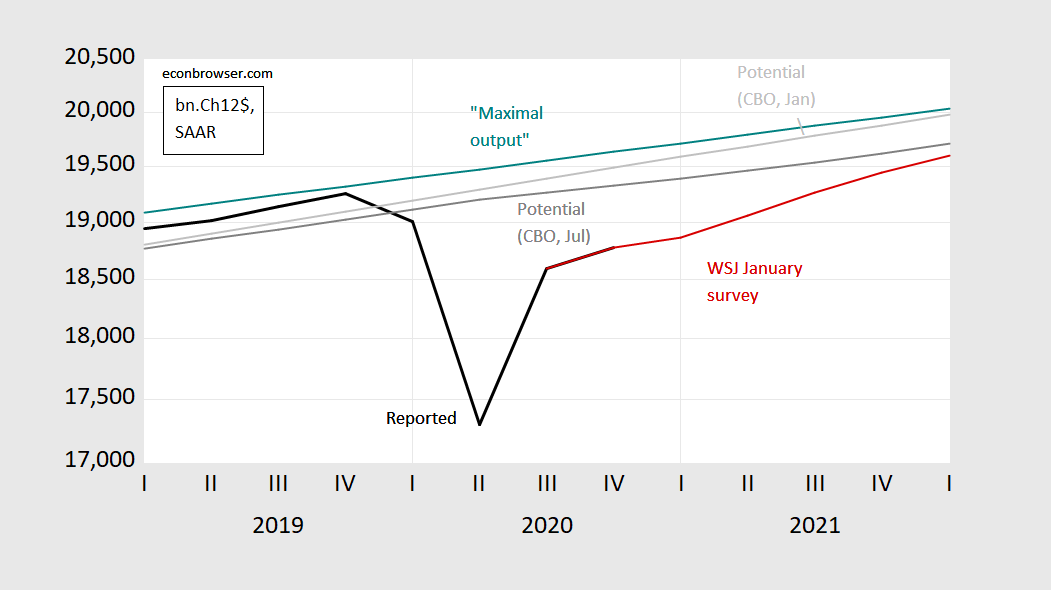
Figure 2: GDP (black), GDP forecast from WSJ January survey (red), CBO estimate of potential in July (dark gray), in January 2020 (light gray), maximal output following Delong-Summers (teal), all in billion Ch.2012$. Source: BEA 2020Q4 advance, WSJ January survey, CBO, and author’s calculations.
Moreover, stimulus of aggregate demand is not the main objective of the recovery packages. Preventing the scarring effects of firm bankruptcies and labor force attrition is.
And, nonfarm payroll employment is 2.1% lower than it was the month Mr. Trump took office.
Disclosure: None.


