
The Economy & Trade Feud Face-Off This Week
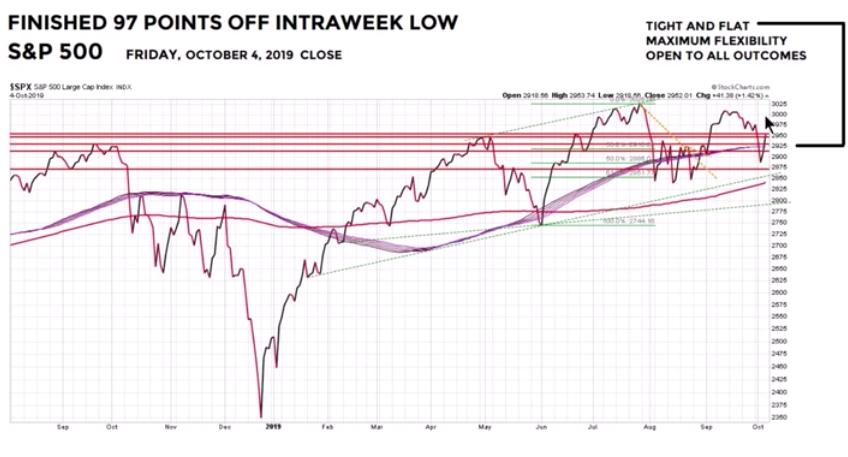
If you enjoy roller coasters then you probably enjoyed the market action this past trading week. From peak to trough the S&P 500 (SPX) fell nearly 3% intra-week, before rebounding Thursday-Friday. The latest ISM data proved to question bullish market and economic trends, but failed to give sustainable rise to bearish market sentiment, at least for now. (Chart from Jill Millinski)
All Things S&P 500, With Market Internals
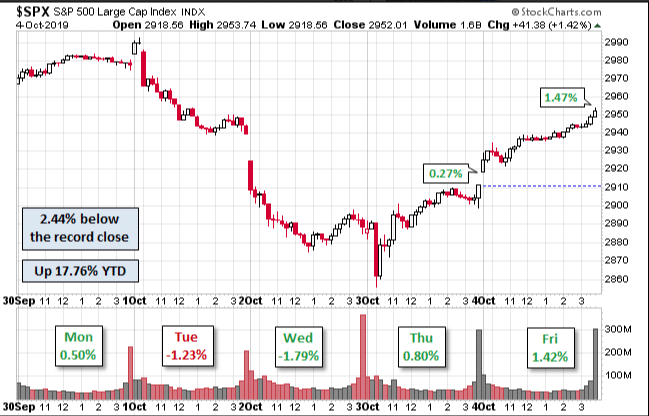
The S&P gyrated this past week, ending Friday up 1.4% from Thursday and down 0.33% from the previous week's closing price. The benchmark index is still up 17.76% for the year, although still stuck in a 20-month consolidation pattern. Bulls made an important stand during the week, just above the simple 200-DMA and after the intraday breach of the 200-EMA on Thursday.
While it is unrecognizable in the S&P 500 chart above, the light green line represents the 200-EMA, which was breached intraday and after the ISM Non-manufacturing/service data was released. The data came in much weaker than expected but remained with growth or within expansion territory. The initial reaction from investors was to sell stocks, but once the technical breach came to fruition, algos were found without supportive selling pressure and shorts were found covering rather quickly.
One of the more important technical achievements for the market this past week was the filling of multiple gaps in the S&P 500 that had been in place since early September. They were all filled at: 2,957-2,939 and 2,911-2,880. Beyond this technical achievement and from revisiting the August consolidation zone...
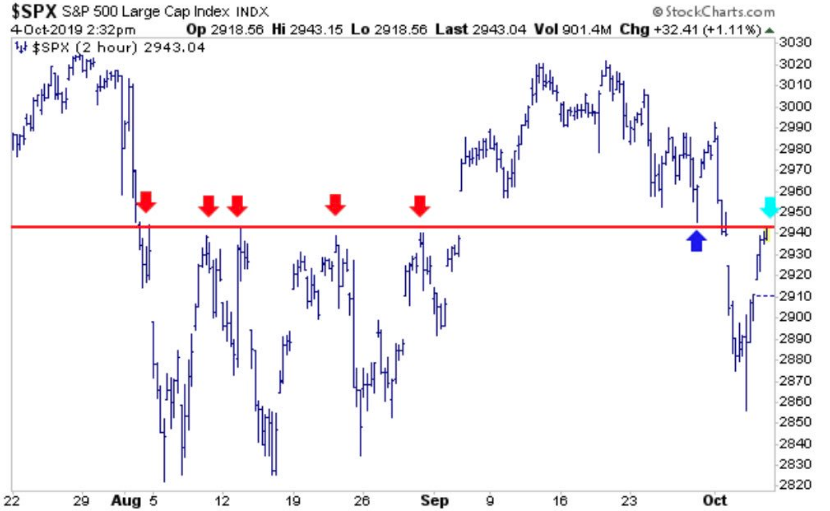
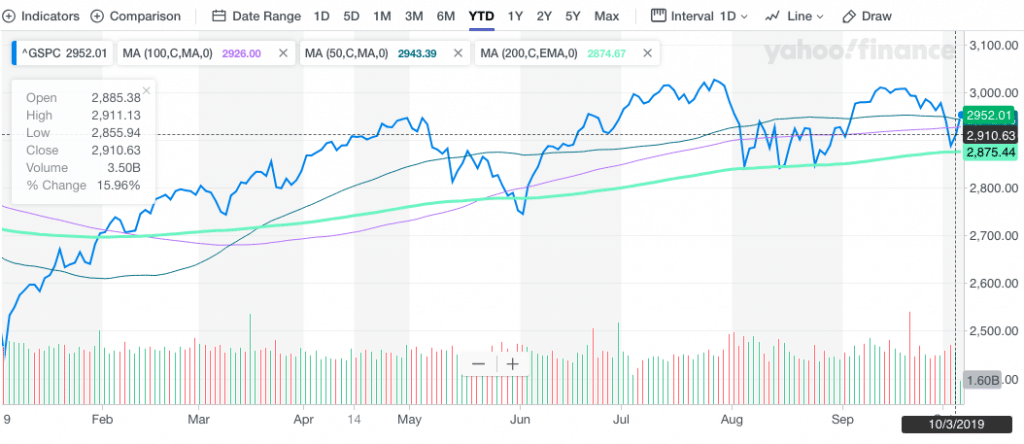
The chart above identifies that all-too-important 2,940 resistance level that the S&P 500 had such difficulty with in August, before breaking out in September. On Friday, with strong momentum building, the S&P 500 managed to break and close above this resistance level. Most relevant for the bulls, however, was that the S&P 500 managed to rally and close back above the 50-DMA for the week. The bulls did a lot of heavy lifting last week, a lot of heavy lifting. The following chart/s come to us from Ciovacco Capital and identify just how much lifting the bulls had to accomplish last week in order to recapture and close above the 50-DMA:
That was quite a week folks, quite a week and the S&P 500 had quite the rally off of the lows intra-week! Friday's rally was rather uniform to end the week also. What do we mean by uniform you might be asking? All 3 major averages finished higher by roughly the same amount, 1.42% for the day.
Some of the other bullish charts recognize that the S&P 500 is now down 3 weeks in a row, but holding true to support and resistance levels.
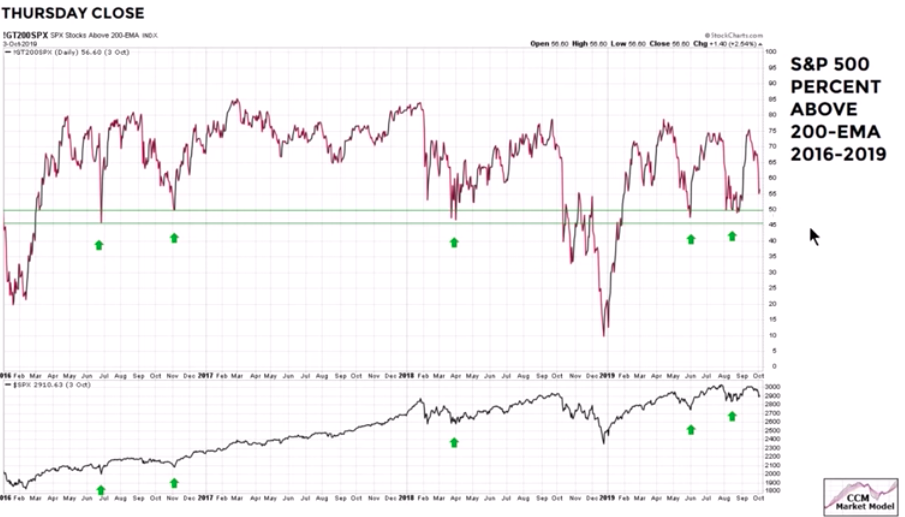
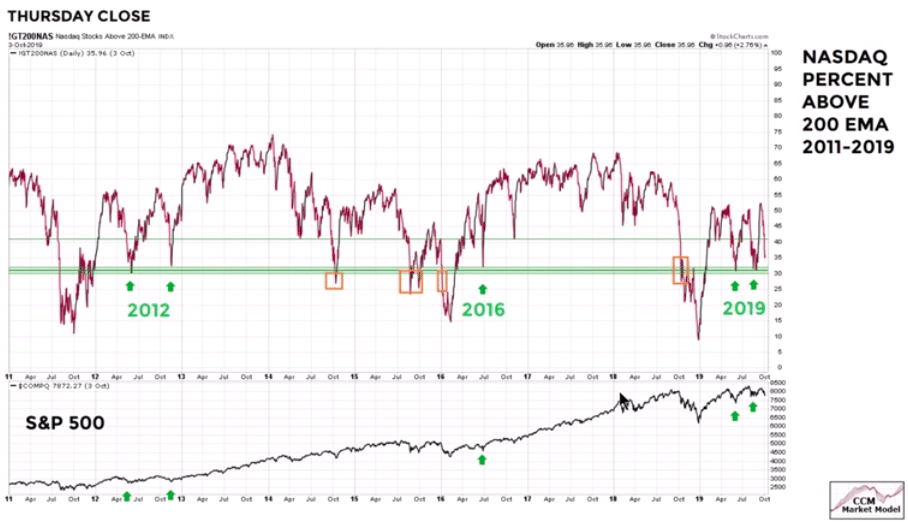
The number of S&P 500 stocks holding above their 200-EMA has been weakening of late, but still holds above a key support level. While we don't cover the Nasdaq (NDX) a whole lot in our weekly commentary, the same can be said for the tech-heavy index, which actually rose roughly 1% for the trading week.
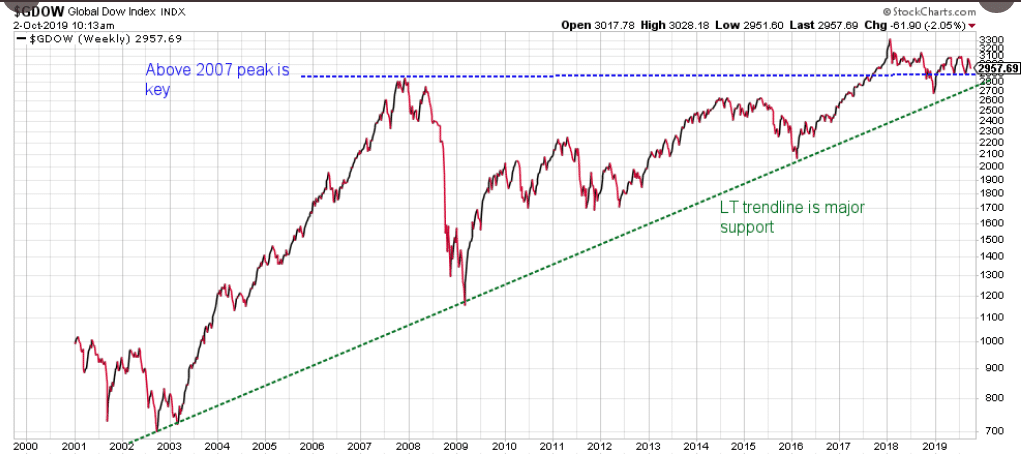
More importantly, than these 2 charts above are likely the following technical viewpoints. The first chart, below, is a look at the long-term trend line for the Global Dow Index, which remains slightly above its key support level that coincides with the 2007 peak. The only time over the last 20 months that it has been below the 2007 peak was in Q4 of 2018.
Let's pause right here for just a moment to reflect on market sentiment... and why? We want subscribers to think about why investor sentiment is so bearish? I believe the reason is because the stock market, while making slightly new highs over the last 20 months, has still remained in a narrow range, consolidating for all this time and basically moving sideways. True, it hasn't been going down and true it hasn't been moving higher but for brief moments; it's the sideways consolidation that breeds frustration and finds even the most ardent bulls turning bearish.
Remember, it was in May that the S&P 500 reached the first record high since September of 2018 and after a massive rally off the December 24, 2018 lows. But when we look at that high and compare it to where we are today, well we are only a few points higher yet again. Moreover, look at the bottom box within the following S&P 500 chart below:
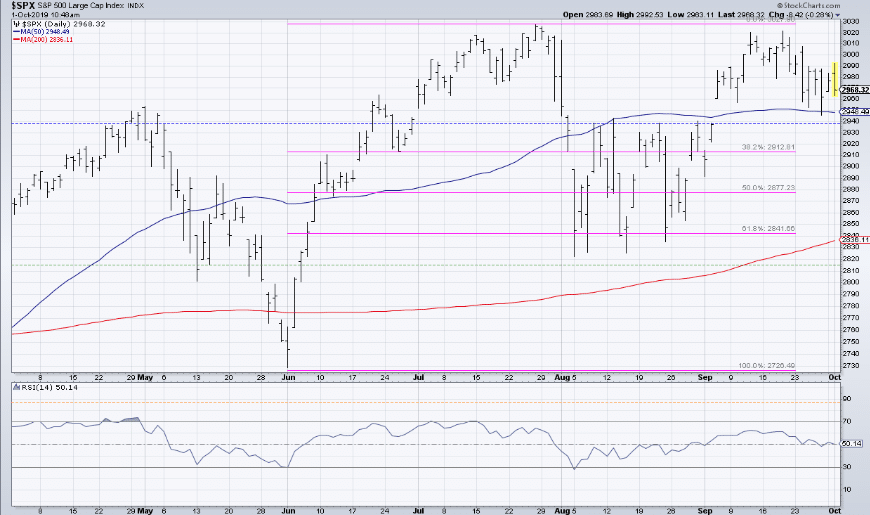
The bottom box is the S&P 500 14-Day RSI, which has averaged 50 over the last several months. The RSI closed the week just under 50, suggesting market momentum/strength is pretty neutral; not overbought and not oversold although sentiment paints a different picture. Nonetheless, here is another chart we find somewhat bullish, given how poorly Asian economies are performing in 2019 and where many semiconductors are manufactured and sold.
Heading into trade talks with China this coming week, the chart of the Semiconductor ETF (SMH) looks rather strong. Do they know something that we don't know? Here's another way to look at the Semiconductor ETF, with moving averages, in the following chart:
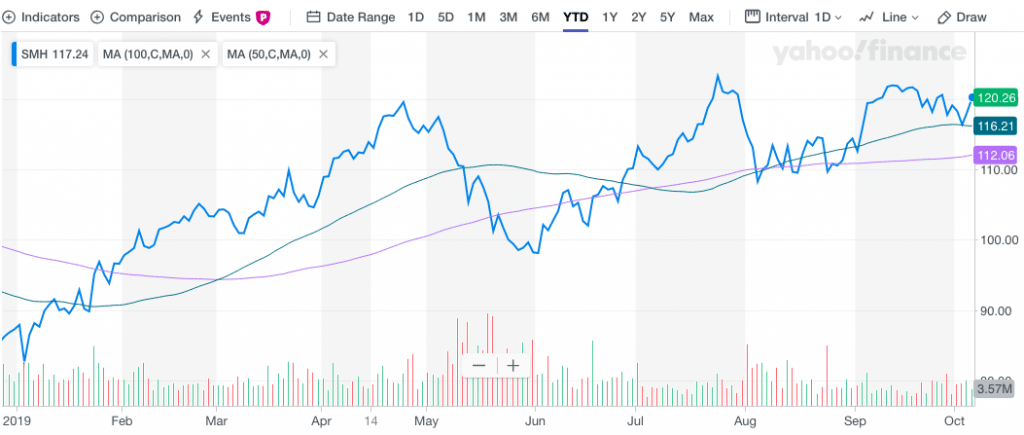
As we can see from the chart, the SMH is not only well above the 200-DMA, but it touched the 50-DMA this past trading week before bouncing off it and finishing significantly higher. This is the type of action we'd describe as bullish, especially going into a geopolitically charged event on October 10th. And how about the Dow Jones Transports (DJT)?
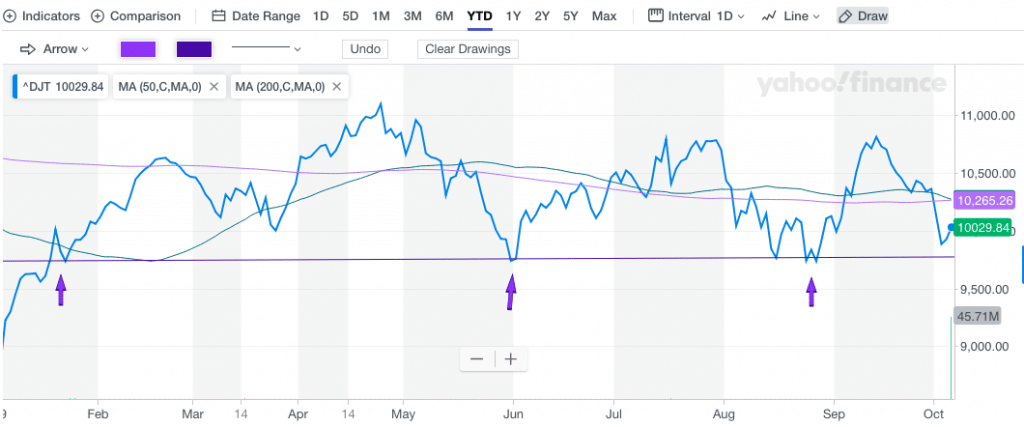
While the index is definitively weaker than I would like it to be, trading below both the 50 and 200-DMA, the trend-line support continues to hold strong. it has touched the trend line on 4 separate occasions this year. Last week, while the Dow Jones Industrial Average itself fell roughly 1000 points before it trough intra-week, the DJT briefly touched the trend line intraday and before turning higher once again. Having said that, this is still a bearish indicator presently and with respect to the moving averages, but if the Transports are above their June lows the bulls are still in control.
Taken as a whole and with all the positioned charts above we understand there remains a lingering question, "Should we step in and buy equities/ETFs at this time?" The answer is simple: Long-term investors have the greatest advantage as they can afford to ride out downturns, should they take place near-term. If this is your situation, your opportunity is more broad-based than others. For trend traders, the technicals and momentum suggest the market is extremely neutral at this point in time and begs of additional information to be delivered and digested by the market, in order to move further away from neutral status and toward a breakout or breakdown. See, simple ;-)!
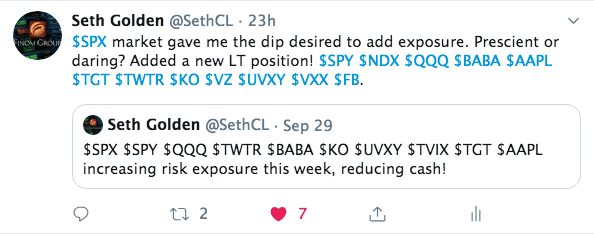
What I can say is that I recently increased his market exposure, as outlined in last week's tweet:
There may still yet be some market weakness ahead if the support line for the S&P 500 Bullish Percent Index is any indication. It has been retreating for the past 2 weeks after recently peaking above 68% recently.
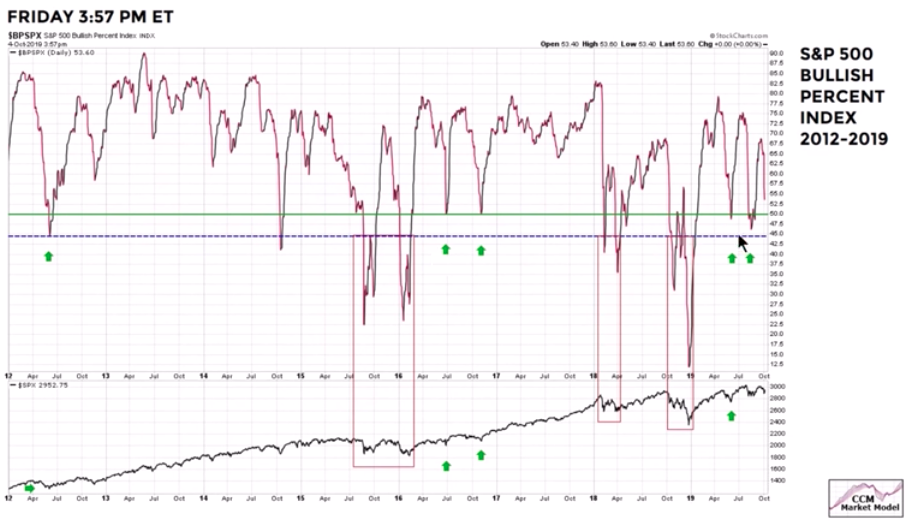
With the BPI ending the week at 53.50, support comes in at 50.20, just a stones throw away. We can't stress enough how critical this coming week's U.S./China trade talks will be for markets, investors and the Q4 2019 period as a whole. This is quite literally a "make-or-break" week geopolitically and economically speaking.
After a tumultuous and roller coaster ride this past trading week, investors are hoping for a bit more complacency in the week to come. Something rather comical can be offered based on how volatile markets were in the past trading week; "The VIX was lower for the week by roughly 1 percent!" How funny is that? S&P 500 down for the week, and down nearly 3% over the course of 2 trading days and yet the VIX was down 1 percent. Even with the VIX moving lower for the week, for this coming week investors are anticipating an increase in implied volatility. The weekly expected move has jumped nicely.
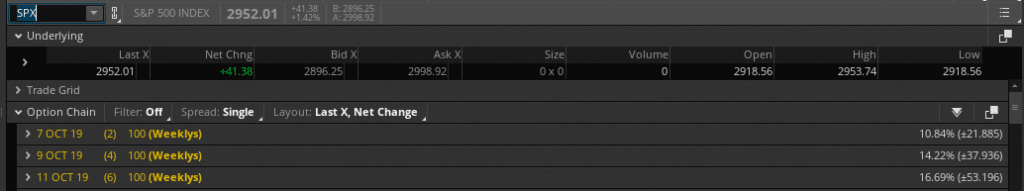
Given the realized market volatility that took place this past trading week and how crucial trade talks are for the market in the coming week, investors are pricing in a weekly expected move of $53/points for the S&P 500. With the S&P 500 ending the past trading week at 2,952, the probabilities are it will either achieve 3,000 once again or breakdown below 2,900... once again.
On another note, the VIX has already proven true to form for its typical October characteristics. Last week, the VIX hit 21, before crashing.
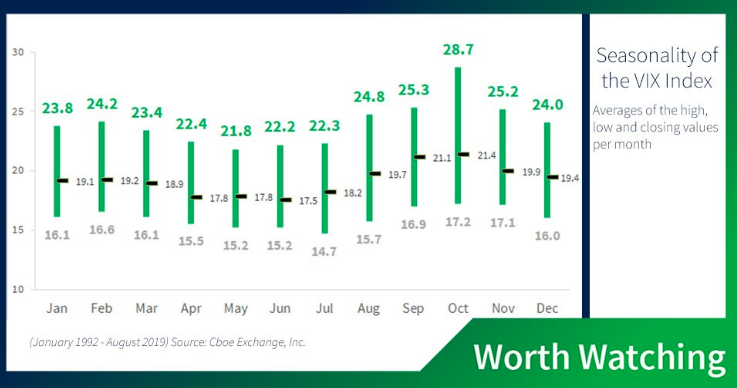
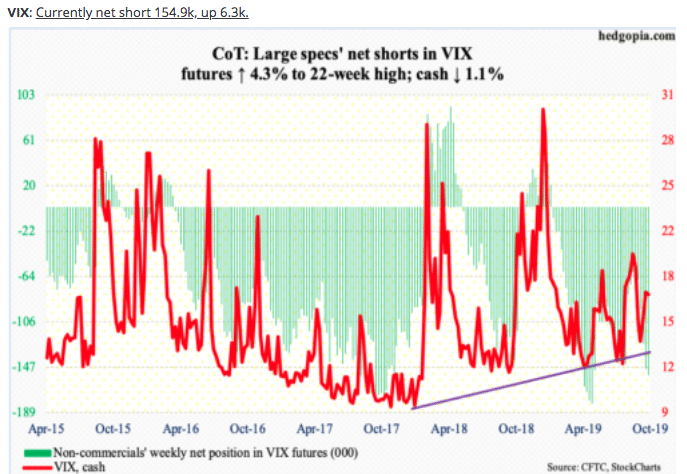
We'll have to wait and see if the index achieves its average high of 28.7 this month or defies history. The one thing that could certainly help it with such defiance would be positive developments from this coming week's trade talks. With that being said, noncommercial hedge funds have been adding to their short, VIX Futures positions of late.
Economic Data & Trade Talks
The economic data for the past trading week was met with groans, jeers and cheers. The ISM data stole the headlines and trading activity for much of the week, while the BLS Nonfarm Payroll data rallied markets to end the trading week. So let's start again with the ISM data from the manufacturing side. Manufacturing has less of an impact on U.S. GDP given it is less than 12% of nominal GDP. The following is from Finom Group's (for who I am employed) article titled "ISM Sinks Markets, Will ADP Provide Support?" So kindly forgive the redundancy, but it bears repeating.
"The Institute for Supply Management said its manufacturing index fell to 47.8% last month from 49.1%, marking the lowest level since June 2009.
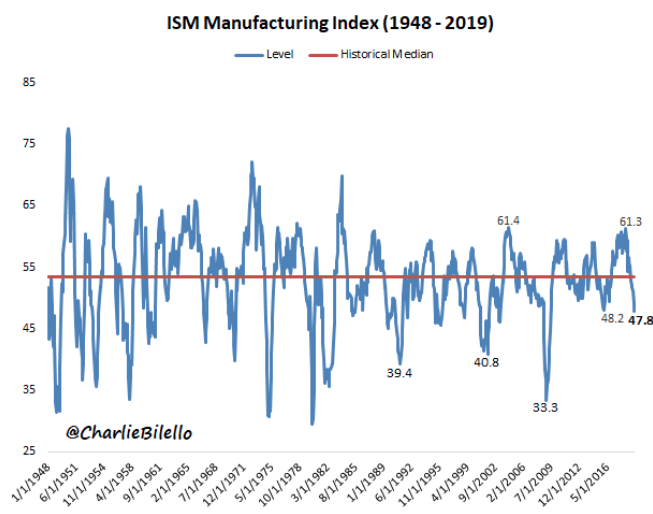
"Only three of the 18 U.S. manufacturing industries tracked by ISM reported growth, down from nine in the prior month. The data from ISM has been weakening ever since August 2018, a month after the first tranche of tariffs were imposed on China. The index went from the best ISM numbers in 16 years to the worst in 10 years as of September 2019.
In earnest, most economists and myself had anticipated an increase in the ISM Manufacturing Index. Regional PMIs were improving around the globe and domestically, but it appears that tariffs remain front and center in the survey. Yes survey! Keep in mind the ISM Manufacturing Index is just that, a survey, soft data. Moreover, the ISM Manufacturing Index survey doesn’t propose questions about the YoY manufacturing picture, but the MoM picture. Nonetheless, the base usage of the survey hasn’t changed since inception."
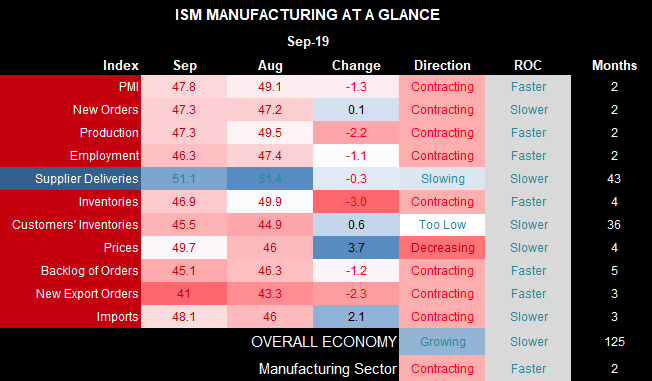
Not only have the headline PMI, new orders and production contracted at their fastest pace since the great recession, employment is its lowest since 2007 and exports fell off a cliff. While the spotlight is likely to remain on the plunge in export orders and the headline ISM index number, manufacturing as a percentage of GDP continues to be less and less significant with each passing year. Data from the world bank suggests that as of 2017, the U.S. Services sector accounted for over 77% of GDP. With that being said, we can better understand the divergence between the ISM Manufacturing Index and ISM Non-Manufacturing Index/Services."
Now all of that was what we saw from the ISM Manufacturing Index. The following showed a more healthy Markit PMI reading, rising for 2 consecutive months now.
The seasonally adjusted IHS Markit final U.S. Manufacturing Purchasing Managers’ Index hit 51.1 in September, the highest level in five months, rebounding from 50.3 in August. (Chart both Markit and ISM)
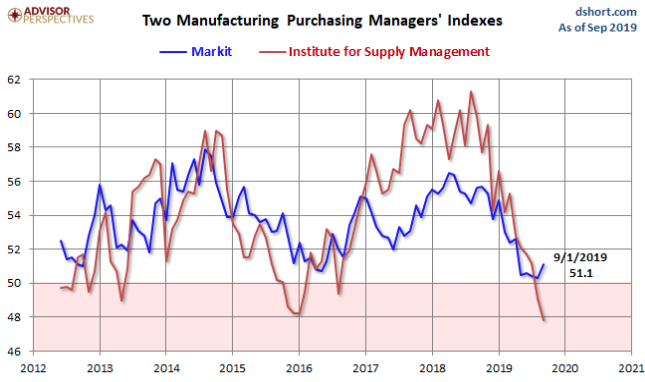
To reiterate, the Markit PMI improved to 51.1 in September (best since April) while the ISM fell to 47.8 (worst since recession). Notice that ISM ran much stronger in 2017-18 than Markit, overstating growth. The ISM might be understating it now. It’s important to understand, also, that the ISM is an equal weighted composite of its five components (new orders, production, deliveries, inventories and employment). Markit has about twice the sample sizeand overweights production and new orders, assigning a smaller weight to inventories and deliveries. As such, this may suggest that the Markit PMI gives greater insight into the manufacturing economy than does the ISM. Regardless, manufacturing as a whole is undoubtedly in a recession, but serves to emphasize that much greater importance will be placed on future economic data to be released this week, including the ISM Non-manufacturing index on Thursday."
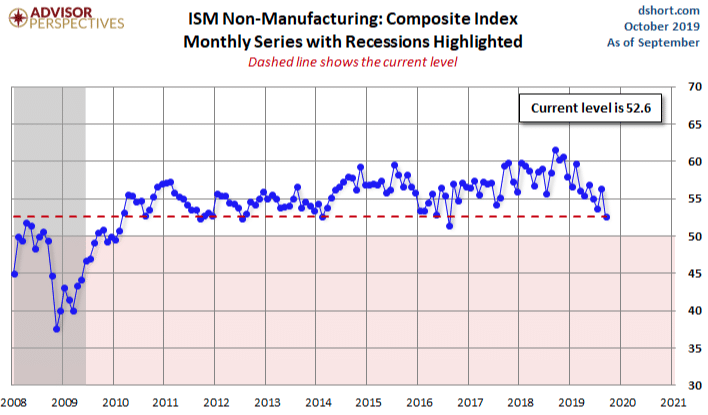
Fortunately, the ADP results did indeed prove to somewhat foreshadow the Nonfarm Payroll data. Unfortunately, the ISM Non-Manufacturing data briefly eliminated the focus of jobs in favor of the strength or weakness of the service sector data. The Institute of Supply Management released the September Non-Manufacturing Purchasing Managers' Index (PMI), also known as the ISM Services PMI. The headline Composite Index came in at 52.6% missing estimates of 55 percent. It was down 3.8 from 56.4% last month. The sharp miss immediately found investors selling equities and before technical support was reached, as noted previously in our All Things S&P 500 Related segment.
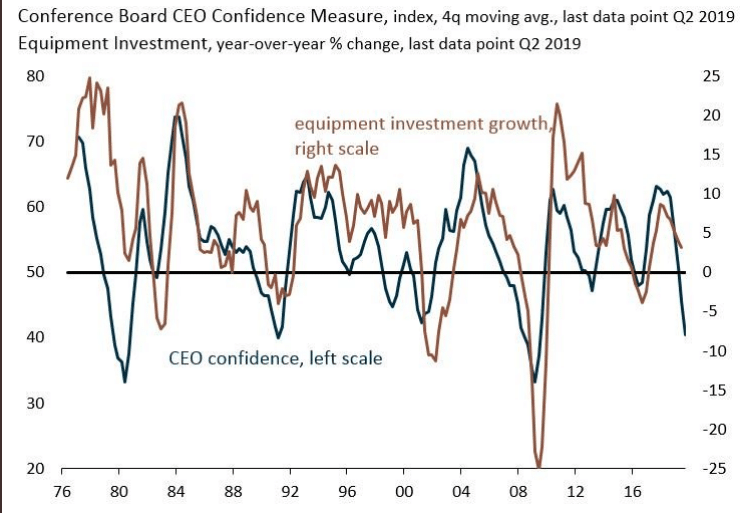
Houston, we have a problem... and the problem is simply the trade war has carried on far too long and is showing signs of seeping into the service sector of the economy. The on-again-off-again trade truce followed by escalating tariffs has served to dramatically impact business sentiment, investment and capital expenditures throughout 2019.
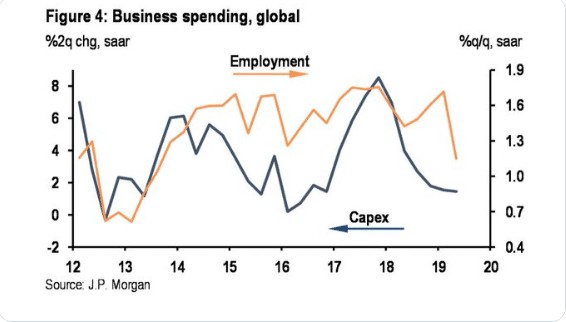
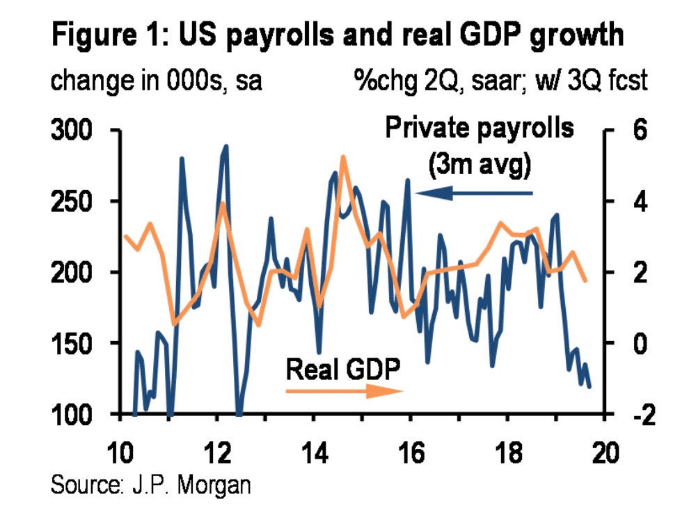
"JPMORGAN: “Global capex growth has slowed substantially from a six-year high in 2017 to a near-stall .. It likely also is a contributing factor in the more recent pullback in job growth.”
More recently, the CEO Confidence survey has plummeted. This was to be expected based on what we've seen in CAPEX spending.
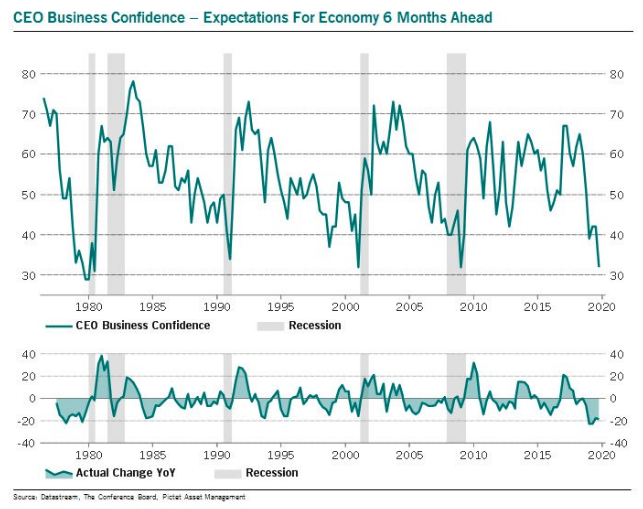
Folks, if you desire to see a snapshot of one of the best self-fulfilling prophecies out there, it's this survey. This is the lowest reading since Q4 ’08 & YoY lowest since Q2 of 1979. CEO confidence has never been this low outside of U.S. recession. In this sense it's quite unique, obviously this time is truly different since the other times we were already in a recession. Moreover, referring back to our initial statement, we don't desire for this survey to become self-fulfilling and drive business investment lower, ultimately finding the hard economic data declining. This is the chart you should be paying attention to presently, as these are the business and spending decision-makers.
Is it safe to say that while the soft data represented has weakened, but the consumer is still strong? Yes, that is safe to say; but recall the divergence in the ISM data, which is now finding the service sector data catching down to the manufacturing sector data. The August ISM Manufacturing and Non-Manufacturing data saw it's largest divergence since Oct 2015, where both prints declined in following months.
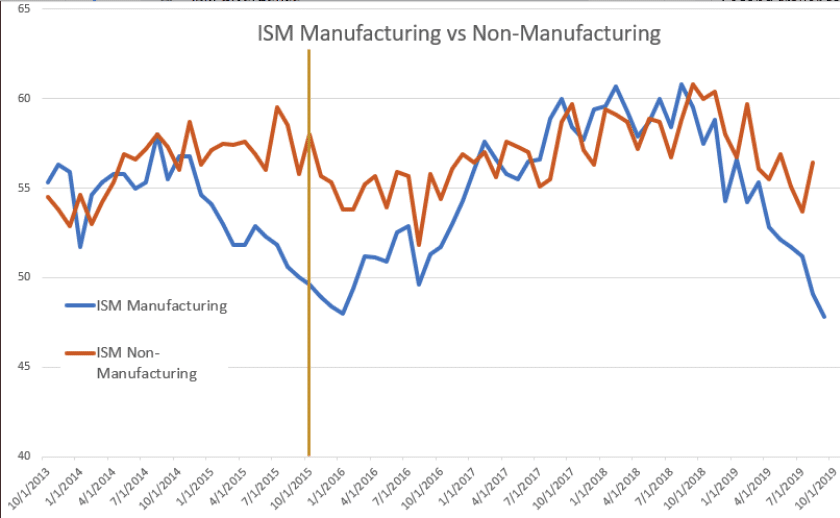
Since that divergence developed, we see both ISM indexes falling, with the Non-manufacturing Index catching down to the Manufacturing index. Simply put, we don't desire to see the same thing happen to consumer sentiment and retail sales. So yes, the consumer is still strong and has a tremendous balance sheet supporting them, but if CEO confidence continues to bleed, it continues to creep into the service sector, flow through the labor markets... well, it can wind up hitting the consumer. And that divergence between the ISM indexes noted above is akin to the one we see between consumer confidence and business confidence presently developing.
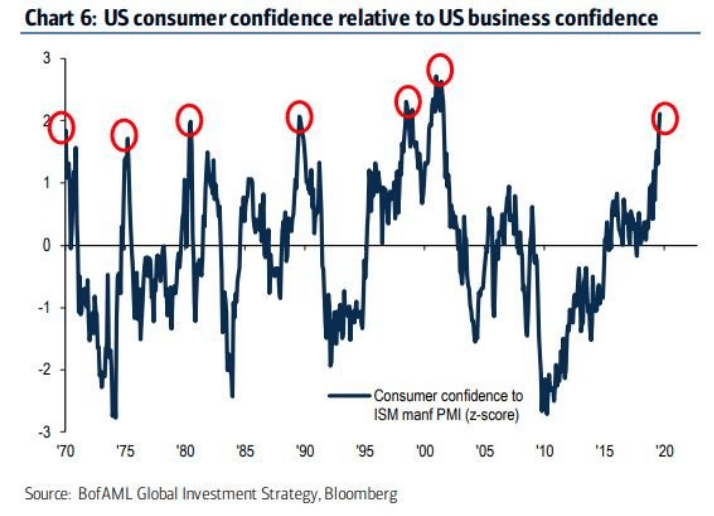
Consumer confidence continues to pace well ahead of business optimism, the highest divergence since the start of the century. Houston, these are problems akin to gaps in the technical purview of the S&P 500. And we all know what happens to gaps in the S&P 500; they eventually get filled, as they did this past week. So again, the trade talks this week are all-too-important both in terms of the economy and the market.
Fortunately, to close out the week, the BLS Nonfarm Payroll came in nearly as anticipated by economists.
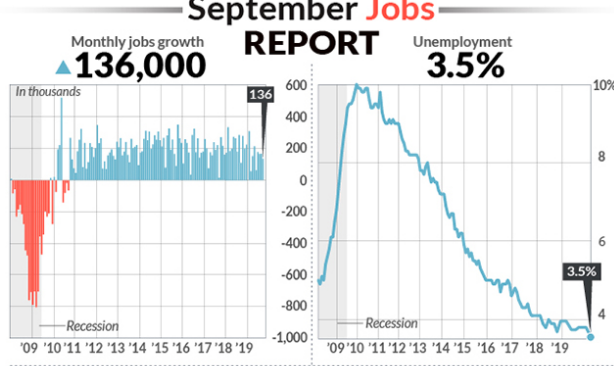
At growth of 136,000 jobs in September, this was the slowest pace of job growth in four months, as businesses grew more cautious about hiring, but employment gains for August and July revised up by a combined 45,000. While the monthly job gain slowed, with the Q3 revisions it brought the monthly average above that of the Q2 period. Non-farm payroll average: * Q1: 174k * Q2: 152k * Q3: 157k * Year-to-date: 161k vs. 2018: 233k.
And in a separate survey, the U.S. unemployment rate dropped to 3.5%, the lowest rate since December 1969. One dark spot in the report was that the increase in worker pay over the past 12 months fell to 2.9% from 3.2 percent. Average hourly earnings were little changed in September following an 11-cent gain in August. The reality is that this is still strong average hourly earnings growth folks. (Chart from LPL Financial)
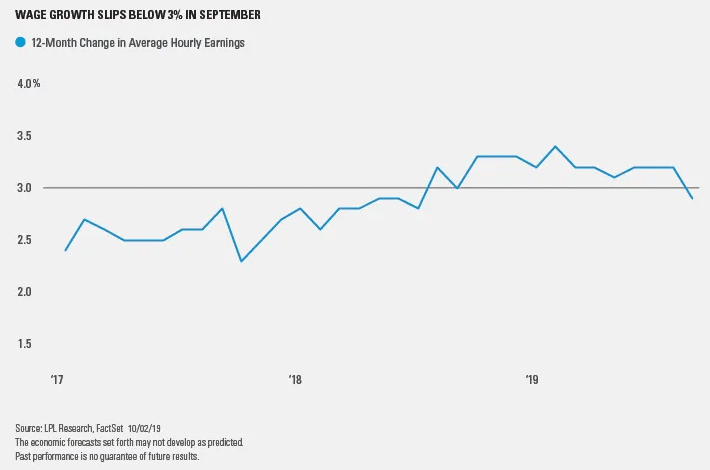
While everyone was fretting over Average Hourly Earnings, *blue collar* wages rose at a 2% annualized rate. This measure is now running at its largest relative gain by blue collar workers since 2010, but this time with much higher employment rates.
Overall, the September jobs report showed hiring has been steady, defying recent worries of economic weakness after surprisingly weak manufacturing and services surveys were released earlier this week. Other labor-market measures also look healthy. The unemployment rate fell to 3.5% in September, a new cycle low, and initial jobless claims are still subdued.
Wage growth slowed notably last month, though, hinting that inflationary pressures could be moderating. At any rate, 2.9% wage growth is still enough to buoy personal incomes and consumer spending while keeping interest rates relatively low.
“Even though hiring has slowed slightly this year, it still looks healthy for the 10th year of this economic expansion,” said LPL Financial Chief Investment Strategist John Lynch. “Wages are growing near a 3% clip, and we still see evidence that domestic inflation is subdued enough to support an accommodative Federal Reserve.”
When it was all said and done for the economic data, the GDP revisions came flying in like clockwork and all pointed to Q3 GDP right around 2 percent.
- From Merrill Lynch: These data edged down 3Q GDP tracking by a tenth to 1.7% qoq saar. [Oct 3 estimate] emphasis added
- From Goldman Sachs: We also lowered our Q3 GDP tracking estimate by one-tenth to +1.9% (qoq ar). [Oct 3 estimate
- From the NY Fed Nowcasting Report stands at 2.0% for 2019:Q3 and 1.3% for 2019:Q4. [Oct 4 estimate].
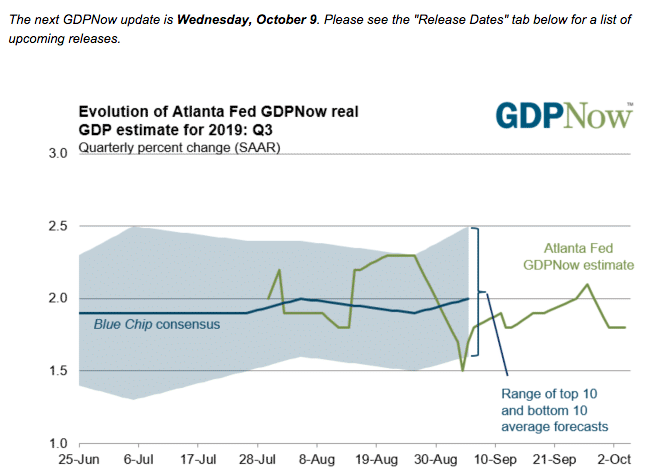
- From Atlanta Fed: GDPNow model estimate for real GDP growth (seasonally adjusted annual rate) in the third quarter of 2019 is 1.8 percent on October 4, unchanged from October 1. [Oct 4 estimate]
The next update from the Atlanta Fed will come on October 9th, the day before trade talks kick-off.
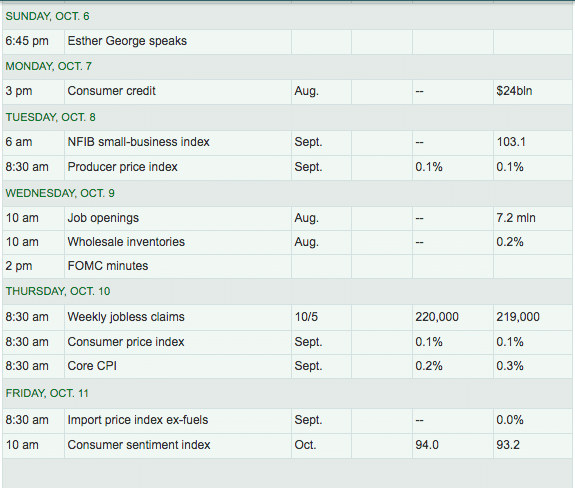
The good news for the coming week, which will be centered on trade talks, is that the economic data calendar is quite light and mostly focused on inflation data, business sentiment and consumer sentiment. None of the data shy of the weekly jobless claims and consumer sentiment have trending focus and/or concern.
Fund Flows Ain't Getting Better
It's a good thing we haven't held our breadth with respect to fund flows. According to Lipper Weekly FundFlow data, ETFs (-$123 million) had overall net outflows for the second straight week driven by equity ETFs, which had net-negative flows of $822 million. The net outflows for the equity ETF asset group were driven by iShares Russell 2000 ETF (IWM, -$1.5 billion) and the Energy Select Sector SPDR ETF (XLE, -$510 million). Conversely, taxable bond ETFs took in $721 million in net new money. The most significant net inflows among taxable bond ETFs were attributable to iShares 3-7 Year Treasury Bond ETF (IEI, +$457 million) and iShares Intermediate-Term Corporate Bond ETF (IGIB, +$370 million).
Equity mutual funds (-$7.0 billion) had net outflows for the thirty-third straight week. Both domestic equity funds (-$5.4 billion) and nondomestic equity funds (-$1.6 billion) contributed to this week’s net outflows. The largest net negative flows in the two regions belonged to Large-Cap Core Funds (-$902 million) and International Multi-Cap Core Funds (-$523 million).
Municipal debt funds (+$905 million) extended their streak of weekly net inflows to 39, while taxable bond funds (-$80 million) had net outflows for the second consecutive week. The national muni debt peer groups paced the net inflows as General Muni Debt Funds (+$283 million), Intermediate Muni Debt Funds (+$220 million), and High Yield Muni Debt Funds (+$213 million) all took in significant amounts of net new money. On the taxable side of the ledger, the Ultra-Short Obligation Funds peer group suffered its second-worst weekly net outflow (-$925 million) in its history (Lipper started tracking this data in 1992), trailing only the $1.1 billion net negative flow for the fund-flows week ended August 22, 2007. The lion’s share of this week’s net outflows is concentrated in two funds, Morgan Stanley Ultra-Short Income Portfolio (-$862 million) and the Virtus Seix U.S. Government Securities Ultra-Short Bond Fund (-$331 million).
Money market funds took in $7.4 billion in net new money for the week. The net inflows were driven by the U.S. Government Money Market Funds (+$7.3 billion) and Institutional U.S. Treasury Money Market Funds (+$3.5 billion), while the Institutional U.S. Government Money Market Funds and Institutional Money Market Funds peer groups saw $3.5 billion and $3.1 billion leave their coffers, respectively.
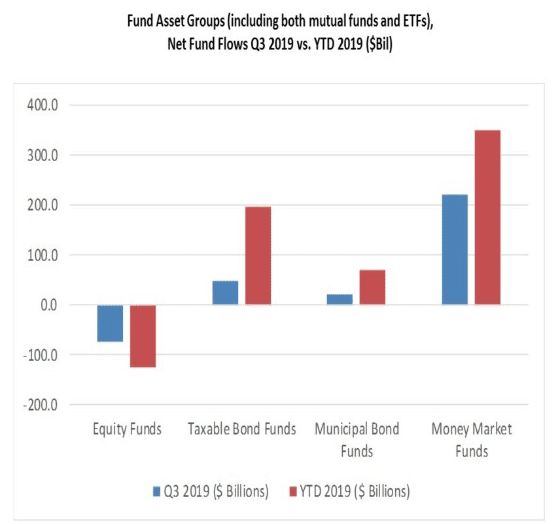
The quarterly (as well as the year to date) fund flow results for equity funds show a tale of two cities. Equity mutual funds have been responsible for all of the net outflows during both Q3 (-$84.9 billion) and the first three quarters of the year (-$157.2 billion), while equity ETFs have taken in net new money for both time periods (+$12.1 billion in Q3 and +$31.5 billion for the year to date). The hardest-hit peer groups among the equity mutual funds for Q3 were Large-Cap Growth Funds (-$16.0 billion) and Large-Cap Value Funds (-$8.6 billion). For equity ETFs, the Multi-Cap Core Funds peer group took in $12.0 billion in net new money during the quarter.
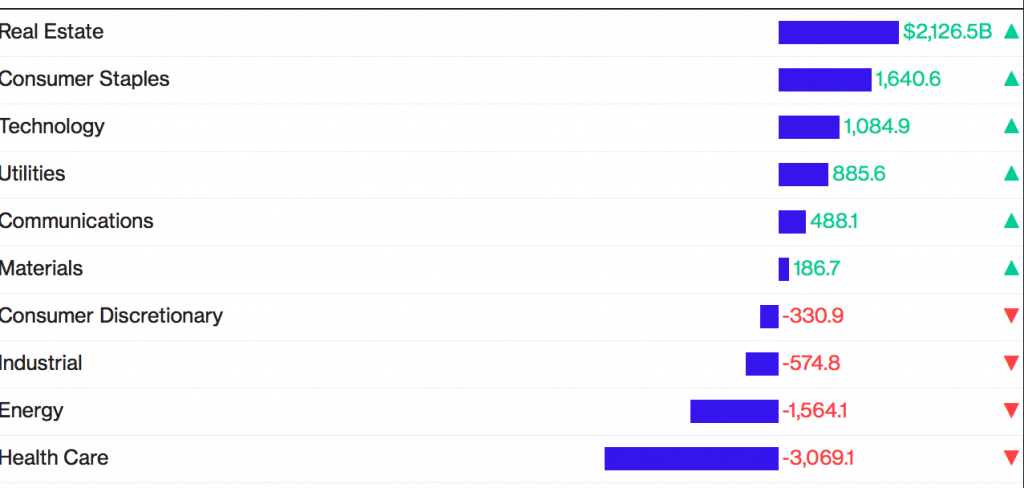
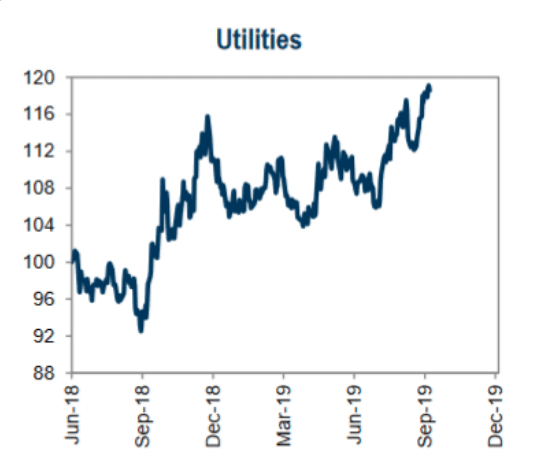
And when it comes to where the funds are flowing, the ETFs that are outperforming are all the defensive sectors, REITs, Utilities, Consumer staples, etc. Defensive sectors are vastly outperforming cycles in 2019.
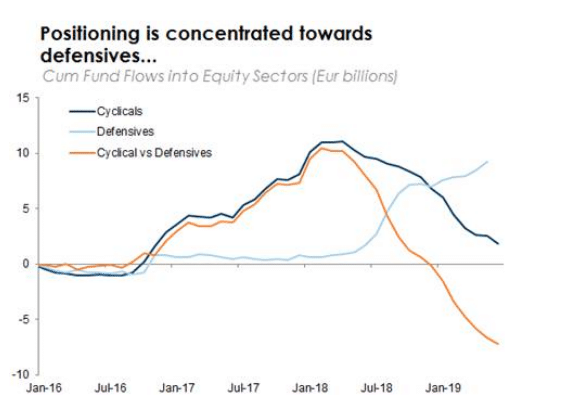
As the S&P 500 began October with its third week of losses, Utilities ETFs took in $726 million, the most of any industry. Investors had already piled into defensive funds in the three months ended September, with ETFs of real-estate and consumer-staples companies adding more than any other equity sectors. Defensive sectors dominated third quarter ETF flows. (Chart from Bloomberg Data)
The defensive trade is one of the most concentrated and overcrowded trades out there presently. And why not? Look at global PMIs and more recently U.S. PMI data. Look at bond yields around the world, and again those U.S. Treasury yields. Nonetheless, this has pushed defensive sector ETFs to astounding valuations. Trade deal cometh and those valuations might goeth rather quickly.
Utilities stocks, which ended September trading near 22 times earnings is basically an all-time high.
Real-estate companies are now at their priciest levels in at least 3 years, and valuations for consumer-staples stocks are scaling heights not seen since February 2018, when the short-VOL trade hit a "snag" of sorts. So if you think piling into the defensive sectors at these levels is the optimal place to allocate capital, think in terms of what's overcrowded and how the story usually ends.
“Valuations give you some pause,” said Matthew Bartolini, head of Americas research for State Street Corp.’s ETF business, adding that low rates, not fundamentals, have helped feed the beast. “If it were about valuation, you wouldn’t be allocating to real estate, utilities or consumer staples.”
Earnings Outlook
Earnings season, the main kick-off with the financial sector reports, can't get here quickly enough. The markets have lacked a true catalyst for which to drive a breakout above the former highs without definitive signals from the mass reporting season. On the 11th, the financials will begin reporting for Q3 2019 results. With this in mind, low rates have been an impediment to the big banks. And by the way, rates are seemingly heading lower.
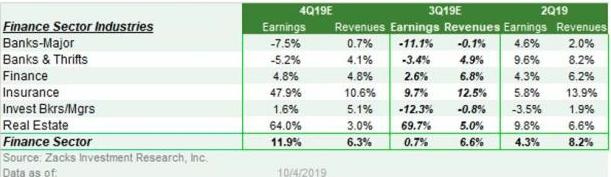
It is important to keep this distinction in mind as we start thinking about bank earnings, which kick-off with Citigroup's (C) report on Friday, October 11; J.P.Morgan (JPM) and Wells Fargo (WFC) follow with their reports on Tuesday, October 15th. In addition to JPM reporting on Friday, it's a very light reporting week as shown in the graphic below. This is the last week the graphic will look like this folks.

Total Q3 earnings for the Zacks Major Banks industry that includes J.P. Morgan, Wells Fargo, and other major industry players are expected to be down -11.1% from the same period last year on -0.1% lower revenues.
Now let's take a look at the latest Q3 EPS forecast from FactSet. For Q3 2019, the estimated earnings decline for the S&P 500 is -4.1 percent. This is a bigger decline from the -3.7% forecast a week ago. If -4.1% is the actual decline for the quarter, it will mark the first time the index has reported three straight quarters of YoY earnings declines since Q4 2015 through Q2 2016. (Non-GAAP)
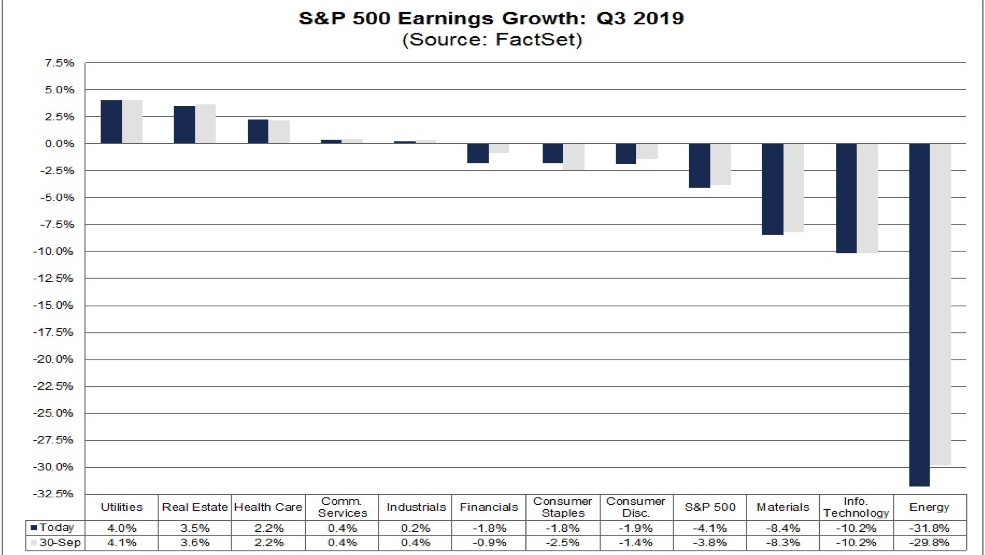
Revenues are expected to have grown a scant 2.8% in the 3rd quarter. Analysts see low, single-digit earnings growth in the fourth quarter followed by high single-digit earnings growth for both Q1 2020 and Q2 2020. The forward 12-month P/E ratio is 16.5. This P/E ratio is below the 5-year average of 16.6 but above the 10-year average of 14.8. It is also below the forward 12-month P/E ratio of 16.8 recorded at the end of the third quarter (September 30).
Looking forward, FactSet projections are as follows:
- For Q4 2019, analysts are projecting earnings growth of 2.6% and revenue growth of 3.6%.
- For CY 2019, analysts are projecting earnings growth of 1.2% and revenue growth of 4.1%.
- For Q1 2020, analysts are projecting earnings growth of 7.6% and revenue growth of 5.5%.
- For Q2 2020, analysts are projecting earnings growth of 8.7% and revenue growth of 6.3%.
- For CY 2020, analysts are projecting earnings growth of 10.5% and revenue growth of 5.7%.
The EPS forecast for 2020 have already come down nicely and show mid-single-digit EPS growth as opposed to the former 10-12% EPS growth. The bar is being set low in 2019 and moving lower for 2020, which is a positive setup for stocks going forward and assuming trade talks go well. Now let's take a look at the Q3 EPS forecast from Refinitiv.
Aggregate Estimates and Revisions
- Third-quarter earnings are expected to decrease -2.7% from 18Q3. Excluding the energy sector, the earnings growth estimate is -0.8%.
- Of the 21 companies in the S&P 500 that have reported earnings to date for 19Q3, 90.5% have reported earnings above analyst expectations. This compares to a long-term average of 65% and prior four-quarter average of 74%.
- 19Q3 revenue is expected to increase 3.6% from 18Q3. Excluding the energy sector, the growth estimate is 4.6%.
- 57.1% of companies have reported 19Q3 revenue above analyst expectations. This compares to a long-term average of 60% and an average over the past four quarters of 59%.
Investor Takeaways
Sometimes the truth is a difficult concept to accept, especially since investing isn't always about truth. Investing has a component of truth but is largely about future expectations for earnings. We expect earnings to grow and therefore we are willing to pay a forward-looking multiple for said earnings. What happened late last week in the S&P 500 had little to do with forward-looking earnings and more to do with the hopes of additional central bank support. Finom Group refers to this as the market dictating what it wants, speaking directly to the Federal Open Market Committee. This is not the ideal reason for market movement. Hope is not an investment thesis.
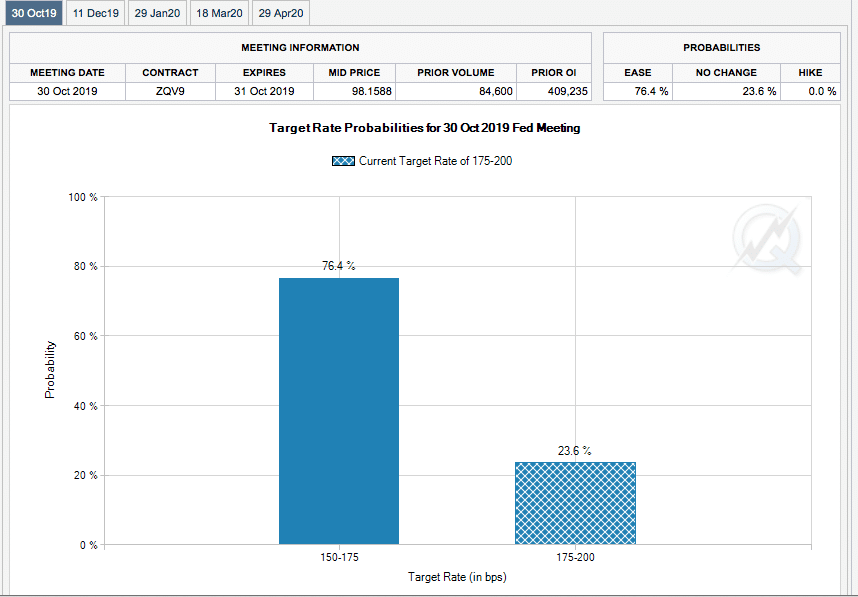
Boston Fed President Eric Rosengren did not vote in favor of the last rate cut, but his tune has changed after the latest set of ISM data. Rosengren said he was open-minded about what he would advocate at the meeting. He said he would be focusing on data surrounding consumers. Strong auto sales in September seemed to belie concerns about the consumer, he noted. Rosengren was not mistaken in this regard; auto sales were definitely improving. The BEA released their estimate of September vehicle sales last week. The BEA estimated sales of 17.19 million SAAR in September 2019 (Seasonally Adjusted Annual Rate), up 1.1% from the August sales rate, and down 0.7% from September 2019. Sales in 2019 are averaging 16.96 million (average of seasonally adjusted rate), down 1.1% compared to the same period in 2018.
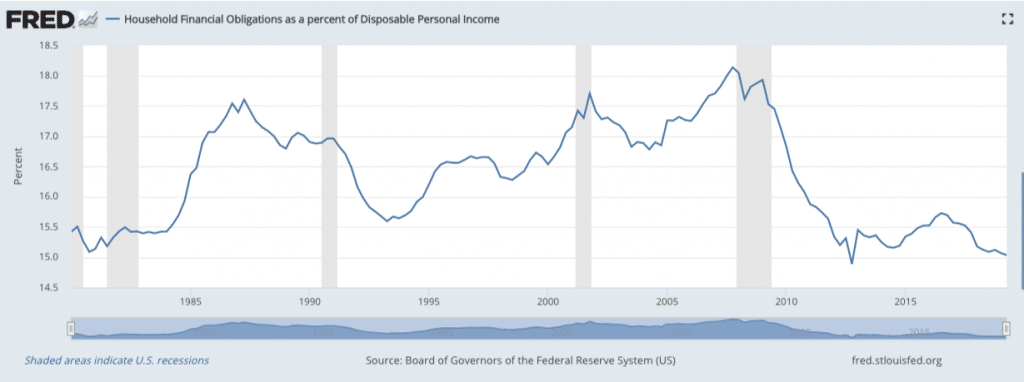
As I've noted previously, the consumer is in pretty strong shape when we review household balance sheets, disposable income levels. In fact, we haven't seen this kind of consumer balance sheet since the 1970s; it's quite remarkable, but also fitting with rising wages, low inflation and a more cost-conscious consumer.
Regardless of this truth about the consumer, which makes up the service sector GDP activity (77% of economic activity), J.P. Morgan's economic team is more deeply concerned about spillover affects from the trade war that have already contracted the manufacturing sector.
“We believe the global economy has entered a second and more dangerous phase of slowing. .. Against this backdrop, we believe the emergence of more tangible signs that U.S. growth has slowed will encourage the Fed to ease again at the end of this month.”
I have to agree with the J.P. Morgan team of analysts in this regard. Some of the soft data has more prominently begun to negatively affect the hard data. It hasn't yet set off alarms, but the weakening is undeniable. Nonetheless, much of the weakness, be it in the soft or hard data, is manmade and can easily be remedied through public policy, the deescalation of the trade war.
"Presidential elections usually depend on the economy and war. A leader who avoids a shooting war and presides over a strong economy has a strong chance of reelection. President Trump could fix the economic problems with a few strokes of his pen. Blaming economic problems on the Fed or the impeachment process may play well to his base, but has nothing to do with actual recession odds. I am sure that he is hearing this from advisors, but disagreement with the President seems to be a career-shortening move."
That which ails the economy is easily fixable. It's for this known reason, that the market has been so topsy turvy for months now. Many are of the opinion, this week will mark the deescalation period of the 14-month long trade war. Here is what David Moening had to offer about his expectations on the trade negotiations this week:
"My key assumptions here are as follows:"
- The U.S. Consumer doesn't panic - This keeps the U.S. economy moving ahead (albeit at a slower pace) and we avoid recession.
- Washington remains deeply divided and votes along party lines. This means the chances of the President being removed from office for the first time in history are low.
- BREXIT happens (or not) - and is a non-event for markets.
- Central Bankers continue to ease rates around the world.
- A trade deal is likely to get done, and sooner rather than later. This could easily turn economic sentiment on a dime.
- So, as long as Mom & Pop don't pull in the spending reins, my view is the economy and, in turn, corporate profits, can keep on keepin' on.
And here is what Lance Roberts of Real Investment Advice and Clarion Capital had to say about his firm's expectations for trade negotiations this coming week:
"We do expect there to be a“trade deal” of some sort next week, which should boost stocks in the short-term (through the end of the year). If such a deal is announced we will add to our sector and market index holdings accordingly."
As investors auger in the October and Q4 2019 period (including earnings season), nervousness is abound and quite prominent. Investor sentiment is, well, abysmal.
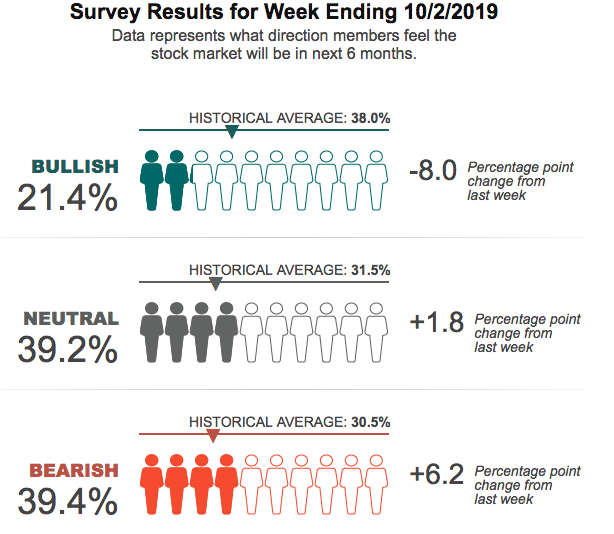
Bearish sentiment has increased above the historic average and bullish sentiment is in the basement, according to the latest AAII survey. And why not? October has kicked-off in much the same way as did October 2018. Those memories are still fresh for investors, weighing heavily on sentiment and pervading equity exposure and positioning. While investors are fearful for another October swoon and Q4 doom, there remain distinguishable differences.
The main distinguishable difference is with central banks, namely the Fed. The FOMC is now in easing mode and not raising rates but cutting rates in 2019. Beyond the FOMC rate cuts, the lower rates have spurred new home sales to cyclical highs, a sharp contrast to the trajectory of home sales in 2018.
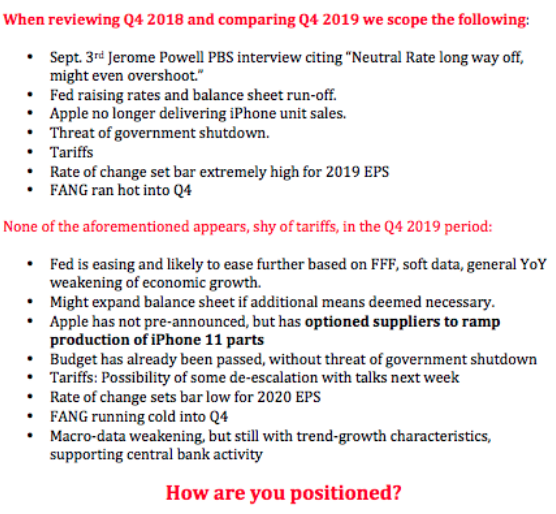
The consumer remains strong and while they seemed to pull back on the purse strings in the Q4 period last year due to the threat of a government shutdown, such a situation has been avoided with the government passing a budget already and raising the debt limit ceiling. One less thing to worry about.
Additionally, last Q4, investors were shocked by an announcement from Apple Inc. (AAPL) that it would stop issuing iPhone unit sales. The stock plummeted, taking down the tech sector with it. Back then, it had become clear that upgrade cycles were becoming elongated and tough comps would weigh on the coming quarterly results. With the largest market cap in the S&P 500, the index followed shares of AAPL lower and helped to stimulate additional losses from the November 2018 period thereafter.

The situation for Apple seems very different heading into the 4th quarter of 2019. In fact, the firm has been reported to ask suppliers to increase production of its latest iPhone 11 product line.
- Apple has told suppliers to boost production of the iPhone 11 series by up to 10% amid unexpectedly higher demand, Nikkei reports.
- That means an increase of some 8M units, a number equivalent to Google's total annual phone shipments.
- It suggests a more budget-minded focus is paying off, Nikkei says, with a shrinking global smartphone market and economic uncertainty.
- The surge in iPhone orders is concentrated in the cheapest iPhone 11 model, Nikkei says, while Apple has slightly revised down orders for the top-of-the-line iPhone 11 Pro Max (starting at $1,099).
Wedbush on AAPL: "We continue to believe China as a region is currently one of the main catalysts of demand for the iPhone 11 and is tracking roughly 20% ahead of plan.
CITI on AAPL: "We believe lowered expectations augur well for share price appreciation in the coming months." Suva expects Apple's Services offerings to lift investor spirits while tariffs/trade issues weigh on iPhone unit sales. The analyst says AAPL's valuation is reasonable given the shift to the higher-margin Services and the expected return to revenue growth next year.
Finally, here is another way to review the Q4 headwinds that I created for comparing 2018 vs. Q4 2019, in a tweet:
It's easy to find bearish sentiment, bearish analogues, and correlations when the market is reeling, faltering or otherwise in full retreat. The latest PMI/ISM data has produced a great deal of bearish analogues that have been widely distributed in the many media venues. However, the latest YouTube video analysis concerning PMI/ISM vs. S&P 500 performance from Ciovacco Capital aimed to level set the narrative on the subject.
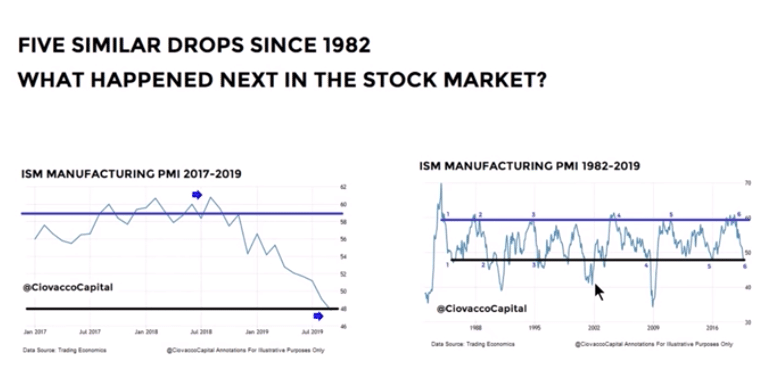
The charts above identify that the current weakness in ISM Manufacturing mirror that which have happened in the past, but produced rather notable S&P 500 gains going out 5 years.
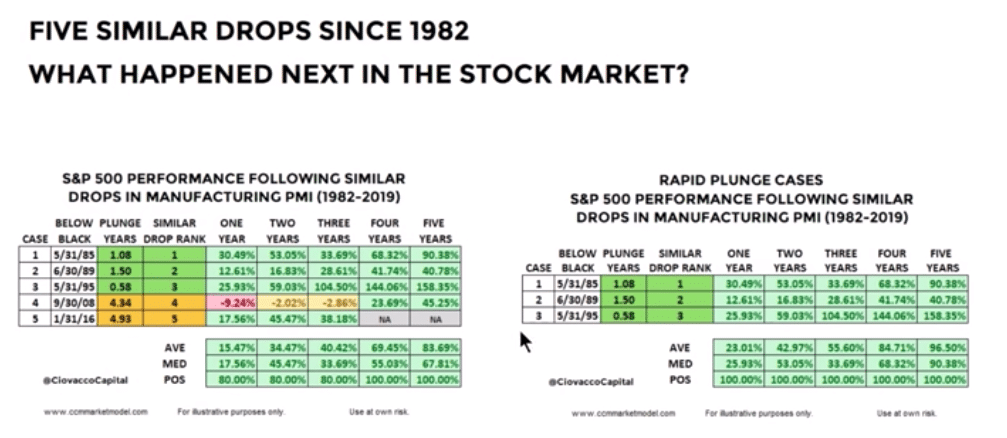
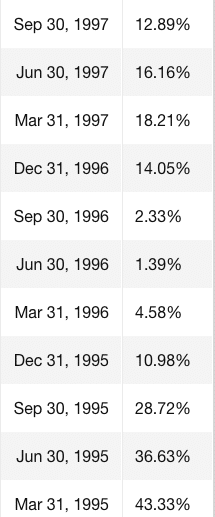
As shown in the table below that dates back to 1982 and outlines the last 5 times the ISM Manufacturing Index fell into contraction territory, the market did very well a year later. On average, the market was higher by more than 15% a year later. Focusing in more closely on the last 3 occasions in which the ISM Manufacturing Index fell into contraction territory, the gains were even greater, more than 20% a year later. HOWEVER...
**Bullish or bearish analogues are not always complete and that is what Finom Group and I aim to suggest in our analysis of the Ciovacco Capital video assertions and analysis. While the analysis does a good deal of comparing many variables, including trade conflict...
... the video does not point out what drives markets over such a time period being outlined, earnings. Earnings are the "mother's milk" of financial markets. They determine the long-term movement of equities. Every other aspect of economic data can be somewhat manipulated by economic policy and/or central bank activity.**
When we review the now 20-month sideways action in the market, we can make a direct correlation to the earnings production over that period, even with strong economic growth that is now downshifting. (Chart of returns J.C. Parets)
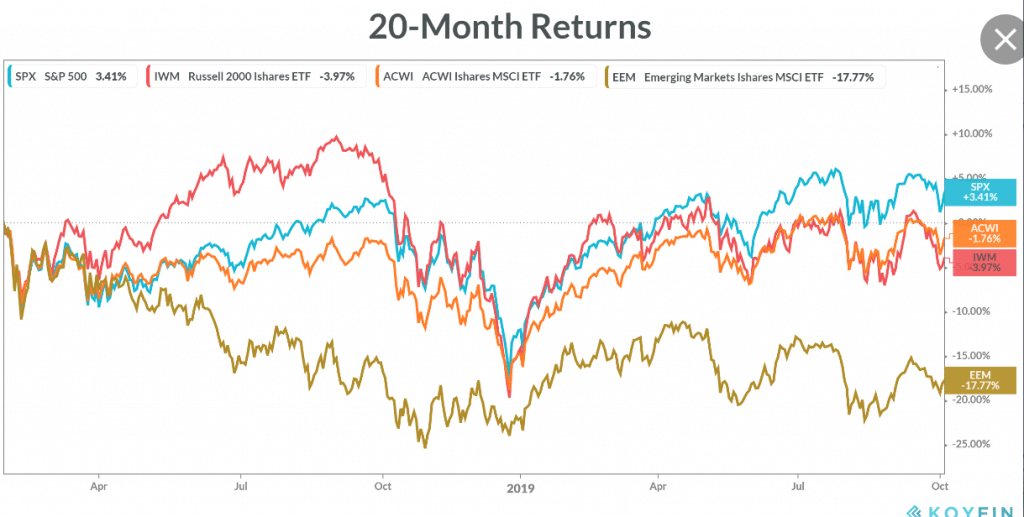
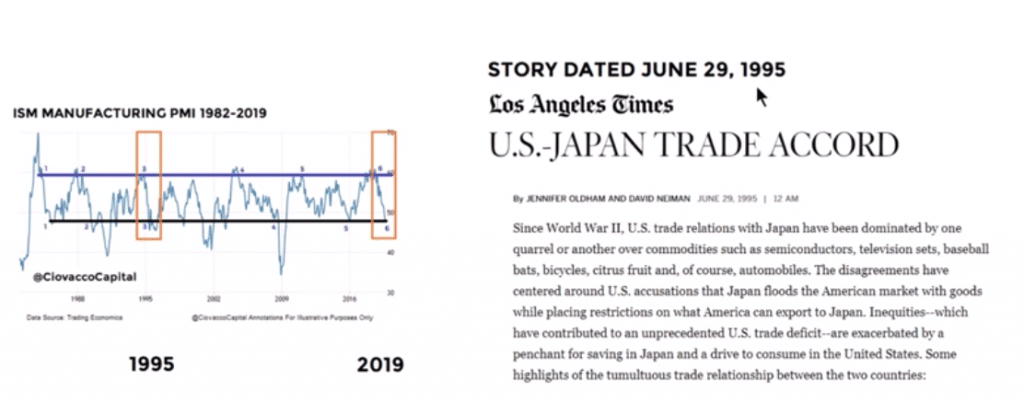
Earnings are essentially projected to be flat for 2019, hence the sideways action. When we look back at the highlighted 1995 analogue for ISM Manufacturing contraction and the 1994-1995 trade tariffs with Japan that ended with an accord, this is not what drove markets folks. What drove markets was robust EPS growth. The following chart identifies multi-year, quarterly S&P 500 EPS growth.
We can create an analogue for most every metric and bias we desire to create, but if not for earnings... well, you get the picture. Trade cautiously, but if indeed we do get that all-important trade deescalation headline, be prepared to take-on risk.


