
The Economies Adding The Most To Global Growth In 2019

Global economics is effectively a numbers game.
As long as the data adds up to economic expansion on a worldwide level, it’s easy to keep the status quo rolling. Companies can shift resources to the growing segments, and investors can put capital where it can go to work.
At the end of the day, growth cures everything – it’s only when it dries up that things get hairy.
Breaking Down Global Growth in 2019
Today’s chart uses data from Standard Chartered and the IMF to break down where economic growth is happening in 2019 using purchasing power parity (PPP) terms. Further, it also compares the share of the global GDP pie taken by key countries and regions over time.
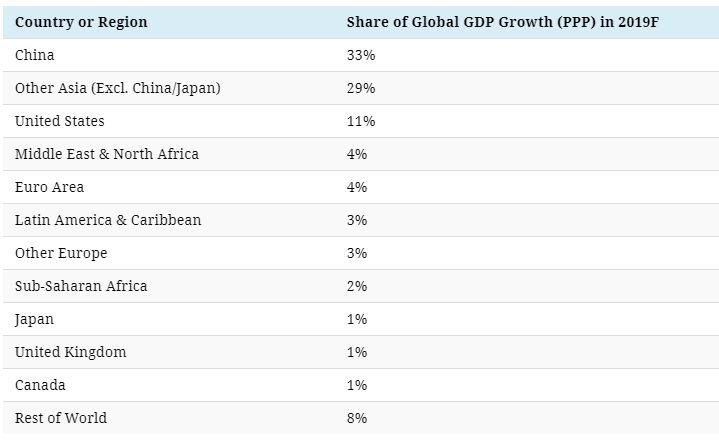
Let’s start by looking at where global growth is forecasted to occur in 2019:
(Click on image to enlarge)
The data here mimics some of the previous estimates we’ve seen from Standard Chartered, such as this chart which projects the largest economies in 2030.
Asia as a whole will account for 63% of all global GDP growth (PPP) this year, with the lion’s share going to China. Countries like India and Indonesia will contribute to the “Other Asia” share, and Japan will only contribute 1% to the global growth total.
In terms of developed economies, the U.S. will lead the pack (11%) in contributing to global growth. Europe will add 8% between its various sub-regions, and Canada will add 1%.
Share of Global Economy Over Time
Based on the above projections, we were interested in taking a look at how each region or country’s share of global GDP (PPP) has changed over recent decades.
This time, we used IMF projections from its data mapper tool to loosely approximate the regions above, though there are some minor differences in how the data is organized.
(Click on image to enlarge)
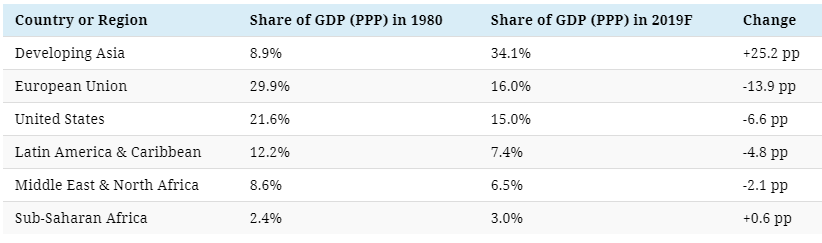
In the past 40 years or so, Developing Asia has increased its share of the global economy (in PPP terms) from 8.9% to an estimated 34.1% today. This dominant region includes China, India, and other fast-growing economies.
The European Union and the United States combined for 51.5% of global productivity in 1980, but they now account for 31% of the total economic mix. Similarly, Latin America and MENA regions are seeing similar decreases in their share of the economic pie.
Disclosure: None


