
The Ebbs And Flows Of Markets Can Prove To Discombobulate Investors: Stay True To The Course
As we approach Election Day, the market waters are getting choppy. Just over 2 weeks ago, the S&P 500 (SPX) dropped below its 50-DMA, threatening to breach 3,200 to the downside. This past week, the benchmark index broke back above 3,500 before stalling out and finishing the week below 3,500, up only 6 points for the week. Due to the rapidity of market moves, many may have overlooked a nearly 4% intra-week correction.
The markets' message this week may be one that suggests keeping one's eyes on the horizon and actively steering the sails toward the 2021 destination. For the time being the waves and currents of the market may produce more sideways action than a clear path forward.
Investors did seek safety this past week, after a strong Monday market performance on the whole. While a rising tide lifted all sectors/boats on Monday, that gave way quickly and found a 3-day sell-off.
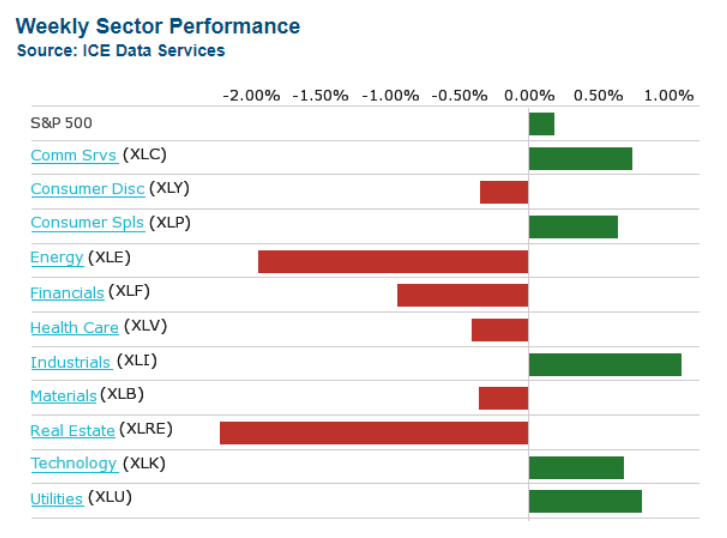
Where the greatest free cash flow and growth potential could be found going forward, that is where investors huddled. Information Technology (XLK), Communication Services (XLC), Consumer Discretionary (XLY), and Industrials (XLI) led the scant uptick in the market this past week. It would be difficult to suggest that Industrials were a safety sector in the past, but the rise of e-commerce and other tech-related consumer-facing demands have filtered down to a couple of key sub-categories of Industrials, namely the Transports and Materials! The resurgence of manufacturing and accelerated trends for e-commerce have proven a boon for these 2 sub-categories within the Industrials sector. I would not be of the viewpoint that this sector of the market gives way in the near-term.
I encourage investors to remain focused on a few key considerations as the Q4 2020 period is met with uncertainty. Those key considerations are as follows:
- The uncertainty will give way to greater certainty as event risks are realized for an outcome near-term.
- Election risks remain but may prove overblown as polling is identifying a sizable decision from votes already cast.
- Contested elections don't equate to never realizing an outcome.
- Covid-19 infection rate rising is expected, but mortality rates have improved due to better medicines, therapeutics, and planning.
- Covid-19 vaccine approval is likely to come soon after the November election
- Economic growth scares are a constant part of the market calculus, but the economy and the market are not operating at the same time timeframe.
Choppy Waters For Markets Expected
Ever since the March-May economic lockdown produced the greatest market correction since 2008, investors, strategists, analysts, and economists have all been forced to adjust there understandings of market functionality. It has become abundantly clear that so long as central banks provide credit market liquidity, they are essentially providing wind to the sails of the equity markets as well.
The various funding programs instituted by the central banks across the globe essentially aid in boosting money supply. When money supply, in the case of the Federal Reserve USD funding increases, so does the amount of investable dollars and lending dollars. The global economy consequentially rebounds and equity markets benefit from a rise in corporate earnings, while Treasury yields fall. In the chart below, we can see the long-term and present-day affects of the global money supply on the S&P 500.
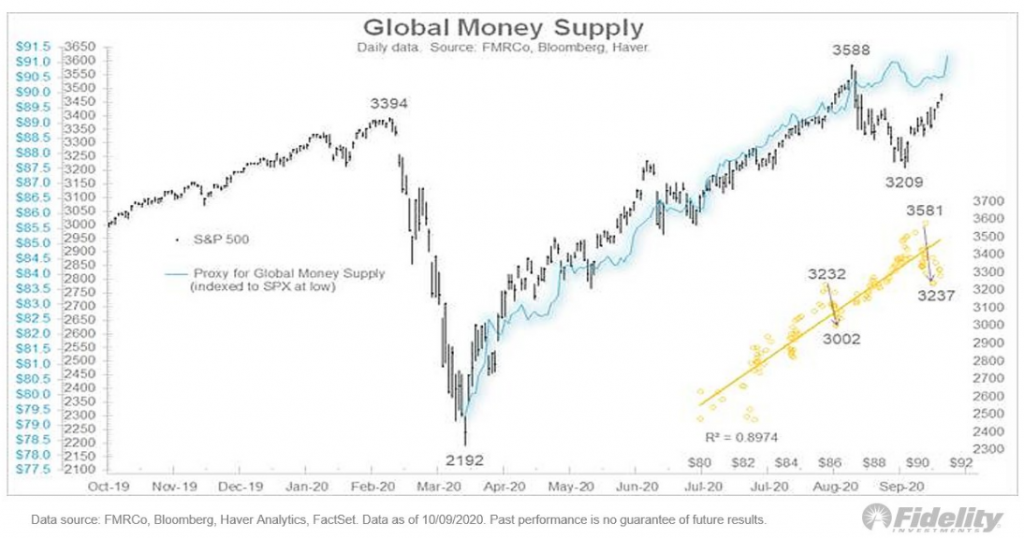
Bloomberg’s proxy for the global money supply is making new highs again, which suggests that the market may not be too far behind. Regardless of where the market leans in the coming week, I wouldn't suggest steering your portfolio against the tailwind of global money supply.
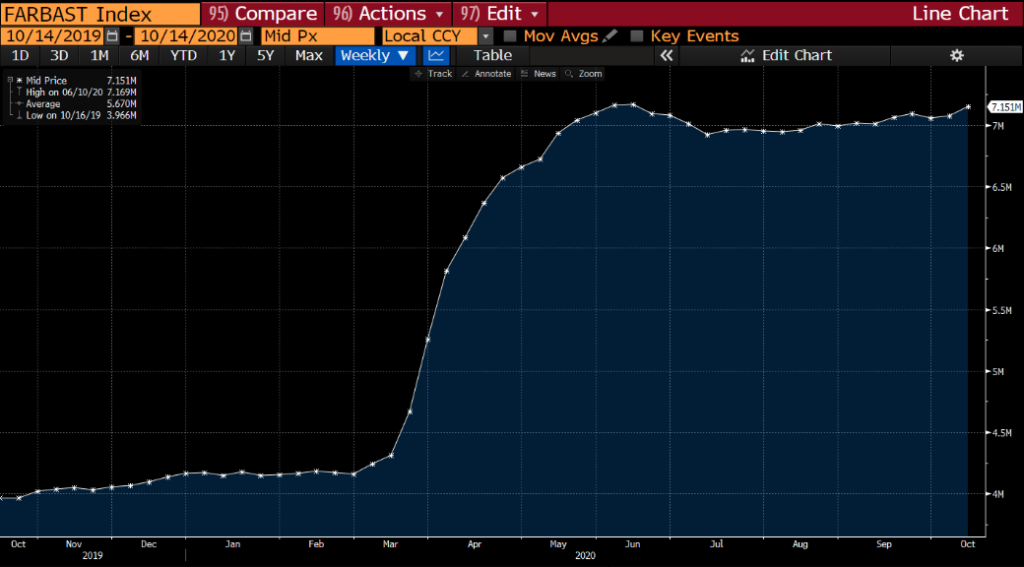
Just this past month, the Fed has started to build up its balance sheet again, boosting it by $76.8 billion in the past week alone, the biggest increase since May. Its assets now total $7.15 trillion.
This past trading week presented investors with somewhat of a headwind in the operation of monthly options expiration. With the S&P 500 achieving its total weekly expected move ($72) in the first trading day of the week, this actually caused some of the weekly downturn. With many options set to expire Friday, but already being executed on Monday, investors made choices from Tuesday through Friday on their holdings, given the S&P 500 was within a stone's throw away of the all-time high once again. It appears as though the decision was to simply take profits, rebalance and await a better buying opportunity given the "uncertainties" abound.
I had a clear idea of what we could anticipate this past week given that 2 weeks ago the market achieved a significant breadth thrust. Let's quickly review what was offered in last week's Research Report (subscription needed) and before we look at some updated charts and market breadth characteristics:
"Historically speaking, 10-day breadth thrusts in October are a really good sign of even higher prices in November. Here are all instances of the S&P 500 gaining 5% or more over a 2-week stretch (which just happened) for all weeks ending in October. Spoiler alert; undefeated 1 month later. (Study from Steve Deppe)
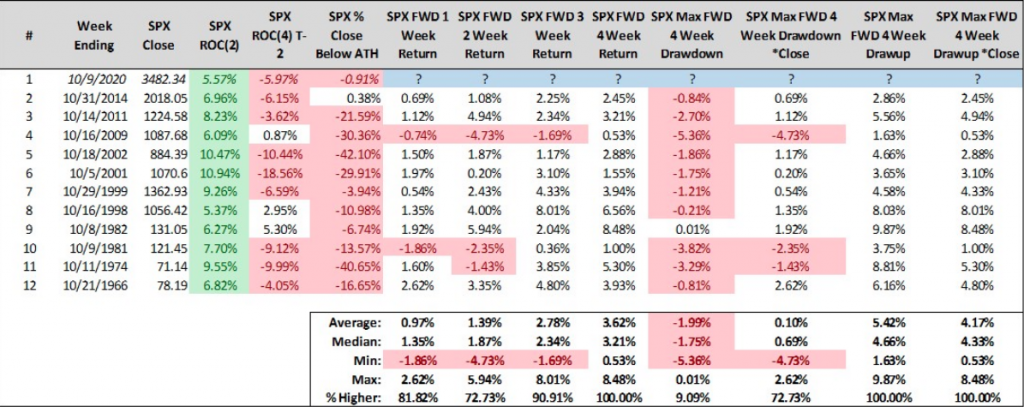
- No election years within the study.
- 8 of 11 instances didn’t close a calendar week lower at any point over the forward 1-month.
- Average draw-ups are ~5%.
- 4 weeks from now is 11/6. Few believe it’s possible to close at ~3,656 on 11/6.
What has taken place in the market over the last 2 weeks suggests further price gains are ahead. Earlier in the past trading week, Seth Golden emphasized how breadth leads price with the S&P 500 A/D line making a new high. (Chart below)"
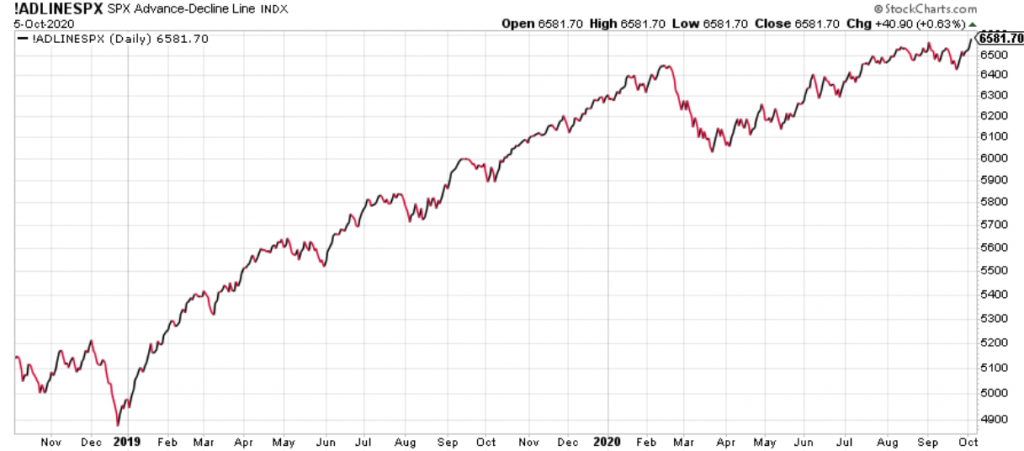
I’ll advance that breadth analysis with the following breadth indicators also hitting new highs through the end of the week. As of Thursday this past week, these advance/decline lines all made new all-time highs:
- NYSE Composite
- Dow
- Mid-Cap S&P 500
- Nasdaq
- Nasdaq 100
- S&P 100
- Also, Dow Transports (DJT) made a new all-time high
As noted above, I anticipated more price gains and such price gains came with a significant move higher on Monday. Having said that and looking at the study from Steve Deppe above, we shouldn't overlook that the recent breadth thrust didn't achieve its weekly performance average, post a 10-day breadth thrust. Does this eliminate the study's efficacy? No! This forces us to look at what we might anticipate over a longer period of time, including the 2-week period post the breadth thrust (1.39%). The probabilities of improving market returns is notable in the study, even if none of the occurrences took place during an election year, but we are reminded of that notable variable which may prove the headwind for this particular series of historical data.
The "past" can afford us an idea of the risks involved when investing in the markets, but it doesn't tell you where and when those risks will come from going forward. Is the risk to the study the election? We simply won't know without hindsight, but at least we can use the variable as an instrument of risk management near-term. Trying to predict the future is impossible. Reality then forces every investor to analyze the present, while understanding the past. You have to make high probability decisions in the face of uncertainty, but those probabilities aren't etched in stone. Be willing to accept the risk your taking across reasonable timelines and objectives for taking that risk.
In looking at market price action this past week, it proved underwhelming and with weakened breadth. Not weak breadth, but weakened breadth. There is a difference folks and that difference has to do with absolute levels. Directionally, breadth is changing all the time, but where it ends up is a measure of strength or weakness overall.
The chart of cap-weighted S&P 500 A/D lines below shows large and mid-cap A/D lines recently made new highs, but small-cap (bottom) and NYSE A/D (top) lines have halted their progress.
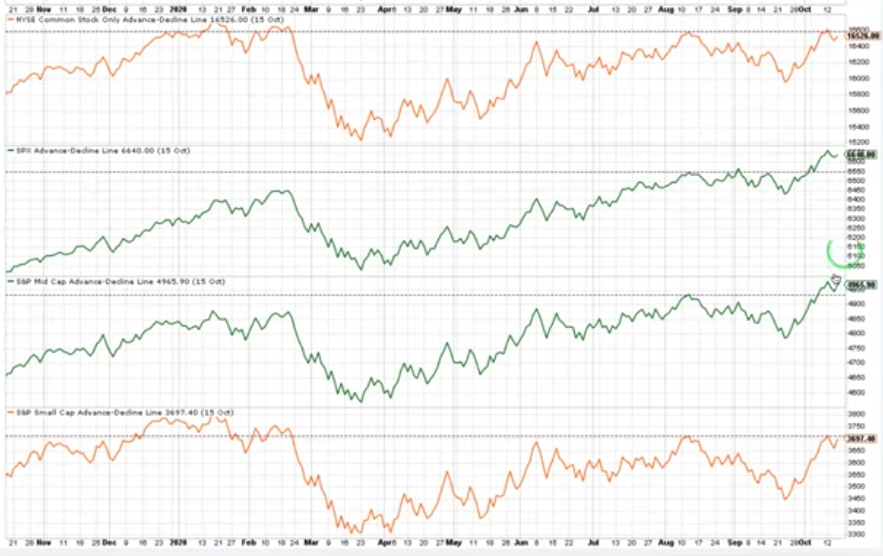
This simply informs us that large and mid-cap stocks are outperforming small-caps, at least. It also informs us that a catch-up trade holds the potential for small-caps to bolster the overall market once again and as it had in the more recent past. Despite small-caps lagging this past trading week, they are still leading since the March 23rd bottom and by nearly 7 percentage points.
The all-time high in the Russell 2000 (RUT/IWM) was 1,715, set in 2018 at 1,742. The small-cap index is just over 100-points from achieving a new high, something attempted earlier this year, but abruptly aborted due to the Covid-19 recession.
The following chart from DataTrek shows a 100-trading day relative price performance for the 2 indices back to 2000. When the line is above the y-axis, Russell has done better than the NASDAQ over the prior 100 days, and when it is below it has underperformed. The y-axis runs from -30 points to +50 points.
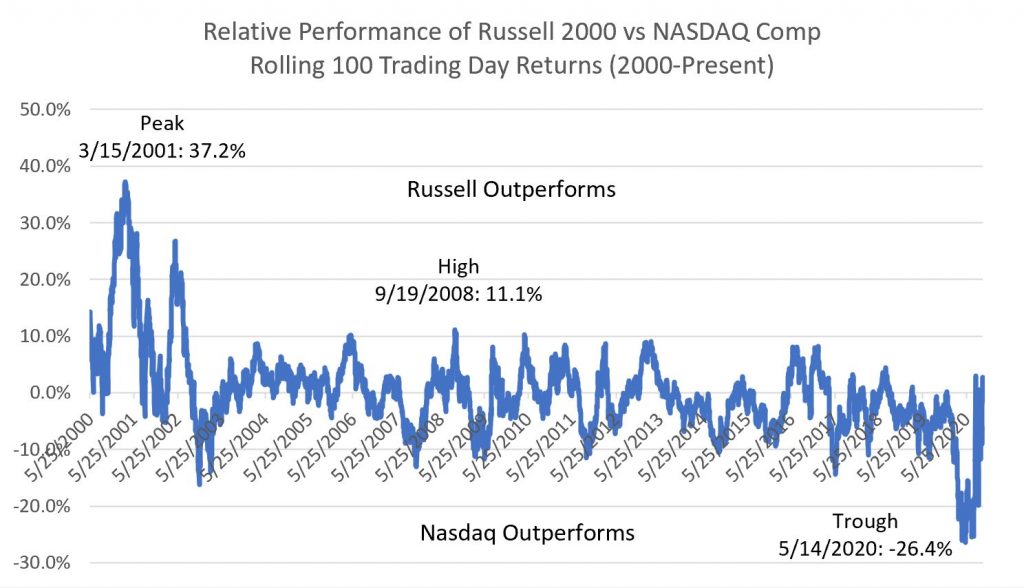
When the Russell underperformed the NASDAQ by 8-10 points or more (2002, 2003, 2007, 2014, 2016, 2017, 2019), you could rely on small caps to play catch up over the next 100 days. Conversely, whenever you saw the Russell outrun the NASDAQ by 8-10 points over the prior 100 days (2006, 2008, 2010, 2011 – 2013, 2016, 2017) you could bank on Tech catching a bid relative to small caps and closing up the gap in the next 100 days.
#1: There are only 2 instances where this pendulum-like relationship (+10 points/-10 points) has really broken apart since 2000:
- The bursting of the dot com bubble, where the Russell outperformed the NASDAQ by 37 points (noted in the graph above) in 2001 and +20 points in 2002.
- The 100 days ending May – July 2020 (also noted in the graph), when the Russell underperformed the NASDAQ by 25 points.
#2: Through last Friday, the Russell and NASDAQ are essentially even over the last 100 trading days (0.9 points in favor of the NASDAQ, but it was +2.1 points to small caps on Wednesday so we’re calling it even). The pendulum has swung once again, in other words, and small-caps are catching up.
On the plus side for small-caps relative to Tech: they are coming off their worst underperformance in decades and can therefore continue to play catch up. In fairness, 2020 was a perfect (positive) storm for Big Tech and a negative one for small U.S. companies so that canyon you see in the chart is entirely understandable. But as investors look for companies with earnings and balance sheet leverage to a recovery, small caps fit that bill.
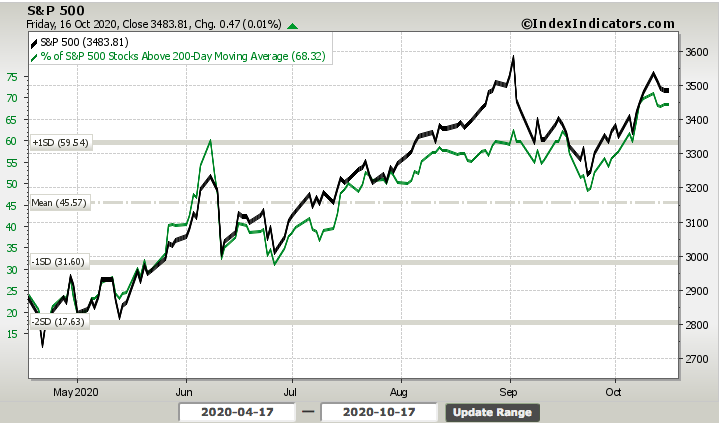
Moving away from our small-cap index and back to large-cap index issues, I don't see broad market breadth deterioration. What I see is sideways, choppy market breadth that may persist without a more tangible catalyst to boost investor sentiment. The percentage of stocks trading above their 200-DMA remains elevated, although lower on a WoW basis by roughly 1 percentage point. The absolute level remains quite strong.
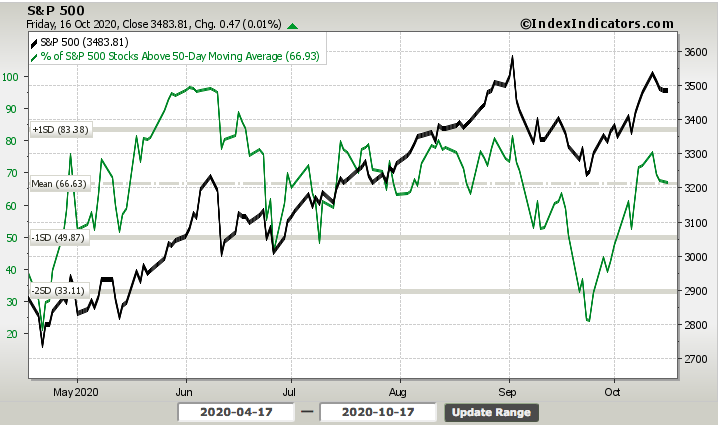
We can see similar weakened, but not weak breadth in the percentage of stocks trading above their 50-DMA in the chart below. This particular breadth indicator proved weaker than the 200-DMA breadth indicator given the proximity of the moving average with the current SPX price.
Given that the markets basically went nowhere this past trading week, breadth proves less consequential as such indicators move little as well. Our longer-term trend remains our guide under such circumstances and until the markets or breadth signal something more relevant. Having said that, certain pairing and relative strength performance suggest the bullish trend will remain over the interim.
With the Industrials sector having performed very well over the last couple of months, one stock, in particular, comes to mind; Caterpillar (CAT). This stock recently broke out and above a longer-term trend line.
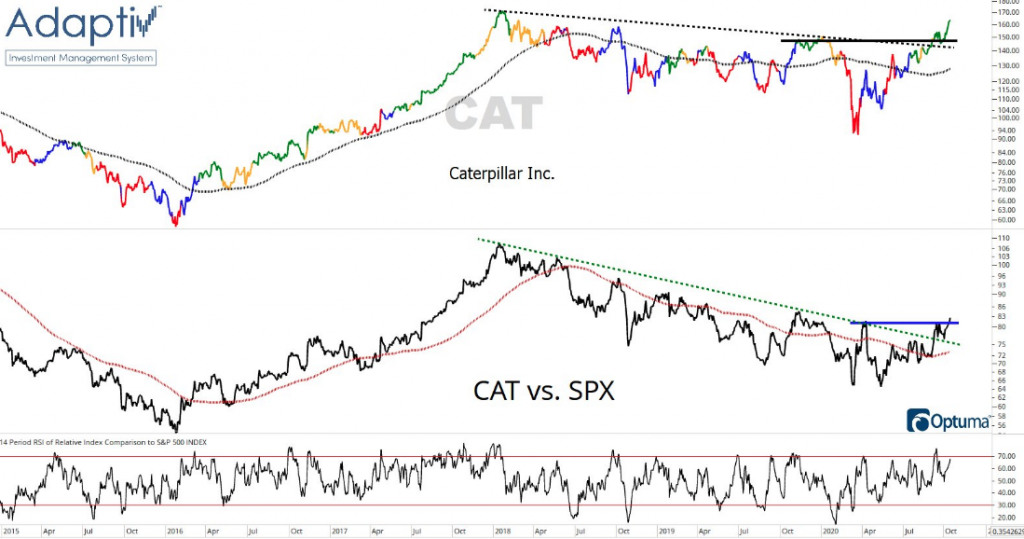
Not only did the stock break above a longer-term trend line, but it's a relative performance with the S&P 500 has also broken out to the upside (bottom panel chart). CAT is definitively signaling to investors that the uncertainties of the day hold the limited potential to derail the global economy longer-term. Investors have received this message and are signaling a willingness to weather near-term storms in favor of the long-term destination.
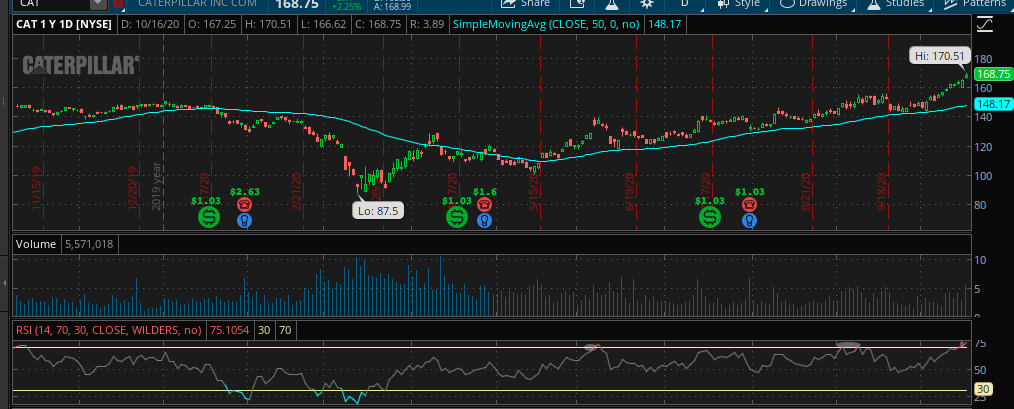
I wouldn't jump into CAT right away. Like the small-cap ETF, it may prove prudent to set a course of action that includes buying dips, rather than chasing rips to the upside. One of the reasons I offer such commentary is due to the fact that the recent move in shares of CAT is rather parabolic and finds the RSI (14-day relative strength index) has achieved 70, typically an overheated reading that may prove unsustainable near-term.
If small-caps and CAT don't work for your portfolio, keep in mind that I've been highlighting Transports within the Industrial sector ETF (XLI). It may also prove noteworthy that Boeing (BA) is in the large-cap Industrial Sector ETF (XLI). Try as they may to push and keep BA below $160 a share, they have not been able to do so. While the stock has not broken out, does not express strong technicals, and has been in a longer-term consolidation phase, it would appear the lows for the CYCLE are in for shares of BA.
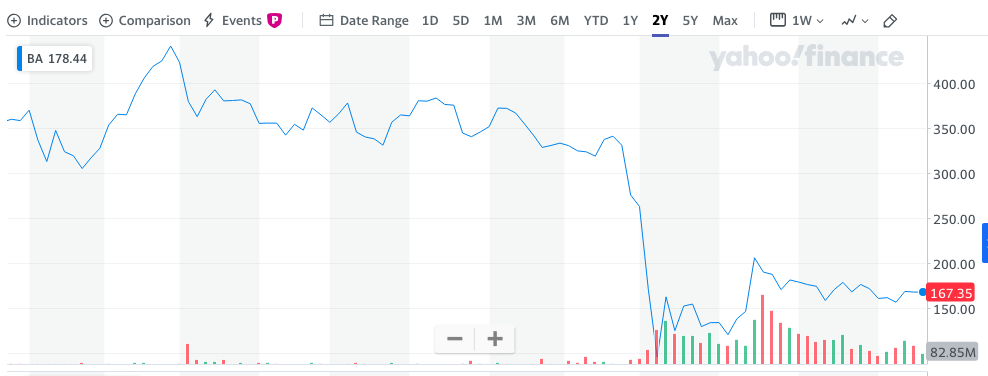
Since Q1 2019, it seems as though everything has been thrown at BA to suppress upward price action in the stock. Nonetheless, the fundamental concerns have only produced a floor for which long-term investors with an optimistic and historic understanding of the Boeing business model are looking to take advantage. I think BA will find share price appreciation through 2021, barring additional and new exogenous force factors on the fundamental business operation. The latest headlines support the fundamental resurgence in 2021.
"Shares of Boeing Co. rose Friday as comments from the top European aviation-safety official reinforced investors’ sentiment that the company’s troubled 737 MAX jetliner was on track to return to service in coming months.
Patrick Ky, executive director of the European Union Aviation Safety Agency, said in an interview with Bloomberg that he thinks proposed changes sufficiently address problems with a faulty flight-control system implicated in two fatal MAX crashes."
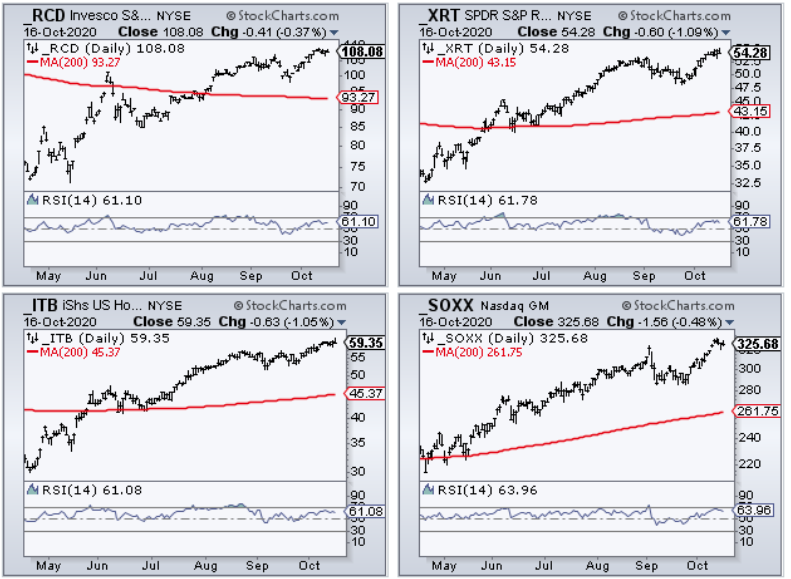
In keeping with a focus on defining choppy near-term expectations but longer-term bullish momentum, it's hard to argue with new highs in the Equal-Weight Consumer Discretionary ETF (RCD), Retail sector ETF (XRT), Home Construction ETF (ITB), and Semiconductor ETF (SOXX)
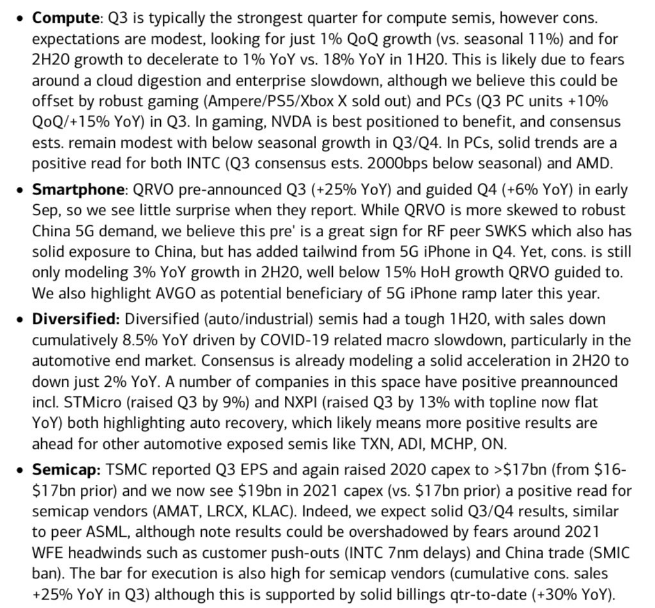
As it pertains to the Semiconductors/chips, Intel (INTC) will be reporting results this coming week. The stock has hit its highest level since it's disappointing announcement during the firm's last quarterly release where it forecasted a delay in its next-generation processors. Nonetheless, the estimates may prove too low for the current economic backdrop as detailed by Bank of America's Global Research team:

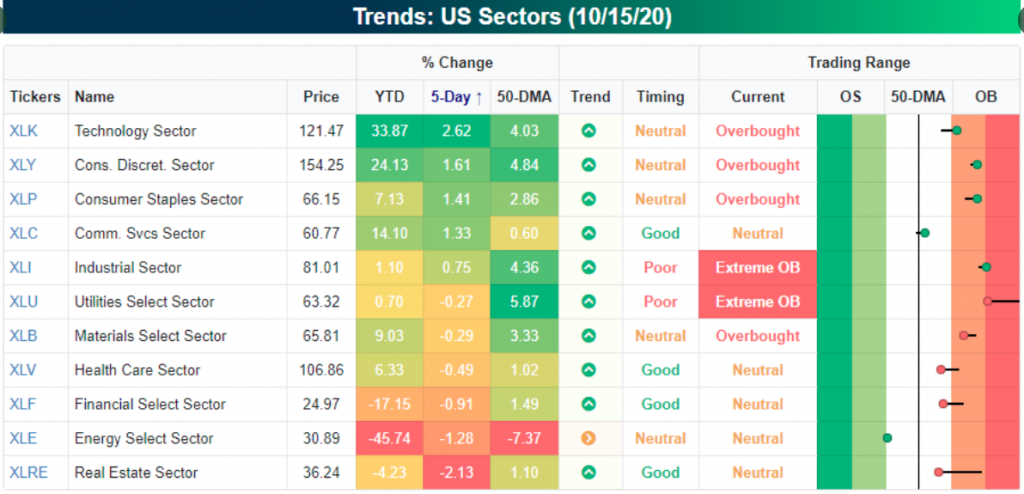
Index and sector ETF investors might create a game plan for the remaining 2020 period in my honest opinion. I've made it part of my game plan for the Golden Capital Portfolio, highlighting IWM, but it also includes the Information Technology sector ETF. With that being offered, here is a look at the trending sector ETF performance as of this past week and where the individual sectors sit in relation to their 50-DMAs.
“The pessimist complains about the wind; the optimist expects it to change; the realist adjusts the sails.” -William Arthur Ward
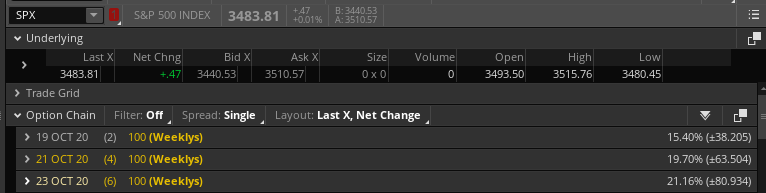
The coming week is anticipating a greater S&P 500 weekly expected move. It has jumped from $72/points to $80/points this coming week, which is in keeping with the VIX having risen ~10% this past trading week.
Does The Economic Data Prove A Setback
The kick-off of earnings season is upon us and the height of earnings season is just ahead. In between now and then, the economic data does not relent but for brief moments and only to accelerate the disseminations thereafter.
Given that the bounce in activity off the extreme April lows is behind us, economic data relative to expectations, as measured by Citi’s Economic Surprise Index, have cooled. Put simply, actual reported data has come in below economists’ estimates, which contrasts with the spike earlier in the year when estimates were at extreme lows. As the chart below shows, we are still near record territory relative to history, but the pace is slowing.

The aforementioned weakening of the CESI is just one perspective. Another perspective suggests that as economies normalize economic output, economists are better able to forecast data points, and therefore beat rates are curtailed. In other words, it may not be that economic conditions have cooled, but rather forecasting has improved. Or maybe that's just my usual optimistic viewpoint. Nonetheless, there is defined logic in the offering.
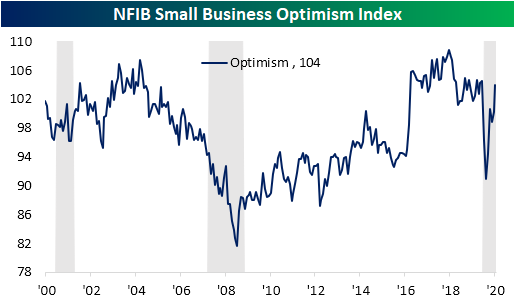
For this past week's economic docket there were offerings of soft data (surveys) and hard data. The first survey was the NFIB small business index survey. Sentiment among small businesses continued to improve in the month of September. As shown below, the index rose 3.8 points to 104 which is now just half of a point below the levels prior to the pandemic in February. That was also better than expectations of a smaller improvement to 101.2. Small business sentiment has now risen in four of the past five months. (From Bespoke Investment Group)
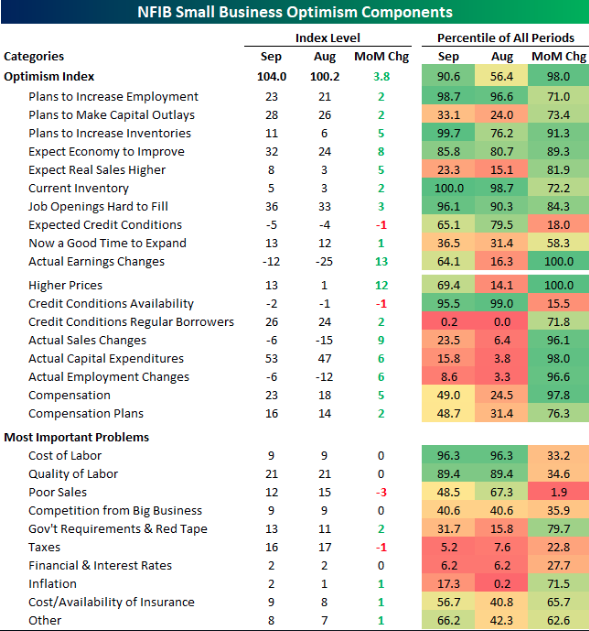
In the table below is a break down of this month’s report by each of the 10 components of the headline number as well as the many other indices included in the report such as those not used as inputs to the headline number and what small businesses are reporting to be their biggest problems.
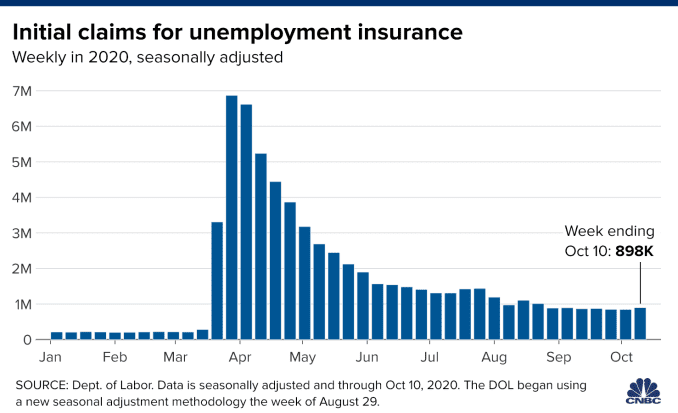
It wasn't until Thursday's more pressing economic data that investors were found with greater concern for the economic outlook, especially with respect to the labor and employment business segment of the economy. American workers continued to hit the unemployment line last week, with 898,000 new claims filed for jobless benefits, a jump of 53,000 from the previous week. The total for the week ended Oct. 10 was the highest number since Aug. 22 and another sign that the labor market continues to struggle to get back to its pre-coronavirus pandemic mark.
Despite the higher-than-expected total, the level of continuing claims continues to fall at a brisk pace, declining by 1.165 million to just over 10 million. Continuing claims data runs a week behind the headline claims number.
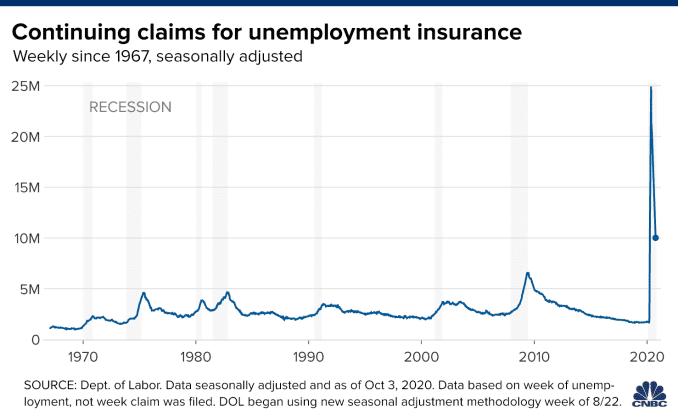
The economy has recaptured some 11.4 million positions/jobs, or about half those who were sidelined. The unemployment rate has come down to 7.9% but is still more than double its pre-pandemic level. The 4-week moving average of continuing claims fell by 682,250 to 11.48 million.
Those receiving first-time benefits under the Pandemic Unemployment Assistance program continued to decline, sliding by more than 91,000 to 372,981. That program provides compensation to those who normally wouldn’t be eligible for benefits, such as freelancers and independent contractors. However, recipients under the program accounted for more than half of those getting unemployment benefits as of Sept. 26. Those receiving benefits under the emergency claims portion of the pandemic program increased by more than 800,000, though that data also is two weeks old.
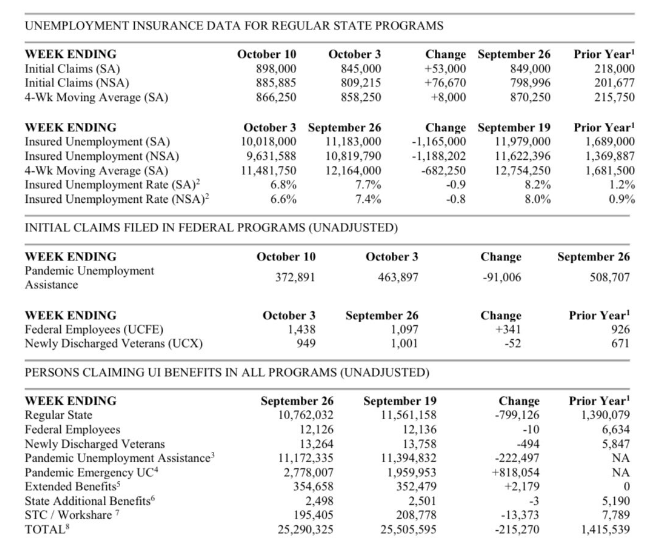
The table above comes directly from the jobless claims report. The very bottom line identifies total claims. Taking together all jobless claims categories, jobless claims fell by ~215,000 last week.
While the labor market is very slowly improving, it remains an item of concern. I remain optimistic that the recovery will also remain intact, and some form of additional fiscal aid is likely eventually, but I worry that the seas may prove choppy near-term. Investors need to be willing to accept that the tides will rise and fall.
The timing of fiscal relief is one concern going forward. If it’s delayed until January or beyond, there’s a risk that the economy will lose momentum, causing growth to slow, but grow nonetheless. There are already signs of slowing in the job market obviously, where companies have announced major layoffs due to lack of demand. In the public sector, layoffs already have begun by state and local governments due to budget shortfalls. Because state and local government employment accounts for about 13% of Nonfarm payrolls, the job losses can dampen the economy’s ability to rebound. State employment drops to the lowest level in nearly two decades, as shown in the chart below:

With all the jobless claims data we have since March, something just doesn't add up. The fact is that the U.S. recorded roughly 50 million initial claims in the four months between March and June, yet that translated in a peak to trough drop of just 22 million jobs. That math just doesn't make any sense. Fifty million people said they were out of a job and filed a claim. Yet, and to repeat, the Nonfarm payroll report said we only lost 22 million jobs over the same time period. One can only conclude from the black and white data that the pace of REHIRING was either remarkably rapid or it should be a red flag that something is broken in the claims data process or processing of claims. (Full version of this weekly report identifies the problem and why claims may be artificially inflated)
I can recall from the heights of the pandemic back in April and May when individual state unemployment offices were being overrun with claims and saying that our SYSTEMS weren't created to handle such record, rapid level of claims filed. I'm now more convinced, based on the weight of the evidence, that this is the underlying problem with the jobless claims data to-date. Having said that, presently and until further notice, this is the data we have to work with. To the degree that the market has seemingly bucked the weakness in the jobless claims data, it may have long-since taken such a rational and logic-based approach.
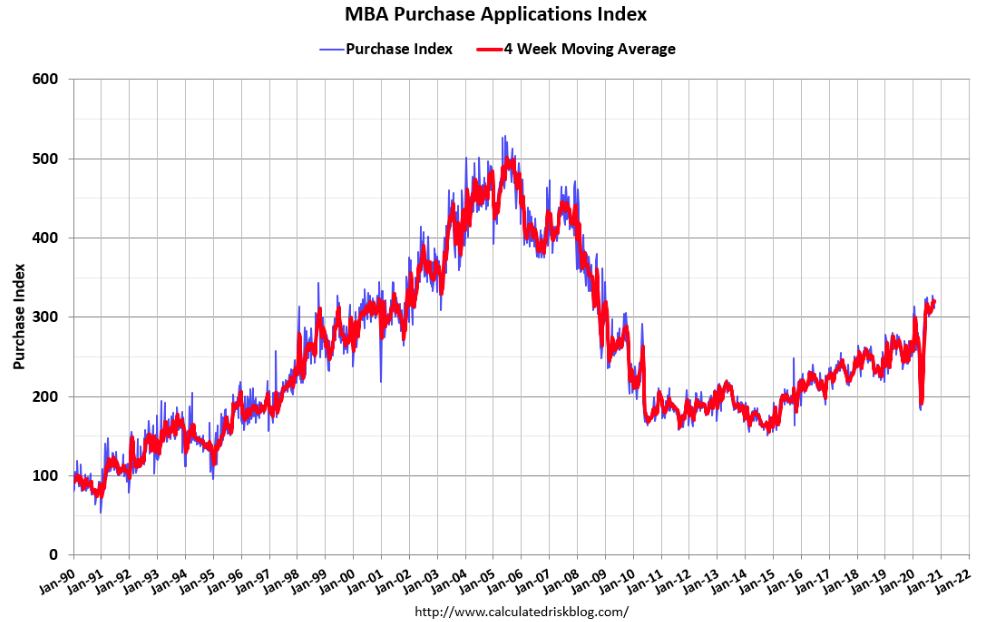
In the week ahead, Housing sector data will highlight the calendar. We continue to see signs that the housing market will remain robust and with demand outstripping supply for the foreseeable future. Mortgage application data foreshadows this assumption. Mortgage applications to purchase a home fell 2% for the week and were 22% higher than an ago. That is a slightly smaller annual gain than the previous week. Demand for housing has been incredibly strong in recent months, as pent-up demand from the pandemic-struck spring combined with a resulting desire for larger suburban homes.
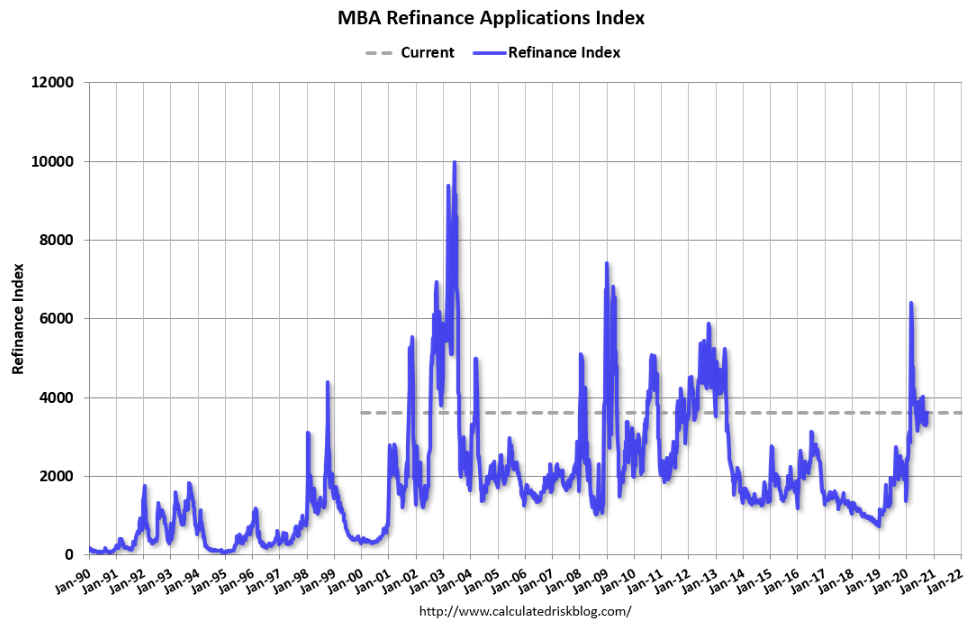
The Refinance Index decreased by 0.3% from the previous week and was 44% higher than the same week one year ago. The average contract interest rate for 30-year fixed-rate mortgages with conforming loan balances ($510,400 or less) decreased to 3.00 percent from 3.01 percent, with points decreasing to 0.32 from 0.37 (including the origination fee) for 80 percent loan-to-value ratio (LTV) loans.
As remarked earlier, we've continued to see a strong rebound in regional Purchasing Manufacturers Indexes (PMIs). This past week, the strength in the Philly Fed PMI evidenced that the strength continued in the month of September.

- The Philly Fed PMI diffusion index for current activity increased 17 points to 32.3 in October, its fifth consecutive positive reading after reaching long-term lows in April and May.
- The percentage of firms reporting increases this month (47%) exceeded the percentage reporting decreases (15%).
- The index for new orders rose 17 points to a reading of 42.6. Nearly 55% of the firms reported increases in new orders this month, compared with 42% last month. The current shipments index also increased 10 points to 46.5 in October.

- On balance, the firms reported increases in manufacturing employment for the fourth consecutive month.
- The current employment index, however, fell 3 points to 12.7 this month. Employment increases were reported by 23% of the firms, while 10% reported decreases. The average workweek index was positive for the fourth consecutive month and increased 18 points to 25.3.
The Empire State Manufacturing Index also reported growth in the October survey, although it wasn't as strong as that which was produced in the Philly Fed Index. Business activity expanded modestly in New York State, according to firms responding to the October 2020 Empire State Manufacturing Survey.
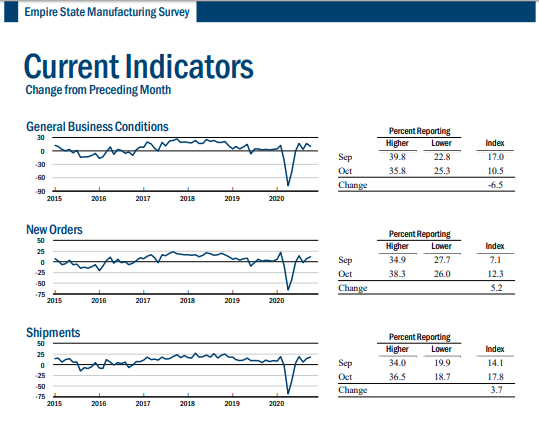
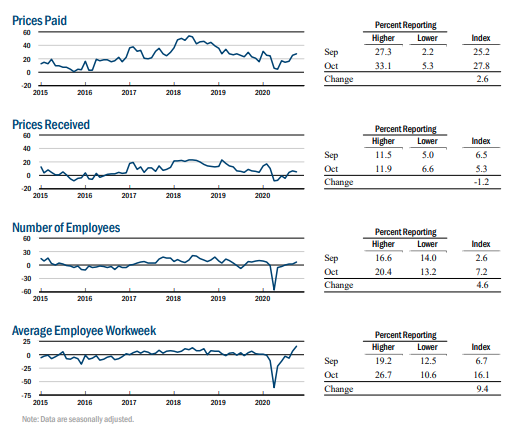
The headline general business conditions index fell seven points to 10.5, pointing to a slower pace of growth than in September. The index for the number of employees moved up five points to 7.2, indicating that employment levels grew. The average workweek index rose nine points to 16.1, a multi-year high, signaling a significant increase in hours worked.
Monthly retail sales for September rounded out the most pressing of economic data this past week and it proved to be much stronger than economists were forecasting... much stronger! In fact, September marked 5 consecutive months of YoY gains. It is worth noting the economy has never been in a recession after 4 or more consecutive monthly gains in retail sales. Still, in the face of one of the most severe recessions ever, it took only a few months for sales to get back to new highs, as shown in the chart from LPL Financial below. Historically, new highs in retail sales happen in expansions, and this is yet another clue the recession is likely over.

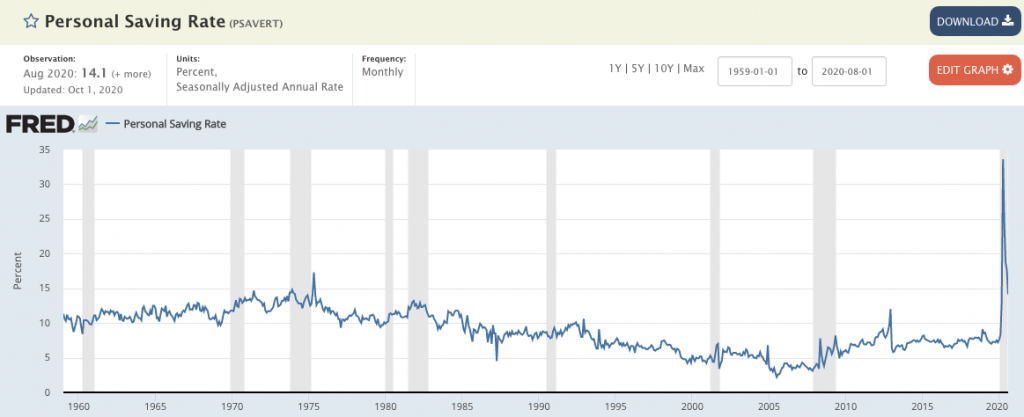
September retail sales grew 1.9% from August and were up 5.4% year-over-year. Such YoY strength would not be assumed even in expansion years. This strength in retail sales is undoubtedly a byproduct of the former unemployment insurance benefits from the Cares Act, which accelerated the Personal Savings rate to record levels.
Another factor in the unusually strong September retail sales was likely a factor of pent-up demand combined with a belief that more fiscal relief was coming. This belief, despite the seeming impasse amongst Congress to deliver any relief before the election, is also likely due to what is extrapolated in the polling data.
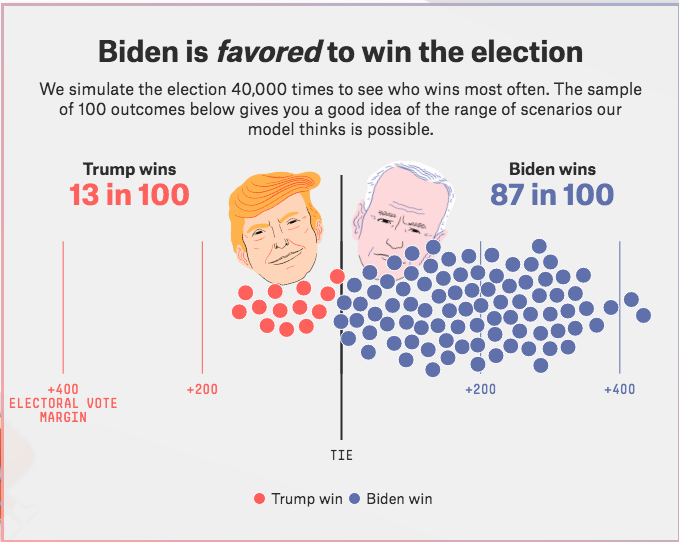
With a substantial lead for Joe Biden being demonstrated in most national, mainstream polling, consumers have understood that the challenger and Democrat party is desiring a large fiscal relief package. Consumers may have been calculating the probability of a new Administration and their personal savings, drawing the conclusion that they can afford to buy some of the non-essential goods they had held back in past months. Lastly, we might also conclude that jobless claims have/are overstated and highlighted by the strength of retail sales.
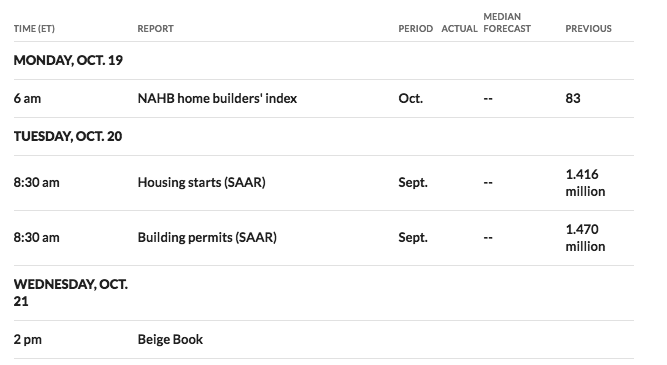
For the coming week, the focus will remain on the strength or weakness of the labor and employment data. Housing data will also come to forefront as Housing Starts and Building permits will be released alongside Existing Home sales.
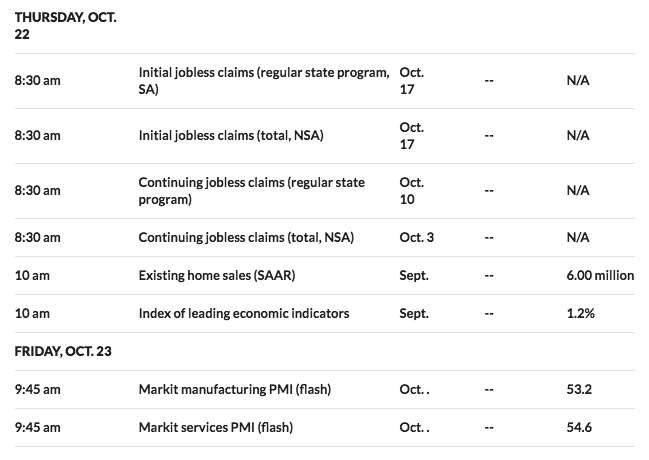
Finom Group (for whom I am employed) remains of the opinion that the economic recovery is on track to express a sustainable expansion cycle into and through 2021, barring any exogenous economic event. Our baseline outlook is with respect to the incumbent party being reelected. Should a blue wave take place, we would expect greater potential economic growth in 2021 based on the magnitude of fiscal relief. Some type of fiscal deal (various sizes shown in chart) would help S&P 500 EPS & boost GDP growth (by 420bps at most with a $2T package) as per Evercore ISI’s calculations (data below). Even a piecemeal approach would have some meaningful effects.
Earnings Beats Rolling In With The Season
With big-money center banks and financials releasing Q3 2020 earnings and sales results this past week, S&P 500 EPS tracking/estimates have risen substantially for the quarter. I'll be the first to say that I did not model the beats to be as strong as they are coming. Nonetheless I did anticipate more upward revisions by the tracking firms and still anticipate Q3 2020 EPS to fall roughly ~15% when all results are delivered for the quarter. Now, let's recall FactSet's most recent tracking for Q3 2020 EPS as offered in last week's Research Report:
"FactSet has further, positively revised its EPS tracking model to reflect a YoY decline in earnings in Q3 2020 of (-20.5%). We still believe the estimates are too low and will continue to be revised higher as the earnings season period kicks into high gear this coming week."
Now let's see what has taken place with FactSet's latest tracking model, after man financial stocks have reported their quarterly results. At this point in time, more S&P 500 companies are beating EPS estimates for the third quarter than average and beating EPS estimates by a wider margin than average. As a result, the index is reporting higher earnings for the third quarter today relative to the end of last week and relative to the end of the quarter. The S&P 500 is now projected to report YoY earnings growth starting in Q1 2021.
Overall, 10% of the companies in the S&P 500 have reported actual results for Q3 2020 to date. Of these companies, 86% have reported actual EPS above estimates, which is above the 5-year average of 73%. In aggregate, these companies are reporting earnings that are 21.7% above the estimates, which is also above the five-year average of 5.6%.
Insight/2020/10.2020/10.16.2020_EI/S%26P%20500%20Earnings%20Above%20In%20Line%20Below%20Estimates%20Q3%202020.png?width=920&name=S%26P%20500%20Earnings%20Above%20In%20Line%20Below%20Estimates%20Q3%202020.png)
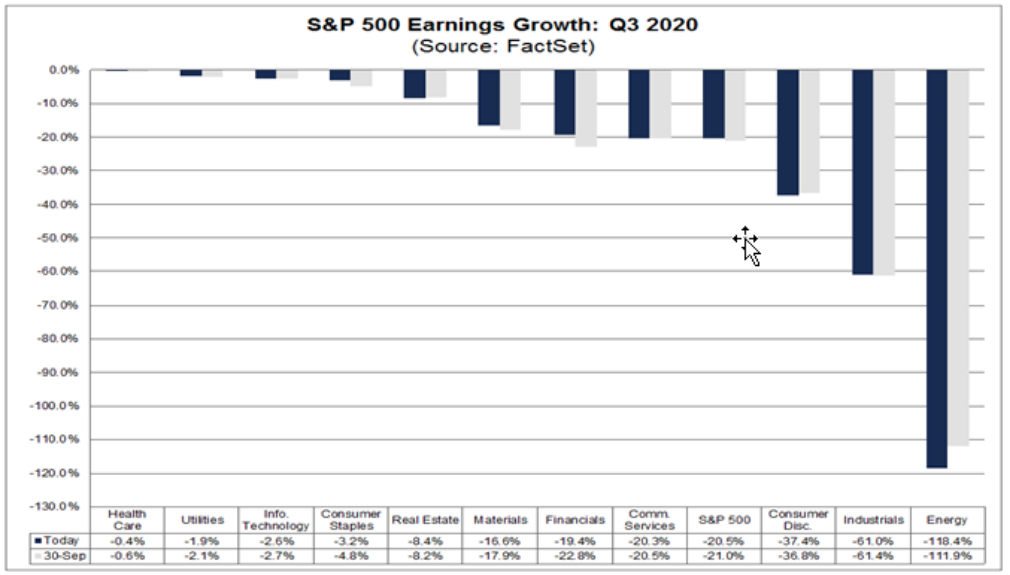
Due to the number and magnitude of these positive EPS surprises, the blended (combines actual results for companies that have reported and estimated results for companies that have yet to report) earnings decline for the third quarter is smaller now relative to the end of last week and relative to the end of the quarter. As of today, the S&P 500 is reporting a YoY decline in earnings of -18.4%, compared to a YoY decline in earnings of -20.4% last week and a YoY decline in earnings of -21.0% at the end of the third quarter. Positive earnings surprises reported by companies in the Financials sector were mainly responsible for the decrease in the overall earnings decline during the past week.
Insight/2020/10.2020/10.16.2020_EI/S%26P%20500%20Earnings%20Growth%20Q3%202020.png?width=920&name=S%26P%20500%20Earnings%20Growth%20Q3%202020.png)
In terms of revenues, 82% of S&P 500 companies have reported actual revenues above estimates, which is above the five-year average of 61%. In aggregate, companies are reporting revenues that are 3.6% above the estimates, which is also above the five-year average of 0.7%.
Insight/2020/10.2020/10.16.2020_EI/S%26P%20500%20Revenues%20Above%20In%20Line%20Below%20Estimates%20Q3%202020.png?width=920&name=S%26P%20500%20Revenues%20Above%20In%20Line%20Below%20Estimates%20Q3%202020.png)
Due to the number and magnitude of these revenue surprises, the blended revenue decline for the third quarter is smaller now relative to the end of last week and relative to the end of the third quarter. As of today, the S&P 500 is reporting a YoY decline in revenues of -3.3%, compared to a YoY decline in revenues of -3.5% last week and a YoY decline in earnings of -3.6% at the end of the third quarter. Looking at future quarters:
- Analysts predict a YoY decline in earnings in the fourth quarter (-11.8%) of 2020.
- However, they are also project a return to earnings growth starting in Q1 2021 (14.1%).
- The forward 12-month P/E ratio is 22.0, which is above the 5-year average and above the 10-year average.
- During the upcoming week, 96 S&P 500 companies (including eight Dow 30 components) are scheduled to report results for the third quarter.

I have been of the belief that record level EPS could be found in 2021. Most had forecasted such a feat for 2022. It appears that our outlook is more reasonable given the Q3 reporting season to-date and what that may foreshadow for Q4 2020 EPS results. Moreover, when I look at the chart of consensus analysts EPS estimates for 2020, they have continued to rise from a trough of $126.18 in April to a peak this week of $130.44.
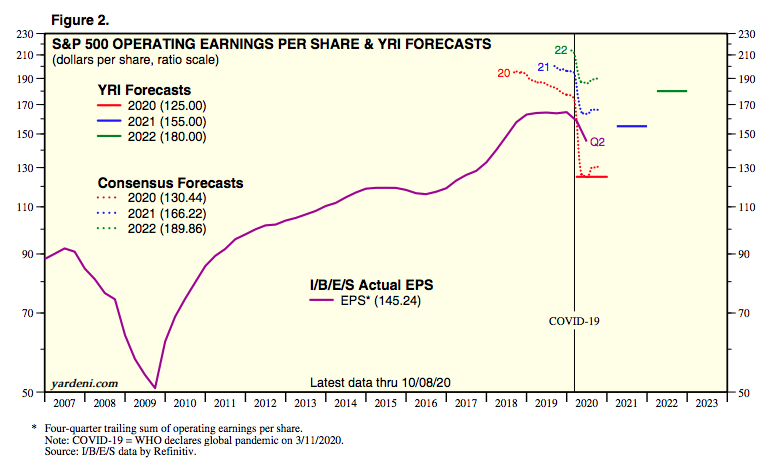
As shown in the chart above, consensus 2021 EPS is calling for $166.22 a share, slightly below the $168 in 2019. I am of the opinion such estimates for 2021 are far too low, too pessimistic and too encumbered by the various uncertainties noted at the onset of our Research Report. Having said that, investors should recognize this is the job of analysts, to create headwinds for their forecasts, to build into their models the risks that could curtail the otherwise likely and more positive outcomes that usually come via earnings beats.
The Tide Has Not Turned
Some of the best long-term investors are students of market history, however distant that history may prove. In our most recent past, more than 90% of the components in the S&P 500 were beneath their 10-DMA on September 24. Within 2 weeks we witnessed more than 90% move back above this short-term moving average. This type of buying thrust is consistent with future strong returns, suggests quick reversals from oversold to overbought are a good thing, and could bode well for stocks to outperform bonds well into 2021.

One might say that the market is holding up remarkably well given the uncertainty and/or headwinds that are seemingly fashioned by the media on a daily basis. I might respond to this person by reiterating that the market follows the trajectory of earnings over time, not headlines. The headlines, however, do create market volatility and volatility as measured by the VIX remains at historically elevated levels. Nonetheless, I am expecting the current levels of the VIX to subside into year-end and through Q1 2021. My forecast is modeled after the 2009 VIX performance, which didn't find the VIX dropping below 20 until December that year.
My forecast is mirrored in recent VIX options positioning by unknown participants and tracked by the CBOE's Russell Rhoads. Friday morning October 16, a couple of very large VIX option trades hit the tape. Both trades were 1 x 2 put spread, using the same strike options, initiated at the same price, but differing with respect to expiration dates. The first trade consisted of a buyer of 59,757 of the VIX Mar 21 puts at 1.74 who then also sold 119,514 VIX Mar 17 Puts at 0.45. The net result was a cost of 0.84 per spread. The payout at March expiration shows up below.

Spot VIX was quoted at 26.25 and the March VIX future was trading at 27.05 when this spread was executed. Anywhere above 21.00 this trade goes out with a loss equal to the cost of 0.84. The range of profitability, however, ranges from 13.84 on the downside and 20.16 on the upside. Best case is a March 2021 VIX settlement of 17.00 which results in a profit of 3.16 per spread.
The second trade the same day using VIX put options expiring in February bought 59,757 of the VIX Feb 21 puts at 1.54 and sold 119,514 VIX Feb 17 Puts at 0.35. Just like the March spread, the net result was a cost of 0.84 for each spread. Below is a very similar payout diagram highlighting significant price levels appears below.

The only major difference between the first payoff diagram and this second one is the February VIX future price is 0.20 higher than where March was trading. Otherwise, the risk, reward, and break-even prices are the same for this spread based on holding through February settlement.
Two trades, totaling about 360,000 VIX option contracts, are looking for VIX to return to the teens. Many consider that a ‘normal’ level for VIX which would also signal a return to normalcy for the equity markets in early 2021. Normal for the markets and normal for the economy are seemingly just around the bend!
Parts of the economy are opening back up, while employment continues to disappoint. One specific area that continues to improve is how many people are flying, as the 7-day average number of travelers going through Transportation Security Administration (TSA) checkpoints hit a new recovery high.

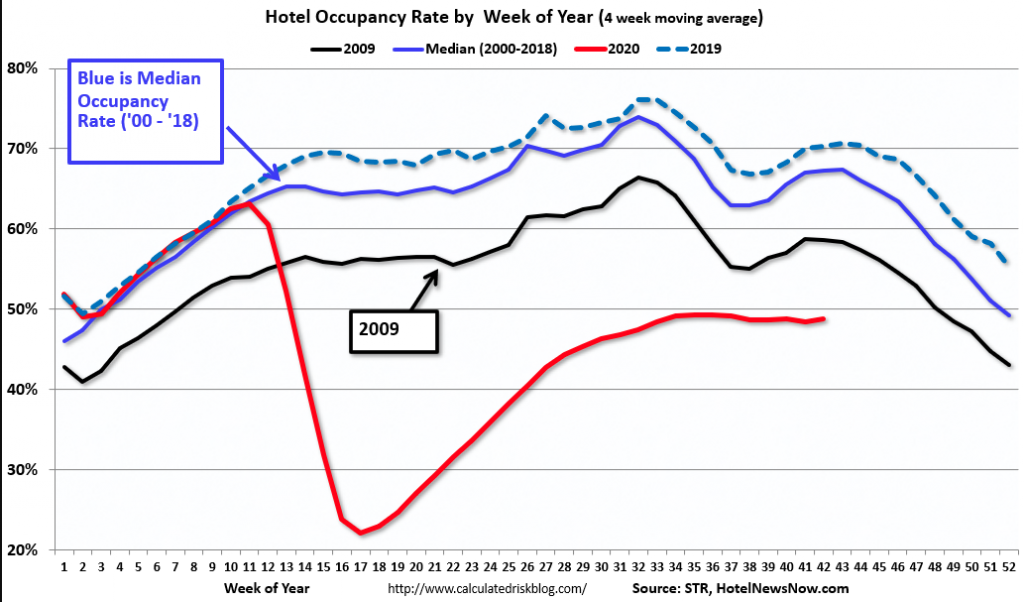
U.S. hotel weekly occupancy hit 50% for just the second time since the low point of the pandemic, according to the latest data from STR through October 10th. While a handful of the highest occupancy markets were those in areas affected by natural disasters (i.e. California wildfires), Saturday produced the week’s highest occupancy (65.2%) and Average Daily Rate (US$110.84), indicating that the leisure and weekend "staycation" demand seen during the summer may make appearances into the fall.
While a relief package of sorts is becoming increasingly unlikely pre-election, the S&P 500 is back to within a stone's throw of all-time highs. Many will claim this is illogical. Many are failing to recognize the long-term earnings picture and the forward-looking, discounting mechanism that is the S&P 500, Nasdaq and Dow Jones Industrial Average. Many are trying to surf the markets and failing, while the sailors are closer to their goal, their destination.
There are many reasons to be optimistic about the future of the economy and markets, but few reasons to be pessimistic. In the market and economic recovery wake was one of the fastest and most severe recessions in history. Think of what we've overcome and/or are overcoming as being as bad as bad can be and from that point how much worse it would have to become to regress for both the market and the economy. Now think of the likelihood of that scenario. The market has already calculated the odds and delivered its summation over the last 6 months. All that is left is to bring the ship back into the harbor and prepare for the next leg of the journey!
The markets' glide path is always higher even if not always smooth sailing and without its seeming capsizing potential. Such concerns of a ship sinking are often the most popular market narratives. Across open water there can be many paths to the same destination. If an obstacle is in the way, we should be found adjusting to the new headwinds. One can't argue with the market, it is always your truth, the same way one can not argue with the ocean. The experience of sailing provides context and perspective as we consider the financial markets overall and the journey we take as investors. In a world of ample computing power, multiple scenario analysis, and the quantification of possible risks and potential returns, we can get a false sense of security believing that portfolios are like powerboats, set the heading, determine the speed and hold on until you arrive at your destination. The reality tends to be closer to a sailing expedition. Initial heading and expected speed can be (indeed, often are) altered by unforeseen circumstances, fortuitous tailwinds as well as storms that can blow us of course. Investors, like sailors, need to be mindful of the environment, taking risk when appropriate and trimming sails/taking profit when warranted.


