
The COVID Recession Is Over
The Bureau of Economic Analysis announced today that seasonally adjusted U.S. real GDP grew at a 4.0% annual rate in the fourth quarter. That’s well above the 3.1% average growth that the U.S. experienced over 1947-2019, and follows a 28.8% logarithmic annual growth rate seen in Q3.
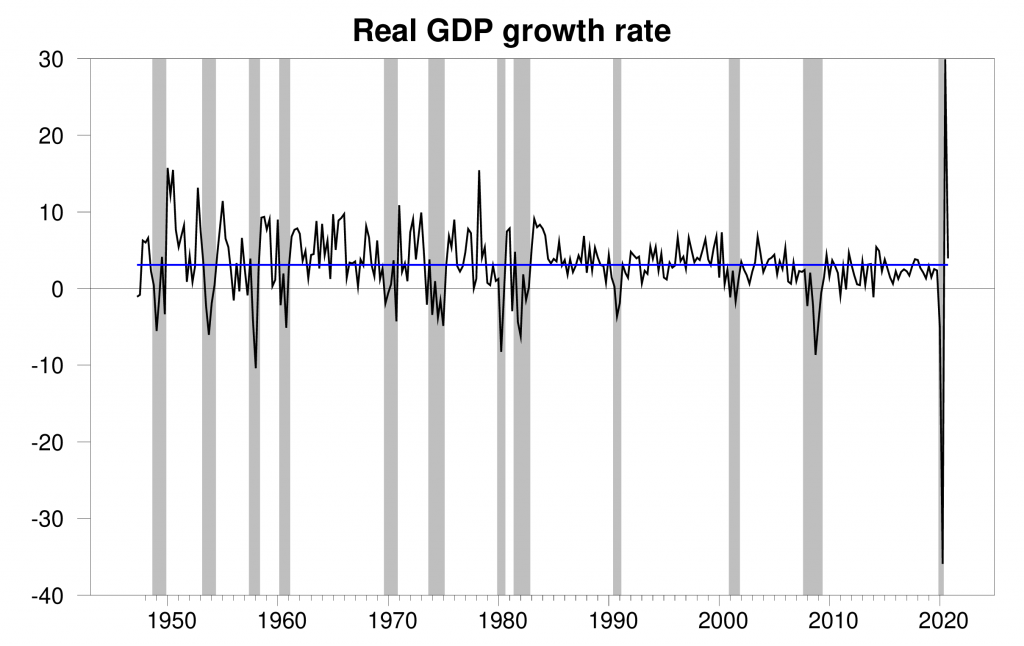
Real GDP growth at an annual rate, 1947:Q2-2020:Q4, with the 1947-2019 historical average (3.1%) in blue. Calculated as 400 times the difference in the natural log of GDP from the previous quarter.
These numbers bring the Econbrowser recession indicator index down to 0.0% for Q3. As we’ve done every quarter for the last 15 years, the number posted today (0.0%) is an assessment of the situation of the economy in the previous quarter (namely 2020:Q3). According to our algorithm, there is zero probability that the Q3 observation of +28.8% could be viewed as continuation of the recession that began at the start of 2020; the recession is unambiguously over. For this reason, in the figures I report from now on I will end the shaded region for this recession with the 2020:Q2 observation. The Business Cycle Dating Committee of the National Bureau of Economic Research has not yet made that call, though I believe they eventually will. If there is a downturn in 2021, the mechanical algorithm that we have been using for 15 years would label it as a separate recession.
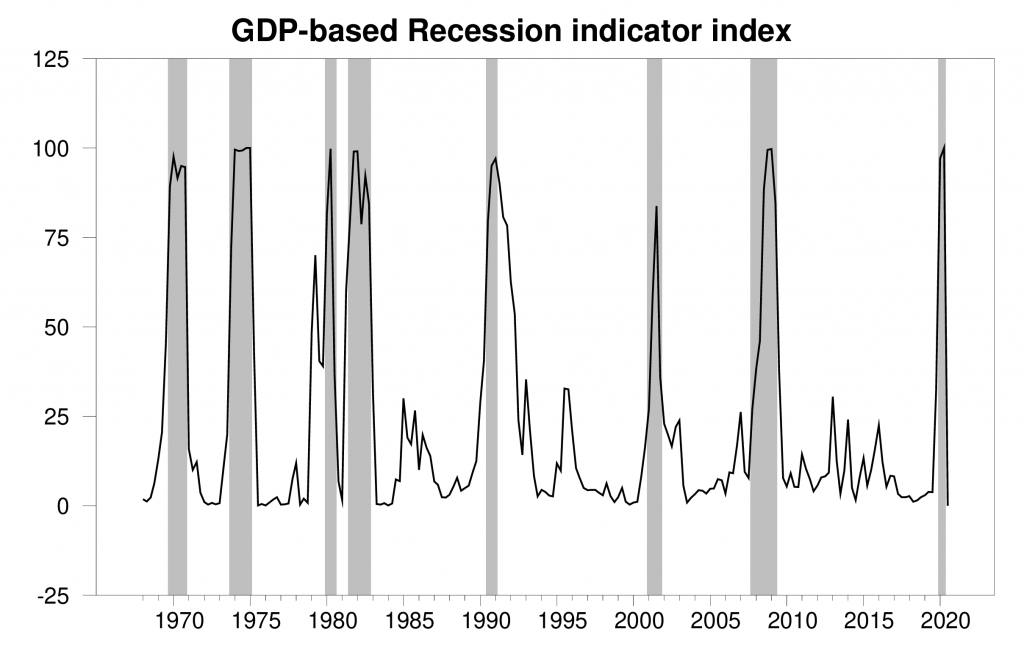
GDP-based recession indicator index. The plotted value for each date is based solely on the GDP numbers that were publicly available as of one quarter after the indicated date, with 2020:Q3 the last date shown on the graph. With the exception of the the end of the 2020 recession, shaded regions represent the NBER’s dates for recessions, which dates were not used in any way in constructing the index. The indicated end to the 2020 recession comes from the algorithm described in Chauvet and Hamilton (2005).
None of this should be taken to suggest that the economy has fully recovered from events of 2020. Economists have always followed the convention that recessions end when recovery begins (as opposed to when recovery is complete). The figure below plots the level of real GDP (again in logarithmic units) rather than the growth rate. Despite the positive growth in Q3 and Q4, the level of real GDP in 2020:Q4 was still 2.5% lower than it had been in 2019:Q4. Even if we were to continue to experience the strong 4.0% annualized growth rate of 2020:Q4 for every quarter in 2021, that would only increase the level of GDP by 1% each quarter, and wouldn’t bring us back to the 2019:Q4 level until the third quarter of 2021.
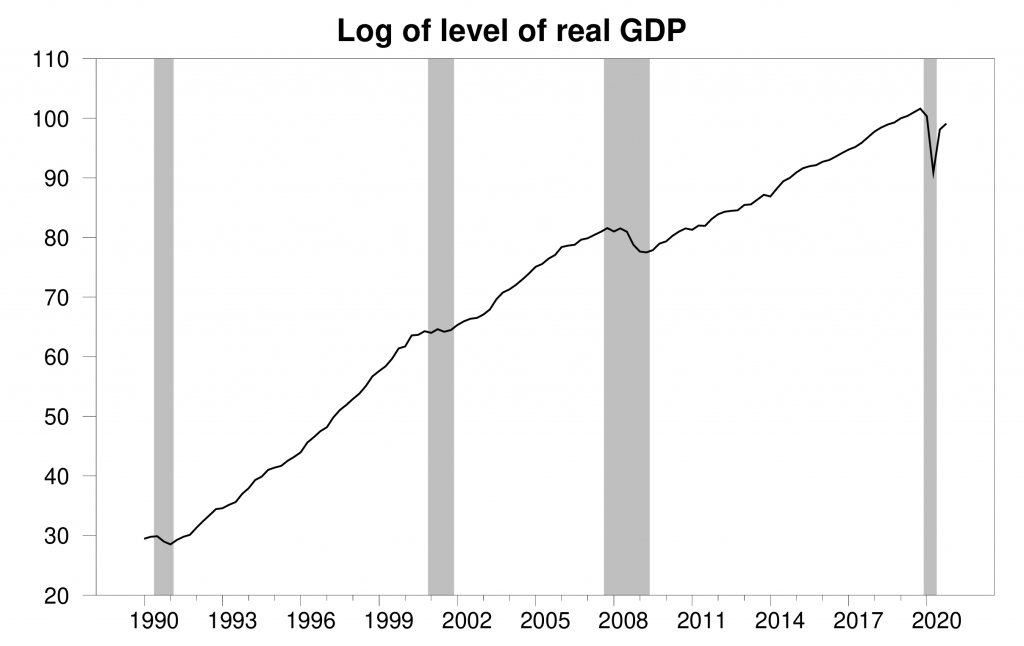
100 times the natural logarithm of the level of real GDP, 1990:Q1 to 2020:Q4, normalized at 2019:Q4 = 100. A movement on the vertical axis of 1 unit corresponds to a 1% change in the level of real GDP. The value for 2020:Q4 of 97.5 indicates that real GDP in 2020:Q4 was 2.5% below the value in 2019:Q4.
The next figure shows how the various components of GDP contributed to the annualized percentage growth rate each of the last 4 quarters. New home construction accounted for about a third of the total GDP growth in Q4. Taking the year as a whole, real residential fixed investment was 5.9% higher in 2020 than it had been in 2019, despite the dramatic recession in 2020:Q1-Q2.
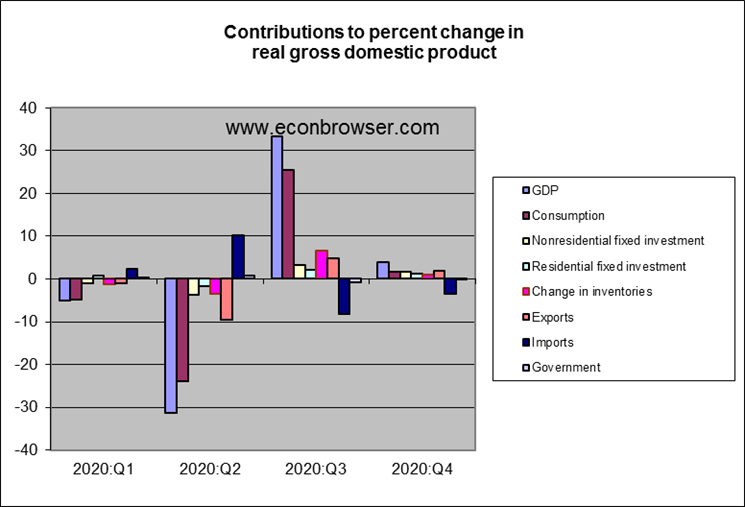
In this respect, although the recession itself was caused by unprecedented factors, the recovery at this point is looking like the recovery from other recessions, with growth in historically cyclical components like housing and autos leading the way. If these categories did no more than return to their average historical shares of GDP, that would still be a factor leading to above-average growth of GDP in 2021. And in most historical expansions, the later stages of a boom are fueled in part by above-average spending on these categories. So those gains can continue for a while yet.
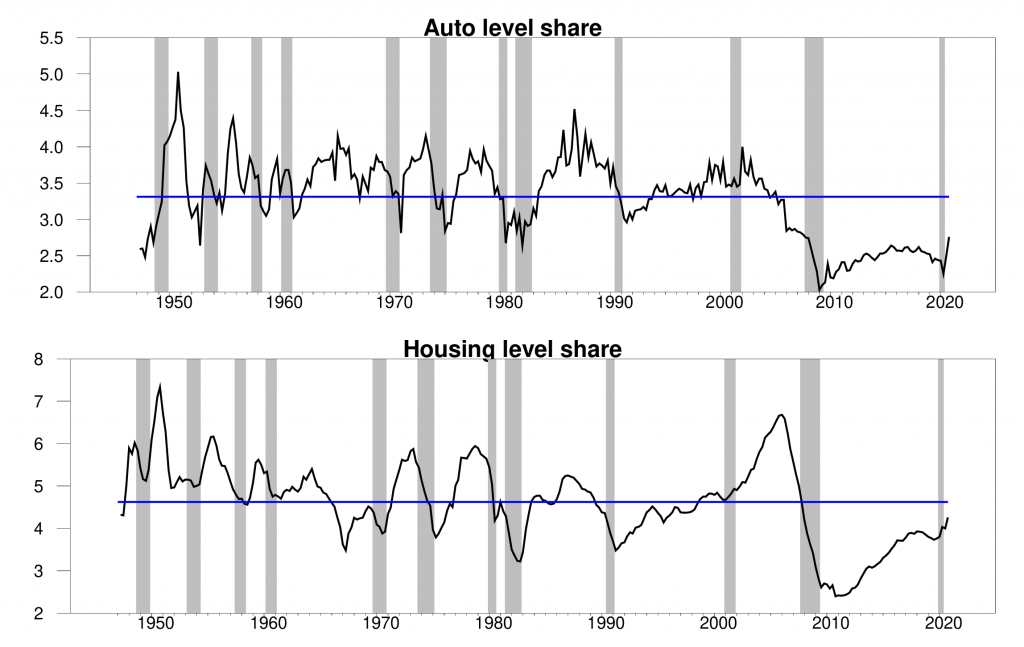
Contributions to the level of GDP, 1947:Q1 to 2020:Q4. Top panel: nominal spending on motor vehicles and parts as a percentage of nominal GDP. Bottom panel: residential fixed investment as a percentage of nominal GDP. Blue lines represent historical averages. Data source: BEA Table 1.5.5.
There are thus excellent reasons to expect to see the recovery continue with above-average growth for 2021.
Disclosure: None.


