
The CoT Week: How Hedge Funds Are Positioned, What Futures Are Foretelling
Following futures positions of non-commercials are as of November 12, 2019.
10-year note: Currently net short 148.8k, down 82.7k.
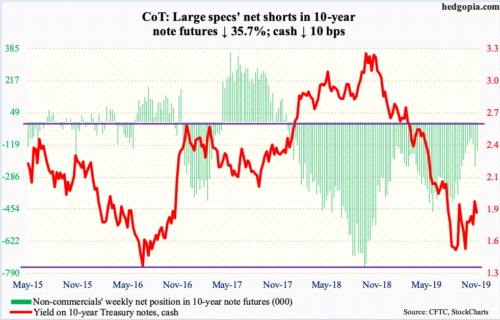
TLT (iShares 20+ year Treasury bond ETF) peaked at $148.90 on August 28, ending the week at $137.76. Since that peak through Wednesday this week, the ETF attracted $1.7 billion (courtesy of ETF.com). Bond bulls apparently treated the selloff as an opportunity to add – wrongly, one might add. From that high, TLT then dropped all the way to $134.45 set on Thursday last week. Interestingly, longs used the latest rally to cut back. In the seven sessions through Wednesday this week, $1.3 billion was withdrawn.
If TLT is rightly capturing investor sentiment, then the 10-year Treasury yield (1.83 percent) could be headed higher in due course. On September 3, rates bottomed at 1.43 percent before progressively setting higher lows. Encouragingly for bond bears, the 10-year rallied to 1.97 percent on the 7th this month, eclipsing the prior high of 1.9 percent from September 13, for a pattern of higher highs. Once again, from bond bears’ perspective, this is positive.
Currently, the 10-year yield is in the process of unwinding its daily overbought condition. The 50-day moving average rests at 1.75 percent. More important perhaps is trend-line support from the early-September low at 1.60 percent. How these support levels get defended will tell us a lot as to if TLT is indeed sending the right signal.
30-year bond: Currently net short 45.4k, down 9.2k.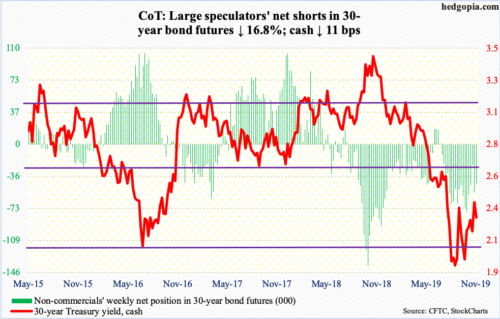
Major economic releases next week are as follows.
- The NAHB housing market index (November) is scheduled for Monday. Builder optimism rose three points month-over-month to 71 in October, matching the reading from February last year. Two months before that, in December 2017, the index hit 74, which was the highest since 75 reached in July 1999.
- Housing starts (October) are due out Tuesday. Starts declined 9.4 percent in September from August’s cycle high 1.39 million units (seasonally adjusted annual rate).
- Wednesday brings FOMC minutes (October 29-30 meeting). The Fed delivered its third straight quarter-point drop in the fed funds rate in that meeting, to a range of 150 to 175 basis points.
- Existing home sales (October) are published Thursday. September was down 2.2 percent m/m to 5.38 million units (SAAR). The cycle high 5.72 million was reached in November 2017.
- The University of Michigan’s consumer sentiment index (November, final) is on tap Friday. Preliminarily, sentiment rose two-tenths of a point m/m to 95.7. Except for August’s 89.8, it has been north of 90 since November 2016, four of them 100 or higher.
WTI crude oil: Currently net long 596k, up 37.3k.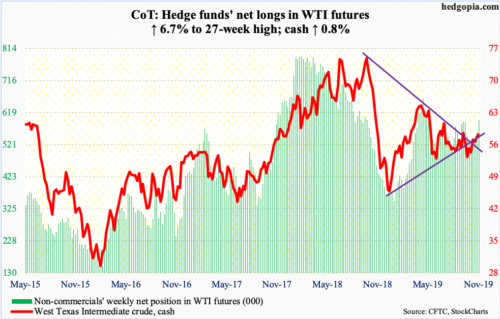
After remaining unchanged for five weeks at 12.6 million barrels per day, crude production rose 200,000 bpd in the week to November 8 to 12.8 mbpd – a new record. The EIA report also showed crude stocks increased 2.2 million barrels to 449 million barrels. Gasoline stocks rose as well – up 1.9 million barrels to 219.1 million barrels. Distillate stocks, however, dropped 2.5 million barrels to 116.7 million barrels. Crude imports fell 327,000 bpd to 5.8 mbpd – the lowest since March 1994. Refinery utilization grew 1.8 percentage points to 87.8 percent.
In the nine sessions through Thursday, the cash ($57.72/barrel) faced difficulty at its 200-day ($57.35), rallying past the average intraday, but unable to close. The streak was broken Friday, albeit not by a whole lot. In the meantime, several weekly indicators are right at/near the median. The RSI (53), for example, has turned back down from just north of 50 in the past five months, so worth watching.
E-mini S&P 500: Currently net long 10k, up 10.1k.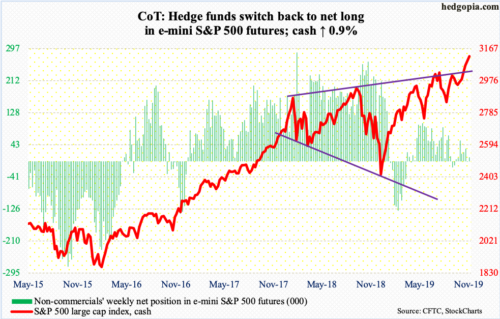
The breakout from 3020s three weeks ago is yet to meaningfully attract flows. In the week to Wednesday, SPY (SPDR S&P 500 ETF), VOO (Vanguard S&P 500 ETF) and IVV (iShares Core S&P 500 ETF) lost a combined $2.5 billion (courtesy of ETF.com). In the same week, US-based equity funds gained $1.8 billion (courtesy of Lipper). Lipper also showed money market funds took in another $18.4 billion.
The cash (3120.46) nevertheless managed to rally another 0.9 percent this week – its sixth positive week in a row. Both Wednesday and Thursday, bulls bought intraday weakness at/near the 10-day, resulting in Friday’s mini-breakout. The average is still rising, as is the 20-day. Momentum remains with the bulls.
Euro: Currently net short 57.7k, down 3.1k.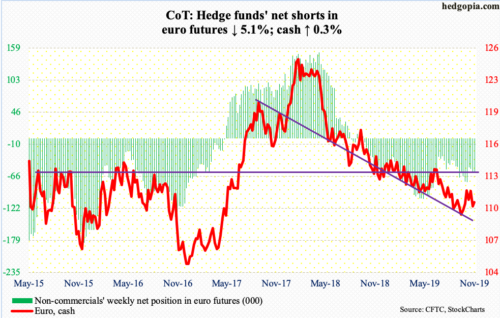
The cash ($110.55) opened the week with an attempt to recapture the 50-day, but to no avail. It then proceeded to drop along the lower Bollinger band, pushing the daily into oversold territory. On November 1, the euro retreated after tagging $111.82 intraday. Thursday, it made a low of $109.92. before drawing bids. There is support at $110, and it is holding. The 50-day ($110.41) was reclaimed Friday.
Gold: Currently net long 267.1k, down 12.8k.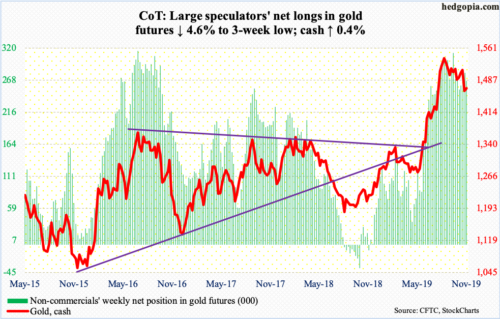
In the week to Wednesday, IAU (iShares Gold Trust) saw no activity whatsoever. This preceded inflows of $3 billion in the prior 17. GLD (SPDR Gold ETF) in the same week lost $262 million (courtesy of ETF.com).
Last week, the cash ($1,468.50/ounce) fell out of a one-month, slightly-rising trend-line support. A couple of sessions before that, gold was rejected at a falling trend line from September 4 when it peaked at $1,566.20. Both these developments were negative and could have led to further breakdown if not for this week’s action.
Early August, gold broke out of horizontal resistance at $1,440s-50s. This week, the breakout was defended. Intraday Tuesday, gold dropped to $1,446.20. Odds of a rally near term have grown, if nothing else just to unwind the daily oversold condition.
Nasdaq 100 index (mini): Currently net long 39.9k, down 1.3k.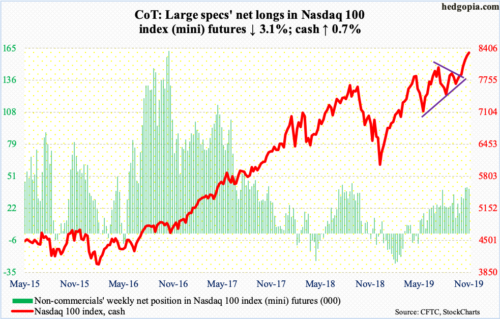
In the week to Wednesday, QQQ (Invesco QQQ Trust) drew $1.3 billion (courtesy of ETF.com). In the prior two, $2 billion came in.
The cash (8315.52) broke out three weeks ago, then went sideways the past several sessions, before staging a mini-breakout Friday. From October 3 through Friday, the Nasdaq 100 rallied north of 11 percent. This is yet to be digested in earnest. This can either be done through time or price. The consolidation the past several sessions is not sufficient. The daily in particular remains grossly overbought, with the RSI over 71. Bulls would take it, though. They were able to squeeze shorts in October, with Nasdaq short interest dropping 1.1 percent last month (more here). It is possible more of this took place Friday.
Russell 2000 mini-index: Currently net short 7.4k, down 3.6k.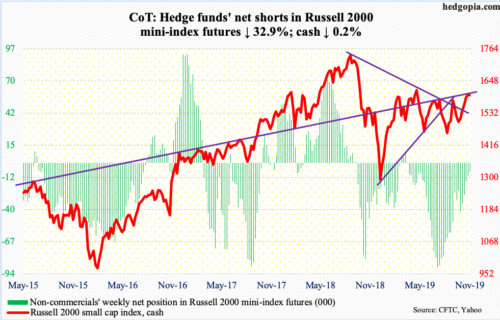
Last week, the cash (1596.45) rallied 0.6 percent for five up weeks in a row, but the week also produced a weekly long-legged doji. This week, it fell 0.2 percent. Despite repeated attempts, small-cap bulls were unable to reclaim 1600-plus, which goes back to January last year. Particularly since February this year, this was the fourth time this price point repelled breakout attempts. Bulls also lost a rising one-month trend line this week. Until they are able to decisively recapture 1600, it is hard to get convinced they have staying power.
Flows were positive this week, but this was not enough. In the week to Wednesday, IWM (iShares Russell 2000 ETF) and IJR (iShares Core S&P Small-Cap ETF) respectively gained $308 million and $28 million (courtesy of ETF.com). This followed inflows of $844 million and $10 million in the prior week.
US Dollar Index: Currently net long 27.8k, down 595.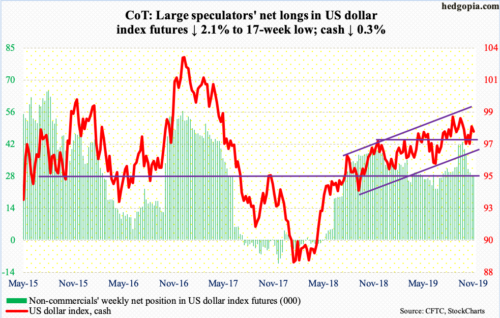
It seems the cash (97.87) for now wants to remain bound by the 50- and 200-day. Early this month, dollar bulls defended the 200-day (97.27) after a slight breach intraday. By Friday last week, it had reclaimed the 50-day (98.01). All good, except bulls this week were not able to build on this. The 50-day was lost Friday. Nearest support lies at 97.50s.
VIX: Currently net short 206.2k, up 2.6k.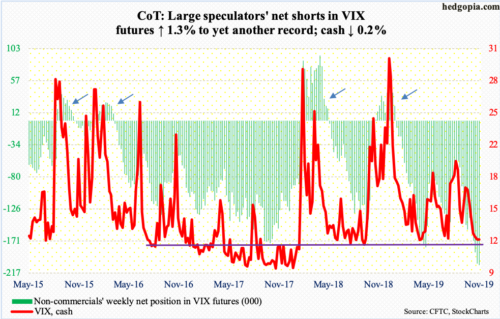
Non-commercials’ net shorts rose to yet another record. The cash (12.05) was essentially flat this week. Friday’s intraday low of 11.92 was the lowest since July 25. The way these traders are positioned, they seem confident VIX breaks support at 12, toward 10-11. VIX has not broken 10 since January last year. In the very near term, the daily can head lower. Medium- to long-term, the cash historically does not peak until these traders either go net long or have substantially cut back their net shorts (arrows in chart).
Elsewhere in the options market, equity bulls continue to snort. Thursday, the CBOE equity-only put-to-call ratio printed 0.47, followed by 0.49 on Friday. The 21-day moving average ended the week at 0.604; historically, the ratio tends to bottom at high 0.50s to low 0.60s. Come Monday, it is all but certain the ratio enters high 0.50s. Once the process of unwinding begins and the ratio rises, stocks go the other way.


