The Bull Is Tired, Without Great Sentiment And Lacking Volume, But…
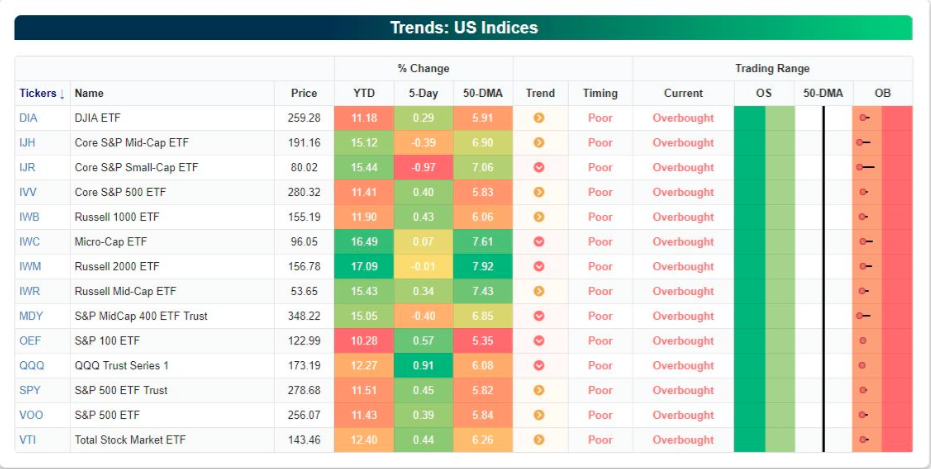
Leading up to the Friday trading session last week, the markets appeared to be expressing exhaustion and have been with overbought conditions for the better part of the last 10 trading sessions. Nonetheless, the YTD rally carried forward on Friday. (Table from Bespoke Investment Group)
From Monday through Thursday, the S&P 500 (SPX) and its peer indices sold-off into the closing bell. Even with a rally on Friday, the Dow Jones Industrial Average (DJIA) finished lower for the week as the transports began to break trend. When it was all said and done for the week, the Dow slipped 0.02%, ending its winning streak at nine weeks. The Nasdaq rose 0.9% and the S&P 500 rose 0.4 percent. With the rally on Friday, the S&P 500 broke and closed above the critical 2,800 level.
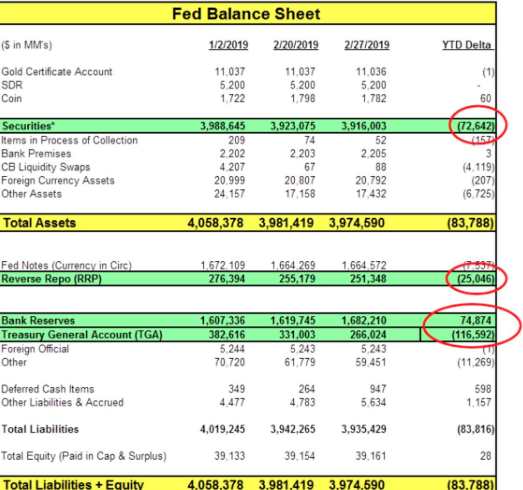
It is undoubtedly true or reasonable to deduce that the rally in global equity markets has largely come on the back of a more dovish Fed, liquidity injections from the Peoples Bank of China (PBOC) and to some degree improved liquidity offsets between the Fed and the U.S. Treasury. With regards to the “offsets”, while the Fed continues to unwind its balance sheet monthly, the Treasury Department is dumpling liquidity into bank reserves. This was exampled again this past week when on Thursday the Treasury Department dumped $60Bn of liquidity into bank reserves and on Friday dumped another $90Bn. What does this mean?
Reserves injected back into the banking system through the liability side of the balance sheet i.e. the Fed, incrementally and temporarily improves Dealer LCR/RLAP Liquidity Coverage Ratios. This enables big reversals of GC Repo rationing process come the end of the fiscal year for the big banks. Visually it looks like this.
The Fed and the U.S. Treasury Department are making life very difficult for the permabear camp in 2019 and at least temporarily. In the coming weeks, the U.S. government will need to raise the debt ceiling and this topic will prove a battleground for legislators. Nonetheless, these liquidity measures don’t necessarily offset overbought conditions and the potential for market exhaustion to result in a retracement in the equity markets. No one variable dominates the market short-term.
It is important to understand that just because markets are overbought and most indicators have reached an extreme level, this doesn’t suggest that the market will all of a sudden die, roll-over or play dead. It is a warning sign that suggests further upside in the market is statistically limited compared to the downside risk. In other words, historically the market takes a breather when reaching extremes.
- Exhaustion is not necessarily a “sell signal”, as the timing of a market retracement is often unknown and to a great degree demands a catalyst.
- Dow Transports have been lower for 6 trading sessions in a row. This might be the first sign that the market is preparing to turn in the near future.
- Consider the 10-week rally has brought the SPX/DOW up by 11%+ YTD and the Nasdaq is up 14% YTD. It is highly probable that if one was to sell their equity holdings, they are likely to be able to recapture certain equities at lower prices and/or not miss out on much more gains in 2019. In other words, if the market rally persists in 2019, it is highly probable that it won’t happen with the markets going up in a straight line.
- When the markets have become this over extended previously, it has generally been a better opportunity to reduce portfolio risks/take profits rather than expanding risk.
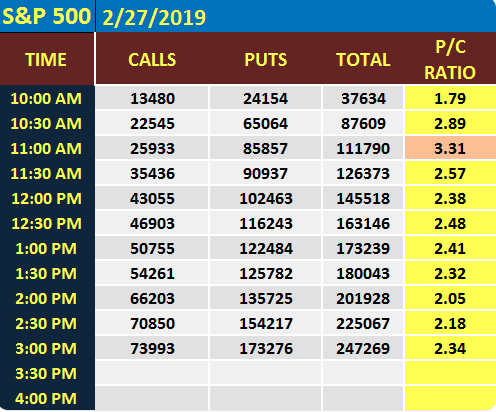
To the idea of expanding risk noted in the last bullet point, this is what is front of mind with portfolio managers and with respect to current market conditions. Most portfolio managers have taken to hedging their long portfolio in the past week. During Wednesday’s trading session, there was stealthy Put buying in the SPX options markets. (See Table Below)
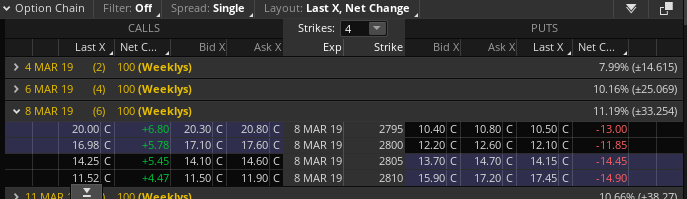
And where else are we seeing de-risking and/or hedging activities on the part of fund managers? Of course we’re seeing it in the VIX options market. The volume inside the VIX options market exploded this past week as shown in the screenshot below. (These were likely on the buy side given the rise in the VIX on Tuesday)
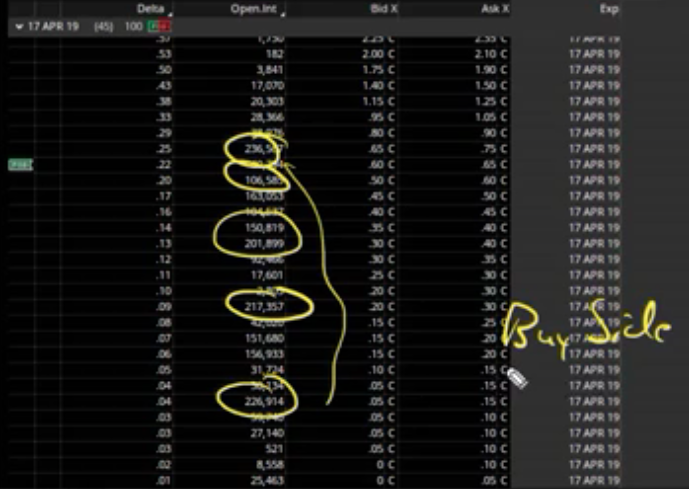
It’s very clear from the options chain that somebody or somebodies are buying huge volume in April VIX call options and giving themselves some duration.
To kind of put a pin in the overextended and market exhaustion conversation let’s recap. Firstly, markets don’t go down in a straight line and markets don’t go up in a straight line. When the markets will pullback is more a guesstimate than anything else. De-risking is taking place as fund managers install hedges.
Economic Data Still Uncertain
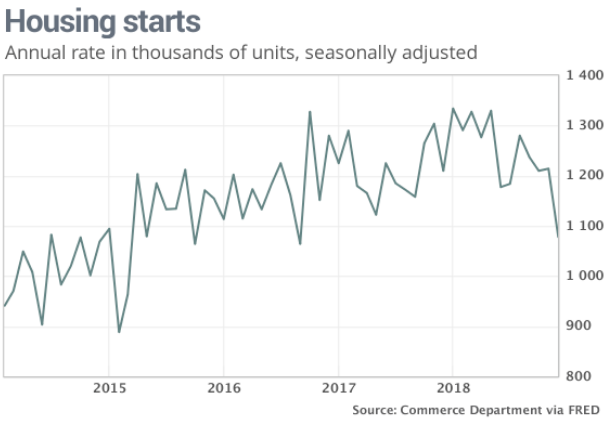
Again last week, investors were confronted with a mixed bag of economic data. Housing Starts dropped 11% MoM and to a 2-year low while building permits actually rose .3 percent.
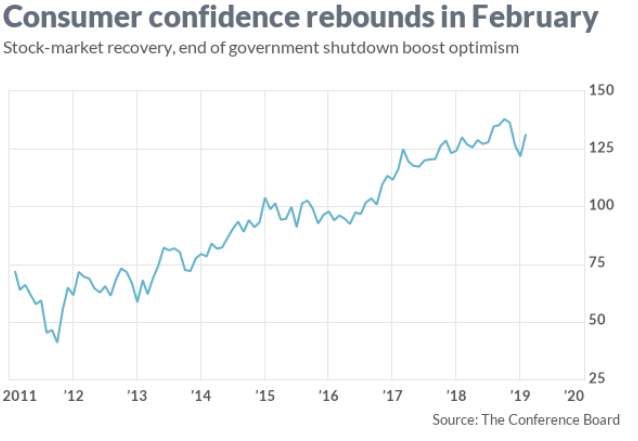
But where Housing starts disappointed investors, Pending Home sales rose 4.6% MoM and rather unexpectedly. Unfortunately, the MoM rise didn’t offset the 2.3% decline YOY, but Consumer Confidence did settle the markets during the week. The consumer confidence index climbed to 131.4 this month from a revised 121.7 in January, the Conference Board said Tuesday.
The doozy of the economic data points last week had to be the hotly contested and preemptively lowered Q4 2018 GDP estimates. Gross domestic product, the official scorecard for the economy, grew at a 2.6% annual pace in the fourth quarter, the government said Thursday.
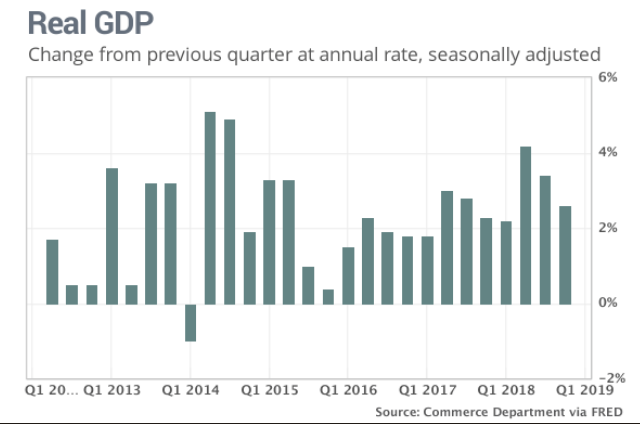
The U.S. had expanded at a lusty 3.4% clip in the 2018 third quarter and 4.2% in the second quarter. Keep in mind that the government is reporting QoQ GDP results and not annualized. The YoY Q4 GDP growth was up 3.1% in 2018. Consumer spending, the main engine of the economy, increased a healthy 2.8% in the fourth quarter, but decelerated from the previous quarter’s 3% growth. Households didn’t spend as much as they did in the previous two quarters, but it was more than enough to keep the economy on a steady keel. Businesses investment, meanwhile, was stronger than expected. Companies invested more in equipment and product research, offsetting another decline in spending on structures such as drilling rigs or office buildings.
Looking at all the other times GDP was >3% (since 1980), the following year saw the S&P 500 higher 13 of the past 14 times.
Two last considerations with regards to the economic data of the week. The first one comes from what found the markets giving up ALL of their respective gains on Friday. The Dow was up more than 200 points by 10:00 a.m. EST but fell into negative territory shortly after the ISM manufacturing index data was released.
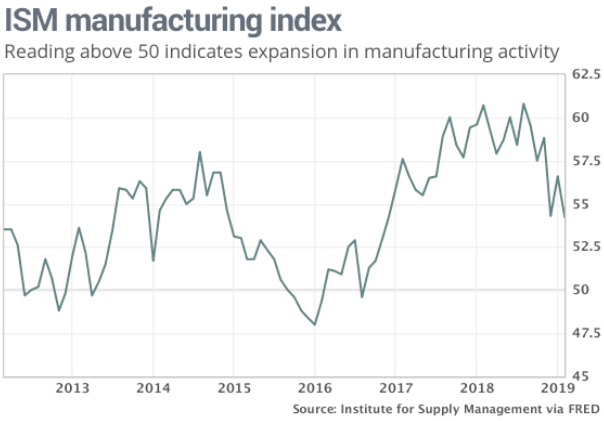
The Institute for Supply Management said its survey of top manufacturing executives fell to 54.2% last month from 56.6% in January. Economists had forecast the index to total 55.5 percent. The index for new orders dropped 2.7 points to 55.5%, with production falling a steeper 5.7 points to 54.8 percent. Employment slipped 3.2 points to 52.3%, also the lowest in two years. But, within the ISM data was the line item for customer inventories that were at "low levels". This usually points to a rebound in the overall ISM data near-term.
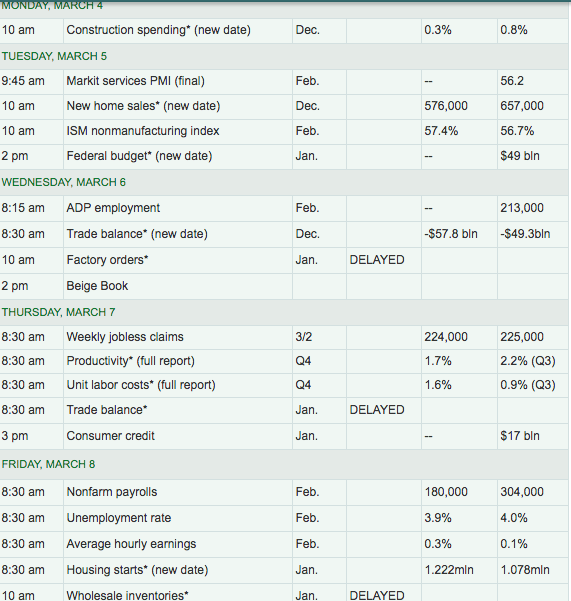
My final point on economic data draws upon the current week. Here is a table of economic data to be delivered, highlighted by the release of February’s Nonfarm Payroll report. MarketWatch is anticipating that the economy grew Nonfarm Payrolls by roughly 180,000 during the month of February. The all-important wage inflation data will be released alongside the Nonfarm Payroll data. Recall that the inflation data kicked off the market pullback in February of 2018. To be aware is to be prepared!
Above 2,800, but Q1 EPS Forecast Worsening WoW
While certain market participants cry foul of the market’s rebound in 2018, the forward 12-month P/E ratio is still a reaonable16.2, if you believe in the FY19 EPS forecast. The current P/E ratio is below the 5-year average of 16.4, but above the 10-year average of 14.7. It is also above the forward 12-month P/E ratio of 14.4 recorded at the end of the fourth quarter (December 31). Since the end of the fourth quarter (December 31), the price of the index has increased by 11.1%, while the forward 12-month EPS estimate has decreased by 1.2 percent. This is usually resolved with a lesser valuation near-term.
According to FactSet data, the S&P 500 is expected to express an earnings recession in Q1 2019.
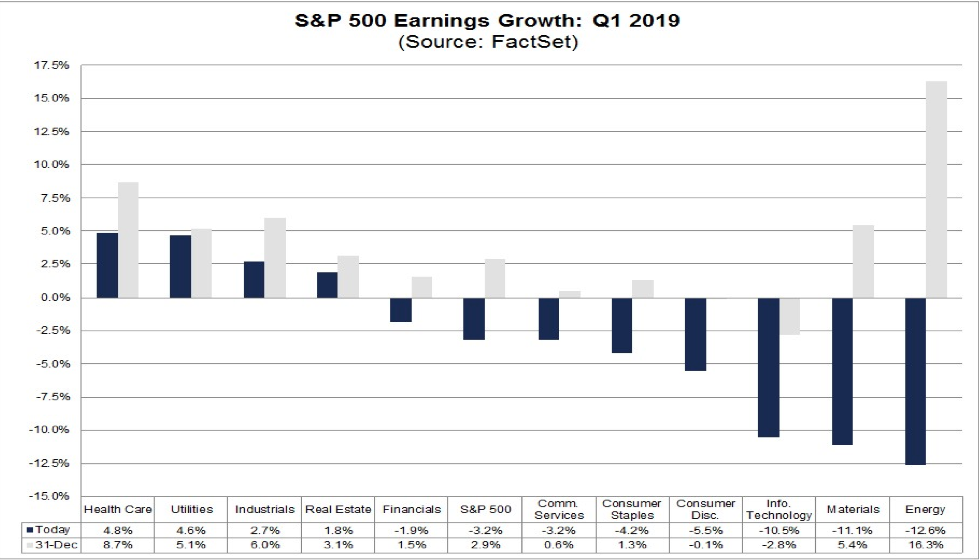
- For Q1 2019, analysts are projecting a decline in earnings (-3.2%) and revenue growth of 5.2%.
- For Q2 2019, analysts are projecting earnings growth of 0.3% and revenue growth of 4.8%.
- For Q3 2019, analysts are projecting earnings growth of 1.9% and revenue growth of 4.6%.
- For Q4 2019, analysts are projecting earnings growth of 8.5% and revenue growth of 6.2%.
- For CY 2019, analysts are projecting earnings growth of 4.1% and revenue growth of 5.1%.
- Q1 2019 EPS estimates have declined by .5% from the previous week.
Themes & Sentiment Priced In?
With earnings growth expected to come in at roughly 4% for the year, much of the annual gains may already reflect some of the more positive themes for 2019. Those themes include a Fed pivoting from hawkish with rate hikes to dovish with no rate hikes. Keep in mind that in the month of March, the Fed will release their dot-plot chart forecasting rate hikes or the lack thereof.
Another theme in the bullish market sentiment is that the market may have already priced in a near-term trade deal between the U.S. and China. Ultimately, the market needs to see some improvement in the Chinese economy going forward. New loans in China surged to a record high in January and analysts say it could be a sign that government stimulus is “finally kicking in,” which may be good news for the economy.
Jian Chang, chief economist for China at Barclays, said that credit has expanded “quite significantly” and she expects economic growth to pick up in the second-quarter, after bottoming out in the current first quarter.
Such a scenario depends on “more policy easing from the Chinese government,” Chang told CNBC on Tuesday, a view echoed by other economists who say the government will likely accelerate stimulus to boost economic growth.
One issue the market has seemingly ignored throughout the surge in valuations and since the New Year is Brexit. While a new referendum may be in the offering soon enough, market participants seem equally befuddled as to how or when the geopolitical issue will be resolved.
When we discuss the market we have to discuss these geopolitical issues that have economic ramifications, which can either help or hinder corporate earnings. At present, the market may already reflect positive geopolitical outcomes and a dovish Fed that is found to match the dovish central banks from the EU, Japan and China. Nobody can say with absolute certainty what is priced in or out of the market, but history suggests much of the YTD market gains are a result of a positive outlook on the aforementioned topics.
Market Wrap-Up
You’ve probably guessed by now that this narrative desires to find investors and traders respecting how far the market has come and what institutional traders and fund managers are doing, given the aforementioned. Investors are hedging the rally and bracing for a market retracement. It’s uncertain as to how big the retracement will be; it could be as little as .5% or as much as 10 percent. In the new market world order, where algos can wreak havoc on price and price momentum, anything is possible.
Markets and programmed trading find catalysts to break trend and with each passing week catalysts have been absent the main market mantra, "seek and achieve SPX 2,800". With that mantra now achieved the question remains what will be the catalyst to break the market’s momentum. Will it be the Fed’s dot-plot? Will it be the Nonfarm Payroll report? Maybe it will be something beyond investors’ radar. Whatever the catalyst might prove to be, having cash on-hand to take advantage of the next market dip may prove to be “the smart money play”.
For the trading week at-hand, the S&P 500 weekly expected move is still quite small and with respect to minimal market volatility prevailing in 2019, thus far.
The weekly expected move is $33 and slightly higher than the past week. Last week found the S&P 500 closing within the weekly expected move once again, showing price efficiency in the market.
Lastly, but certainly not least, we must continue to monitor the developing forecasts for Q1 2019 GDP. While the Q1 period is typically a weather-sensitive period and found dropping off from the previous quarter’s economic output, the current estimates are increasingly problematic for bulls. Below is the current Q1 2019 GDP forecast from the Atlanta Federal Reserve.
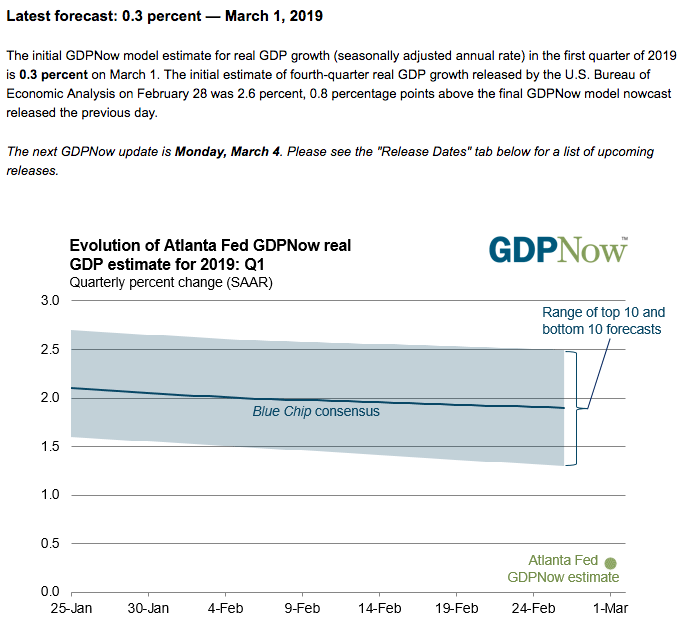
The forecast will undergo weekly revisions, but it is starting from a very low base. Investors will likely continue to be confronted with recession fears until Q1 GDP forecast estimates show some improvement.
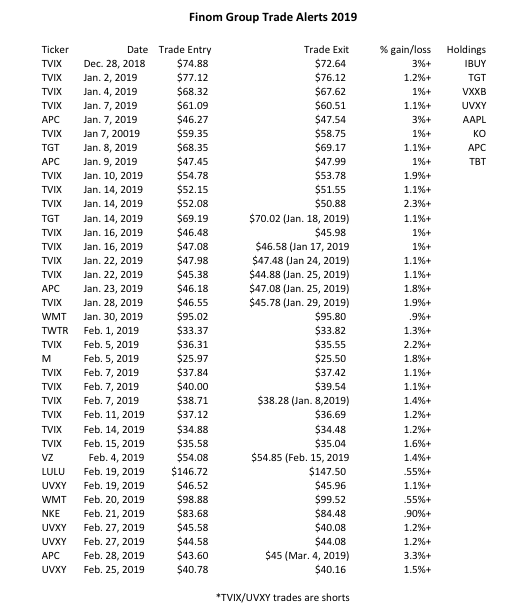
Regardless of what the market may bring near-term, I'll be trading the market and delivering trade alerts at finomgroup.com (for whom I am employed). Check out our holdings and YTD trade alerts below with a greater than 99% hit rate. I still am of the opinion this is a traders' market and demands active portfolio management given the bouts of volatility that may ensue, post the end of the earnings cycle.