
The Bond Market Is Indicating More Upside Potential For Stocks
The stock market has remained in a sideways range over the past several months, and now it seems to be trying to break above its recent highs. In this context, investors have reasons to wonder if the market will finally sustain an upward move to make another push higher or if we are just facing resistance at the top of the trading range.
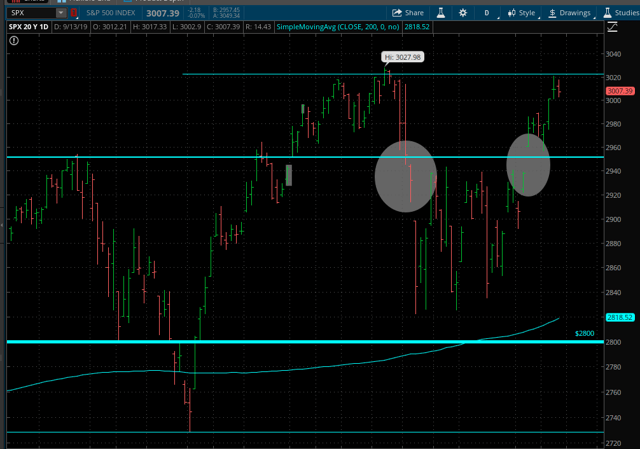
Source: Thinkorswim
Nobody can know for sure what the market will do next, and the future is always a matter of probabilities as opposed to certainties. However, global financial markets are deeply connected, and we can gain some valuable information about the stock market by analyzing the main developments in the bond market.
In simple terms, when bond investors are concerned about the possibility of a recession, they tend to gravitate towards the safety of Treasury bonds. Conversely, when risk appetite is rising in the bond market, investors generally go hunting for higher returns by investing in high yield bonds.
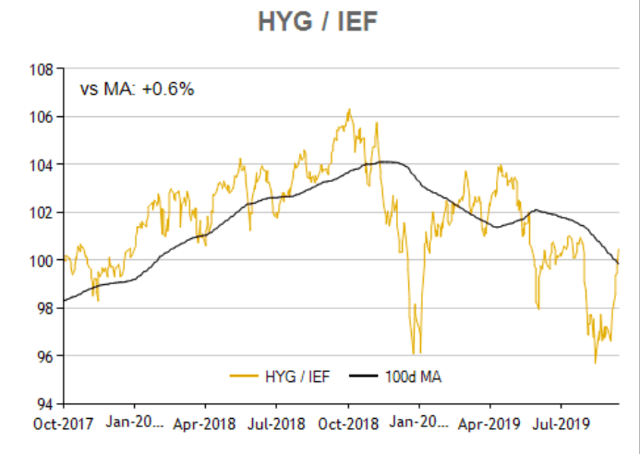
By observing the relationship between the iShares iBoxx $ High Yield Corporate Bond ETF (HYG) and the iShares 7-10 Year Treasury Bond ETF (IEF), we can gain valuable information about the main trends in risk appetite in the bond market, and this has material implications for the stock market.
The signals from the bond market have been rather mixed in recent months, but the data is now looking more bullish for stocks.
Measuring Risk Appetite In the Bond Market
The quantitative system reads the risk appetite levels in the bond market in order to manage risk exposure in the stock market. The main idea is having strong exposure to stocks when credit conditions are favorable and protecting the portfolio when the credit market is providing reasons for caution.
This is done by creating a ratio that measures the relative performance of HYG versus IEF. When this ratio is rising, it means that high yield bonds are outperforming Treasury bonds, so risk appetite is increasing.
Source: ETFreplay
When the ratio is above the 100-day moving average, meaning in risk-on mode, the system is invested in the SPDR S&P 500 Trust ETF (SPY). Alternatively, when the ratio is risk-off mode, the system buys the iShares 20+ Year Treasury Bond ETF (TLT) to protect the portfolio.
The chart shows the backtested performance statistics for the quantitative strategy versus a buy-and-hold position in the SPDR S&P 500 Trust ETF. Since January 2008, the first full year in which all of the ETFs in the system are available for trading, the quantitative strategy gained 422.2% versus a cumulative gain of 161.1% for the SPDR S&P 500 Trust ETF in the same period.
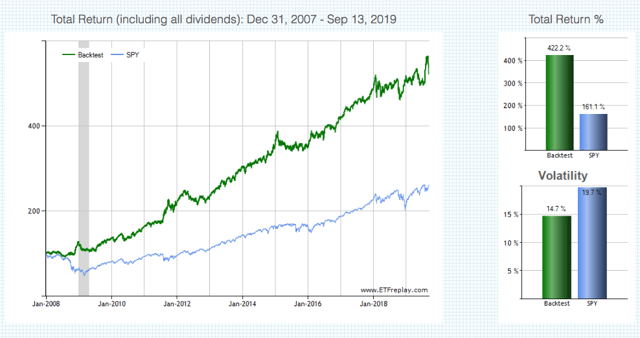
Source: ETFreplay
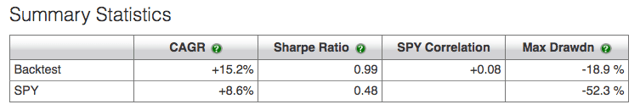
The annual return is 15.2% for the strategy versus 8.6% for SPY. More importantly, the maximum drawdown, meaning the greatest percentage drop from the high, is 18.9% for the quantitative strategy versus 52.3% for buy-and-hold investors in the SPDR S&P 500 Trust ETF over the same period.
The strategy has produced solid returns with moderate risk over the long term, but it's important to understand that future returns will depend on market conditions to a good degree.
In times when treasuries and high yield bonds are moving sideways, the strategy will probably produce many false signals. Besides, when there is a rapid reversal in risk appetite, it will take some time for the strategy to read the signals from the credit market and adjust the portfolio risk.
On the other hand, when there are well-defined trends in risk appetite in the bond market, either up or down, the quantitative strategy should be able to do a solid job at capturing these trends and benefitting from them.
Reading The Data
Going back to the signal line in the quantitative model, we can see that it has been in a risk-off mode for long periods of time this year, but it recently turned bullish on stocks. This undecisive trend in the ratio makes sense in a period in which stocks are going through a choppy and lateral phase, but it's important to analyze the two different components in the strategy in order to build a more complete picture.
Source: ETFreplay
The main reason why the HYG/IEF ratio has declined during some months in 2019 is that IEF has been very strong. HYG has also performed well in 2019, and it's currently trading near its highs of the past several months, but HYG has still lagged IEF in the past 12 months.
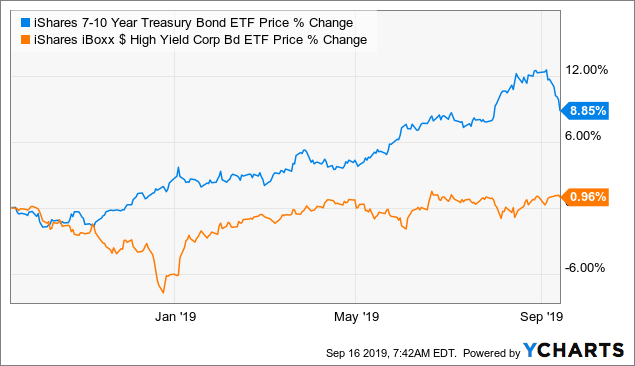
Data by YCharts
The stock market can continue doing well in times when treasuries are rising - the big problem for the stock market generally happens when credit spreads start increasing. In other words, if the HYG/IEF line declines due to increasing credit spreads, this is a major red flag, but not so the line declines because of surging treasuries.
The chart below shows how the S&P 500 and credit spreads have evolved over the past decades, with shaded areas signaling recessions. The deepest bear markets in recent decades have been observed in periods when credit spreads were surging and the economy was also entering a recession.
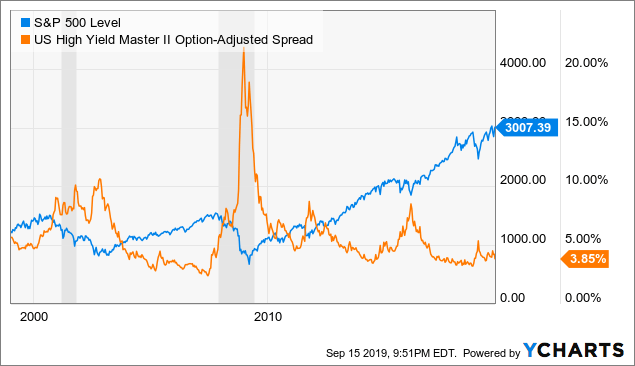
Data by YCharts
In an article in March covering this same strategy, I explained that the strategy was in risk-off mode, but mostly because Treasury bonds were surging. High yield bonds, on the other hand, remained quite strong, with credit spreads showing a high appetite for risk among high yield investors.
Based on the historical data, stocks tend to do well when credit spreads are low, even if treasuries are rising. From the article:
The surge in Treasury bonds is a relevant trend to monitor going forward, but the big game-changer when it comes to risk appetite in credit markets is high-yield spreads. If those spreads remain subdued, chances are that any pullback in stocks should be moderate.
This has, in fact, been the case over the past several months. If we take a look at high yield credit spreads, there was an increase in January 2019, but spreads still remained well below the prior highs from 2016. Through the rest of the year, high yield credit spreads have been steadily declining.
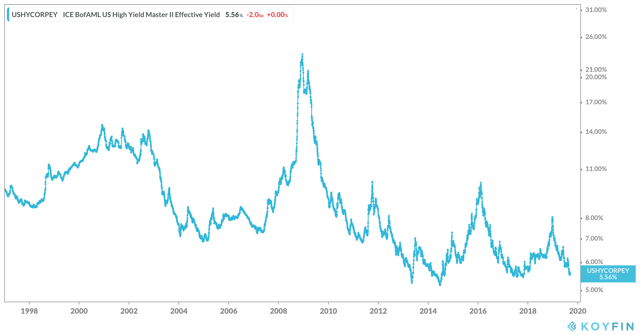
Source: Koyfin
While rising Treasury bonds have been reflecting some concerns from investors regarding the economic slowdown, the fact that credit spreads have remained quite low in recent months is a clear sign of healthy risk appetite among bond investors. Even better, with the recent pullback in Treasury bonds, the strategy is now back in risk-on mode.
No investment strategy, quantitative or discretionary, can be expected to provide the right signals on every occasion. Besides, the signals can change very rapidly in times of elevated volatility.
That being fully acknowledged, bonds are an important piece of evidence when it comes to analyzing the risk environment for the stock market from a multi-asset perspective. Based on the latest data, the bond market is sending a bullish signal for stocks over the middle term.
Disclaimer: I wrote this article myself, and it expresses my own opinions. I am not receiving compensation for it. I have no business relationship with any company whose stock is mentioned in ...
more

