
The Bigger Picture
Today, I wanted to take a look at the bigger picture and consider certain trends we may see over the next decade. Jim Puplava from Financial Sense thinks the next decade may favor tangible assets and commodities, I agree.
I think deflationary pressures are waning and we are transitioning into an inflationary period. Major asset shifts like this need time. It often takes a year or more before the new trend emerges. The more I look at the charts, the more I think commodities are forming significant bottoms, perhaps multi-year or even multi-decade lows.
First, let’s look at the DOW/CRB ratio. Paper assets performed well over the last several years…commodities not so much. It is evident in the chart below that commodities are incredibly undervalued when compared to stocks. I think various commodities are basing, some leading, some lagging, but as a whole, they are ALL likely basing. Once the bottoming process is complete commodities may enter a multi-year bull phase outperforming stocks.
(Click on image to enlarge)

Next, let’s look at the Dollar. I’ve heard bearish and bullish arguments. Frankly, I see potential in both. So, let’s look at the monthly chart to draw some conclusions.
US DOLLAR MONTHLY - I found what appears to be an alternating 16-year cycle between tops and bottoms. If correct, then the Dollar may have formed a multi-year peak at the beginning of 2017. Breaking the 2018 low (88.15) would confirm a dollar bear market and promote a multi-year run in commodities. If the next inflationary period in commodities is similar to what occurred between 2000-2010, then various assets will take turns as the “hot” sector. The secret to making a boatload is figuring out where “hot money” is concentrating and get in before prices explode. Recall the rise in crude oil between 2007 – 2008? Prices rallied from $50 – $140+ in 16-months. Silver ran from $9.00 to $49.00 in a little over 2-years. The blowoff phase of a parabolic run is always the strongest and most profitable.
(Click on image to enlarge)

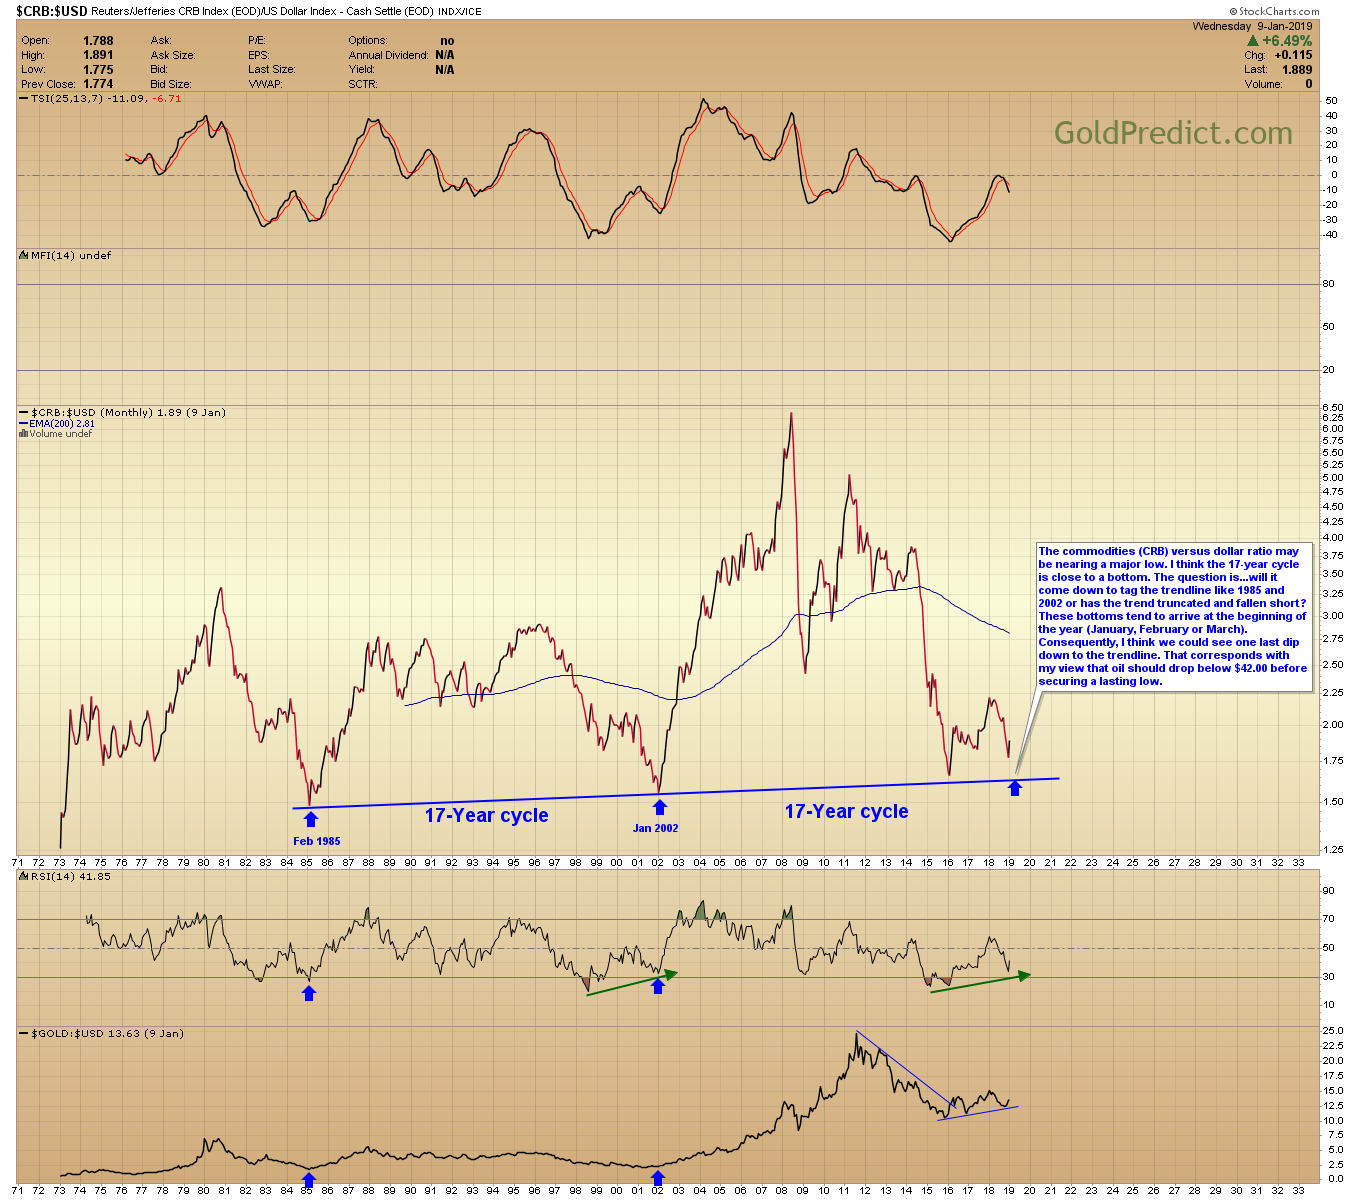
COMMODITIES VERSUS THE DOLLAR - The commodities (CRB) versus dollar ratio may be nearing a major low. I think the 17-year cycle is close to a bottom. The question is…will it come down to tag the trendline like 1985 and 2002 or has the trend truncated and fallen short? These bottoms tend to arrive at the beginning of the year (January, February or March). Consequently, I think we could see one last dip down to the trendline. That corresponds with my view that oil should drop below $42.00 before securing a lasting low.
(Click on image to enlarge)
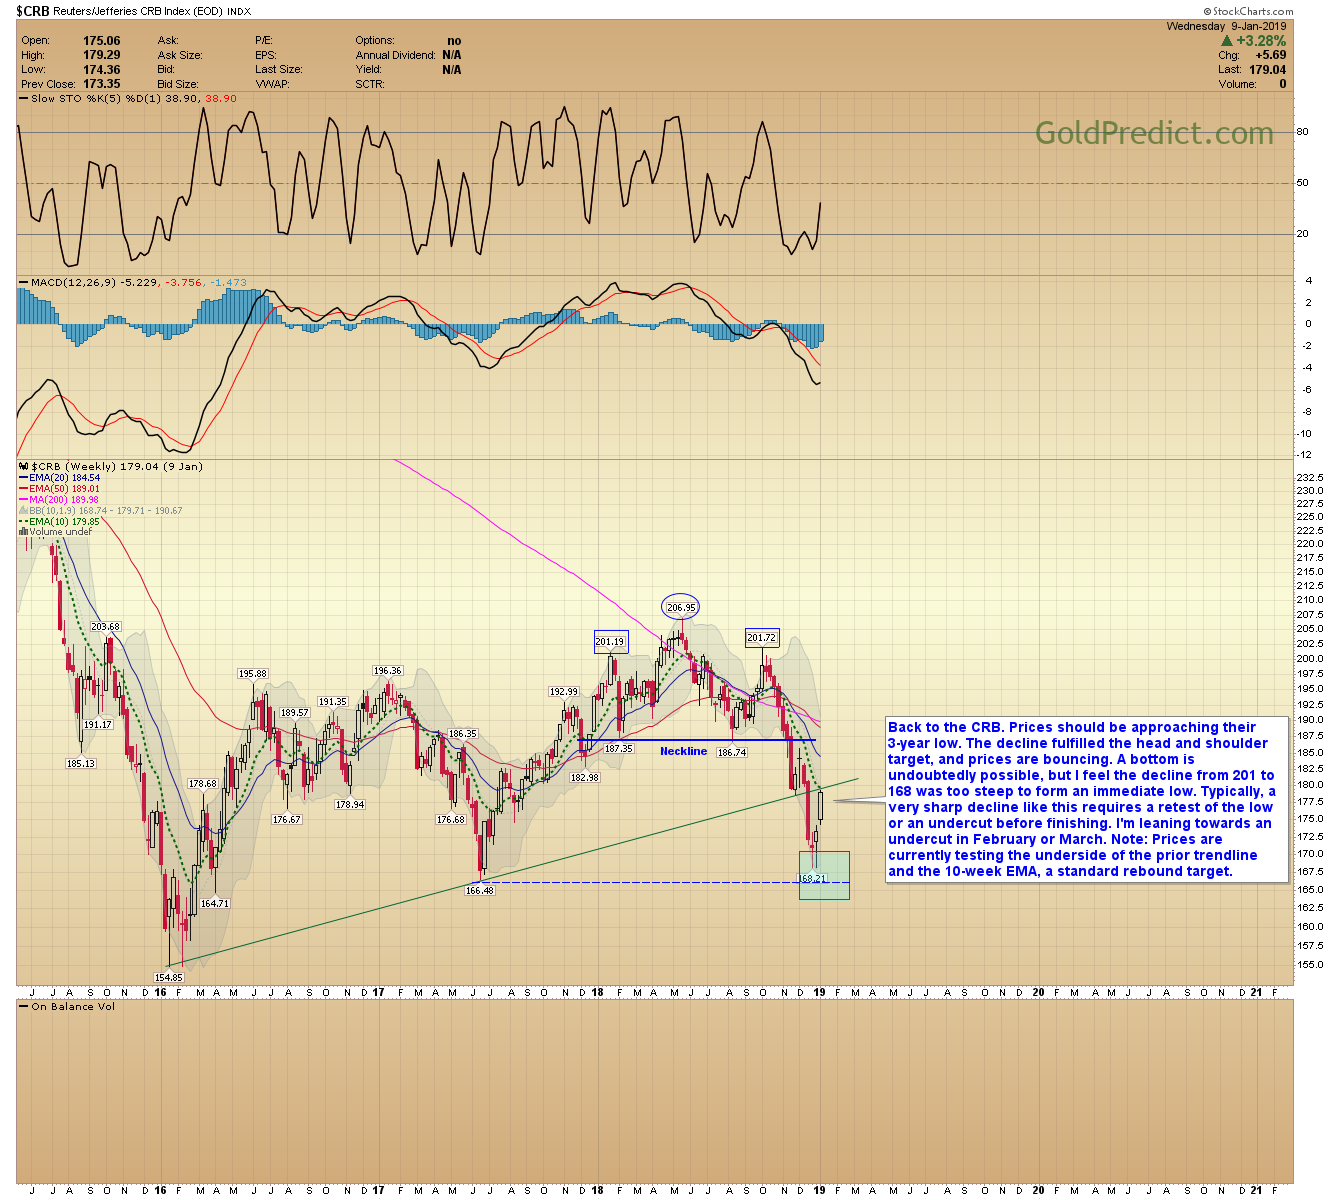
CRB WEEKLY - Back to the CRB. Prices should be approaching their 3-year low. The decline fulfilled the head and shoulder target, and prices are bouncing. A bottom is undoubtedly possible, but I feel the decline from 201 to 168 was too steep to form an immediate low. Typically, a very sharp decline like this requires a retest of the low or an undercut before finishing. I’m leaning towards an undercut in February or March. Note: Prices are currently testing the underside of the prior trendline and the 10-week EMA, a standard rebound target.
(Click on image to enlarge)
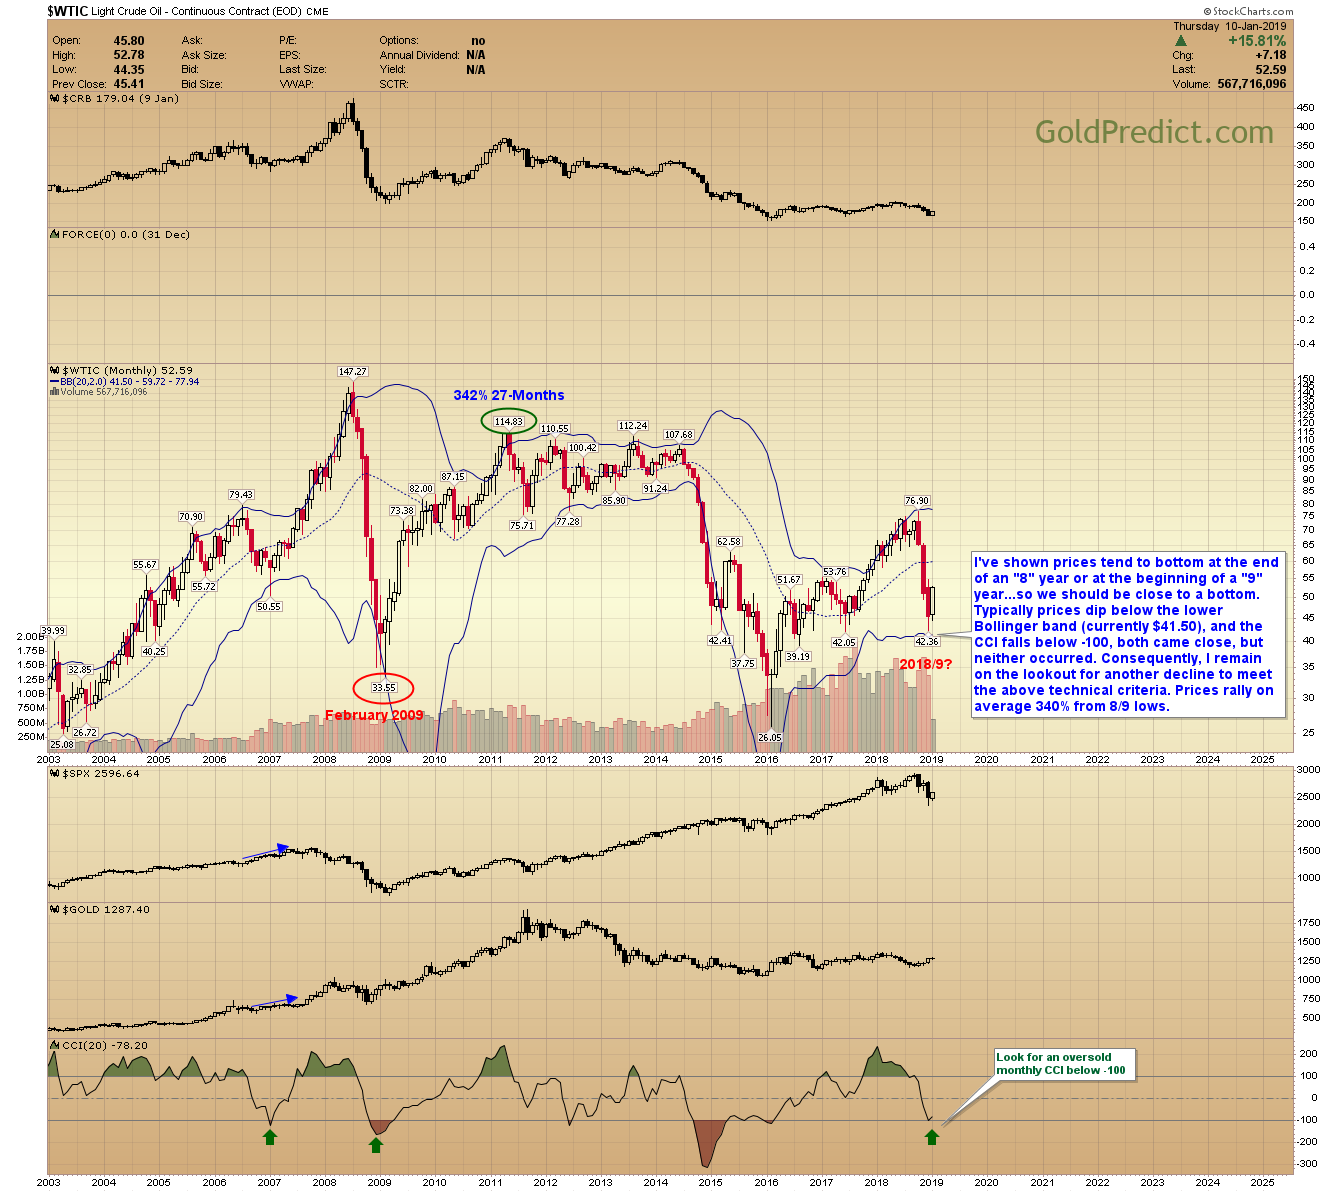
OIL MONTHLY - I’ve shown prices tend to bottom at the end of an “8” year or at the beginning of a “9” year…so we should be close to a bottom. Typically prices dip below the lower Bollinger band (currently $41.50), and the CCI falls below -100, both came close, but neither occurred. Consequently, I remain on the lookout for another decline to meet the above technical criteria. Prices rally on average 340% from 8/9 lows.
(Click on image to enlarge)
WTIC WEEKLY - Buyers bought into support around $42.00. The weekly chart is now testing the underside of the 200-week and 10-period moving averages, as well as the mid-point of the prior consolidation. Oil would have to close progressively above the 20-week MA to support a more meaningful bottom. Otherwise, I’ll look for prices to consolidate and then dip to new lows in February or March.
(Click on image to enlarge)

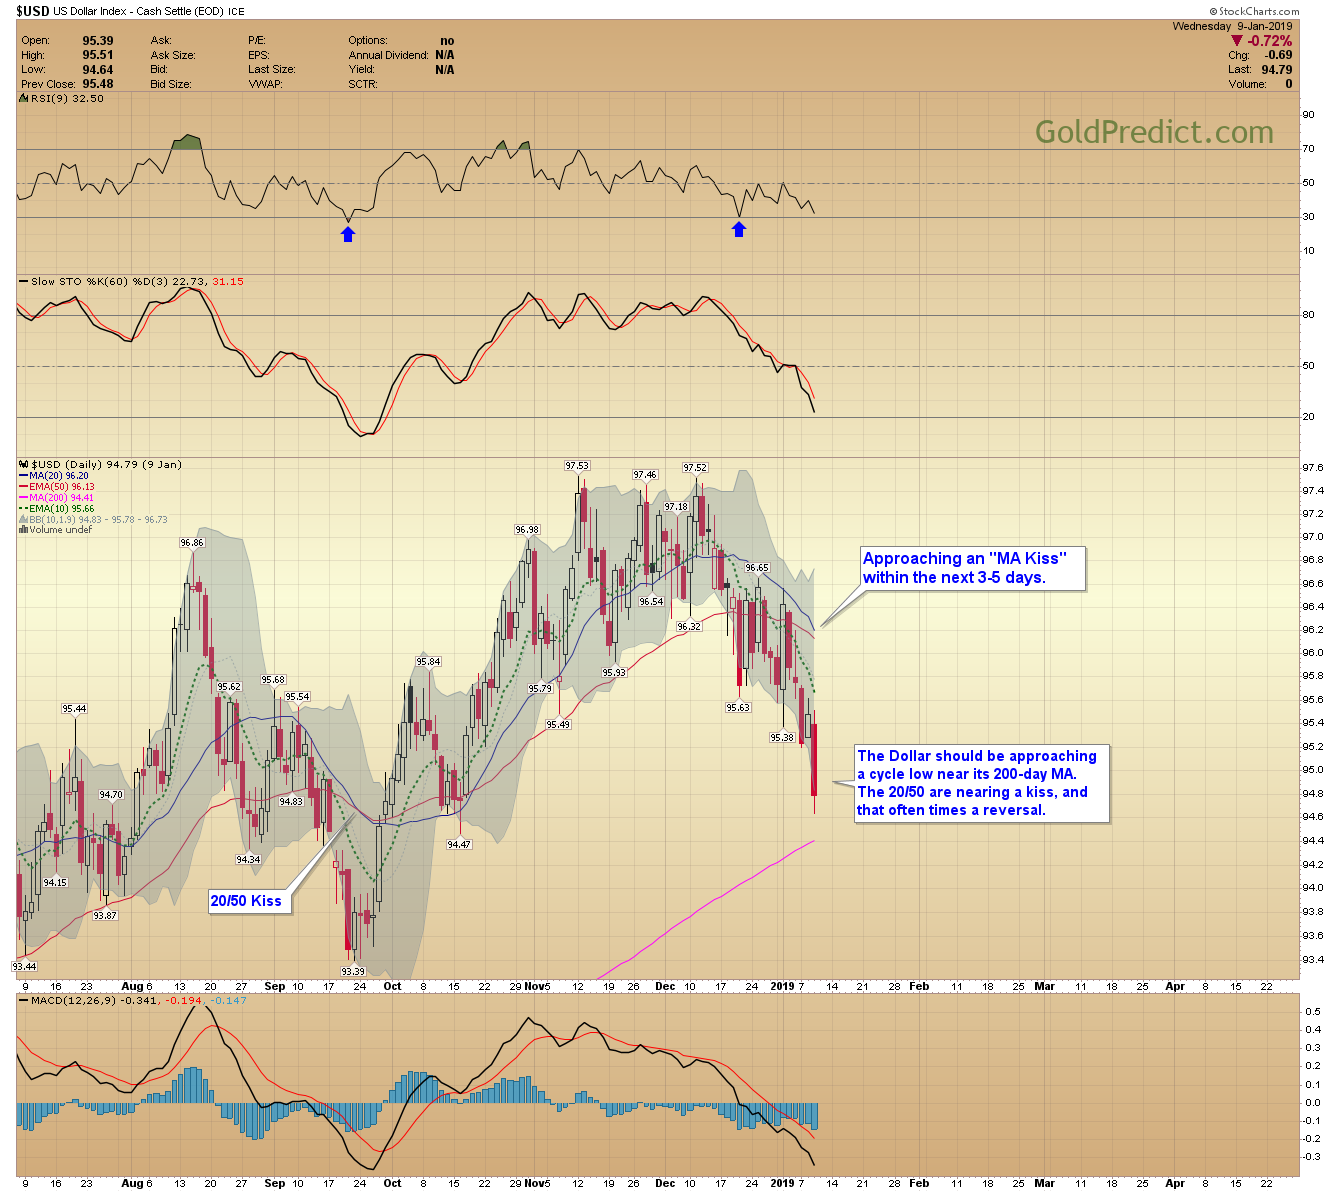
US DOLLAR - The Dollar should be approaching a cycle low near its 200-day MA. The 20/50 are nearing a kiss, and that often times a reversal.
(Click on image to enlarge)
GOLD - Still no swing high after last weeks bearish engulfing candle. Prices are consolidating. Gold needs to form a swing high or close progressively below the 10-day EMA to establish a top. Big picture – I think prices are working on a massive base that will ultimately lead to a multi-year up phase (see next chart).
(Click on image to enlarge)

GOLD WEEKLY - I think a massive base is building and at some point gold will break free and begin to trend. Commodities have been deflating. Paper assets were the place to be from 2009 to now. I think between 2019 and 2020 commodities will transition into the next outperforming assets. The switchover period is often rough and sometimes takes longer than we like. But I think investors that accumulate precious metals at these levels will be pleased 3-5 years down the road.
(Click on image to enlarge)

SILVER - Silver is still consolidating. It looks like it could have one more thrust higher, but I’m not sure. Closing progressively below the 10-day EMA will register a top.
(Click on image to enlarge)

GLD/SLV RATIO - The GLD/SLV ratio crossed back above the 5-period EMA, that often signals a top in metals and miners. Usually silver ends with a quick blowoff. We didn’t see that this time, so I’m not convinced prices peaked. Furthermore, the SLV chart (below) looks like it’s building a small bull flag. It would be unusual to see a top created from a flag.
(Click on image to enlarge)

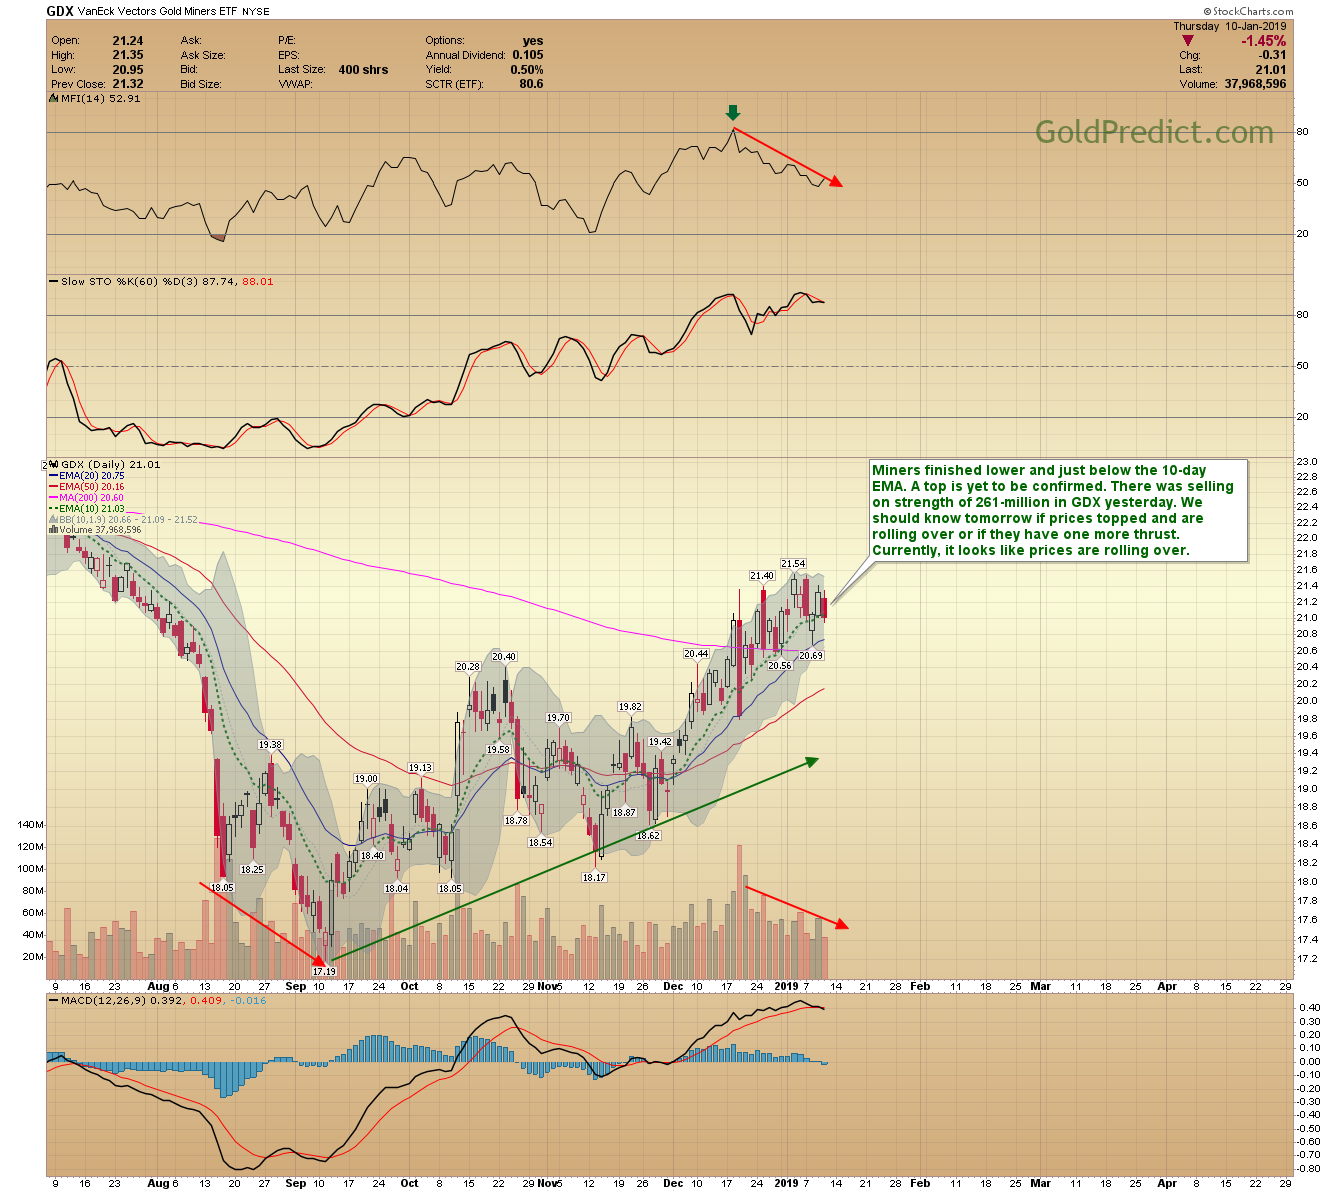
GDX - Miners finished lower and just below the 10-day EMA. A top is yet to be confirmed. There was selling on strength of 261-million in GDX yesterday. We should know tomorrow if prices topped and are rolling over or if they have one more thrust. Currently, it looks like prices are rolling over.
(Click on image to enlarge)
GDXJ - I thought prices would break higher from the consolidation with silver, but now I’m not so sure. Downside follow-through tomorrow would support a top and 1-2 week pullback.
(Click on image to enlarge)

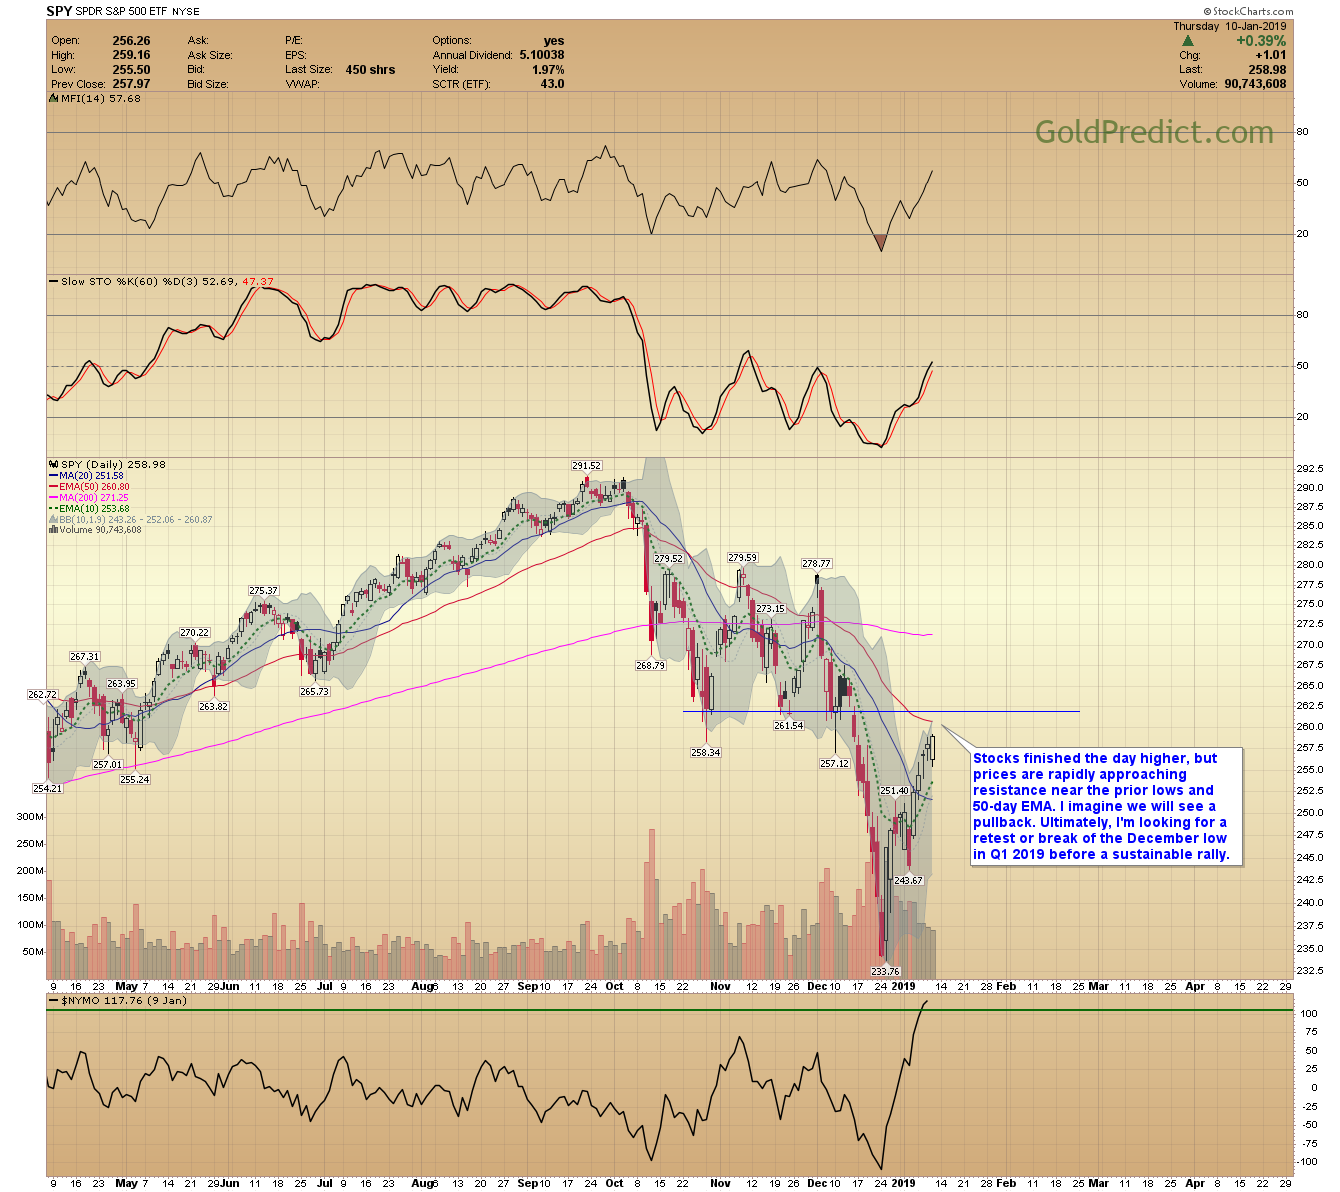
SPY - Stocks finished the day higher, but prices are rapidly approaching resistance near the prior lows and 50-day EMA. I imagine we will see a pullback. Ultimately, I’m looking for a retest or break of the December low in Q1 2019 before a sustainable rally.
(Click on image to enlarge)
I’ll keep an eye on the action overnight and update in the AM. If I see evidence of a top in metals and miners, I’ll look to short for a quick 1-2 week swing trade.
Disclosure: None.


