
The Agony And The Ecstacy Of The Stock Market Outliers
This past week, we saw the market peak in some areas, while others look more like a healthy correction in the works.
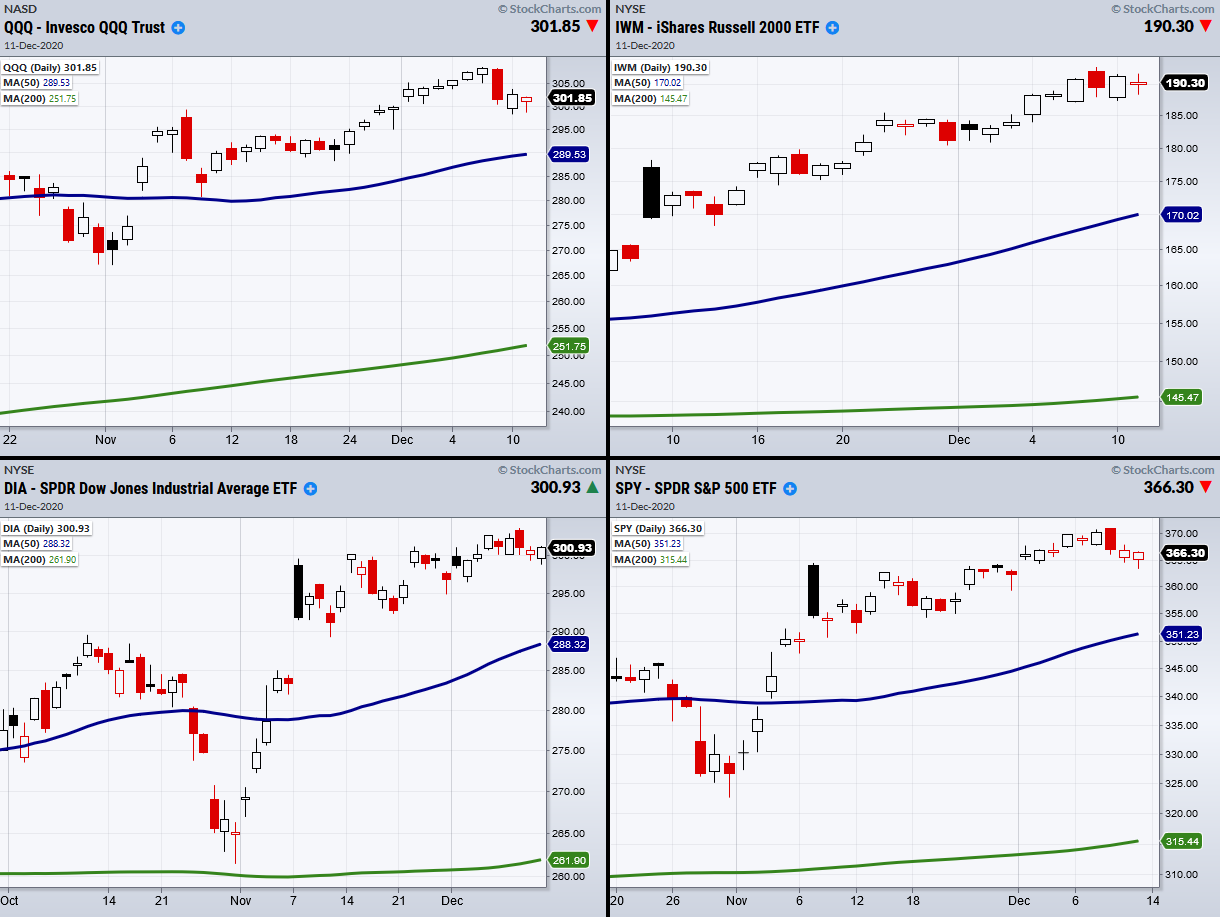
The weakest area and one that we wrote about last Wednesday is the reversal top in the Nasdaq 100 (QQQ).
The formation in the NASDAQ is textbook. QQQs made a new all-time high and the next day had more than a 2% sell-off on huge volume.
And although the week ended with QQQs holding a key support area-300-the overall formation is there and will continue to be there until or unless the QQQs take out the all-time high print.
This could mean we see a move lower isolated to NASDAQ and not in the other indices as QQQs were the only real topping pattern while the S&P 500, Dow, and Russell's all held up.
It could mean it will be a rare time when a textbook topping pattern does not work as it generally yields about a 5-10% move lower.
Or it could mean that the other indices will also turn lower following NASDAQ’s early lead.
Whatever transpires, there are always our outliers to look at.
First is the long bonds or 20-year plus treasury bonds TLT. TLTs were also technically perfect.
They had what is called a double bottom, which means twice, once in July and then again in November, it stopped falling in price at 155.
Then, each time that price was tested, TLTs gapped up leaving an exhaustion gap.
Friday, the TLTs rallied right to the 50-DMA and closed just below it.
That makes its next move important. A gap over the 50-DMA means a flight to safety and caution for the overall market.
A retreat under 156 most likely means more optimism and a continuation of the rally or the very least, consolidation.
Next are what we call the Fed’s playground. Junk Bonds JNK and High grade bonds LQD are holding up.
LQD looks strong even as it retreats from recent highs, it holds major support below.
JNK looks even better with a move to new multi-year highs last week followed by some digestion.
If you are wondering about risk on, these 2 bonds say yes.. for now.
Finally, the sector that actually outperformed the SPY was oil and energy.
This is interesting as it is heavily shorted, predicted by analysts to be wildly bearish, and in spite of calls for lower global demand, says in fact the opposite. Demand is expected to increase.
This coming week, we will look at the potential conflicting signals-long bonds, maybe warning, junk and high grade bonds happy and indices mixed.
Investors hope for some clarity.
Stimulus will help. Vaccine news is already helping.
And consumer sentiment, which also rose suggests that optimism prevails, while pessimism sits below the surface.
S&P 500 (SPY) Watch for 364 to hold.
Russell 2000 (IWM) Support 180.
Dow (DIA) Holding 300 and the 10-DMA.
Nasdaq (QQQ) 300 Key support. Next 288.64 support the 50-DMA
KRE (Regional Banks) 51.71 to clear. Support 48.48
SMH (Semiconductors) Doji Day with 214.92 to clear. 202.89 next key support.
IYT (Transportation) Holding the 10-DMA at 223.51
IBB (Biotechnology) 151.25 to clear. 145 area support.
XRT (Retail) 59.24 support.
Disclosure: None. If you'd like more information about the additional free trading education mentioned in ...
more

