
The 3rd Quarter Interest Rate Test
The 2nd Quarter Interest Rate Correction
The following monthly chart of the 10-year U.S. Treasury bond (SPTL) reveals that the 2nd quarter decline in interest rates was really just a correction in an ongoing, longer term move higher:
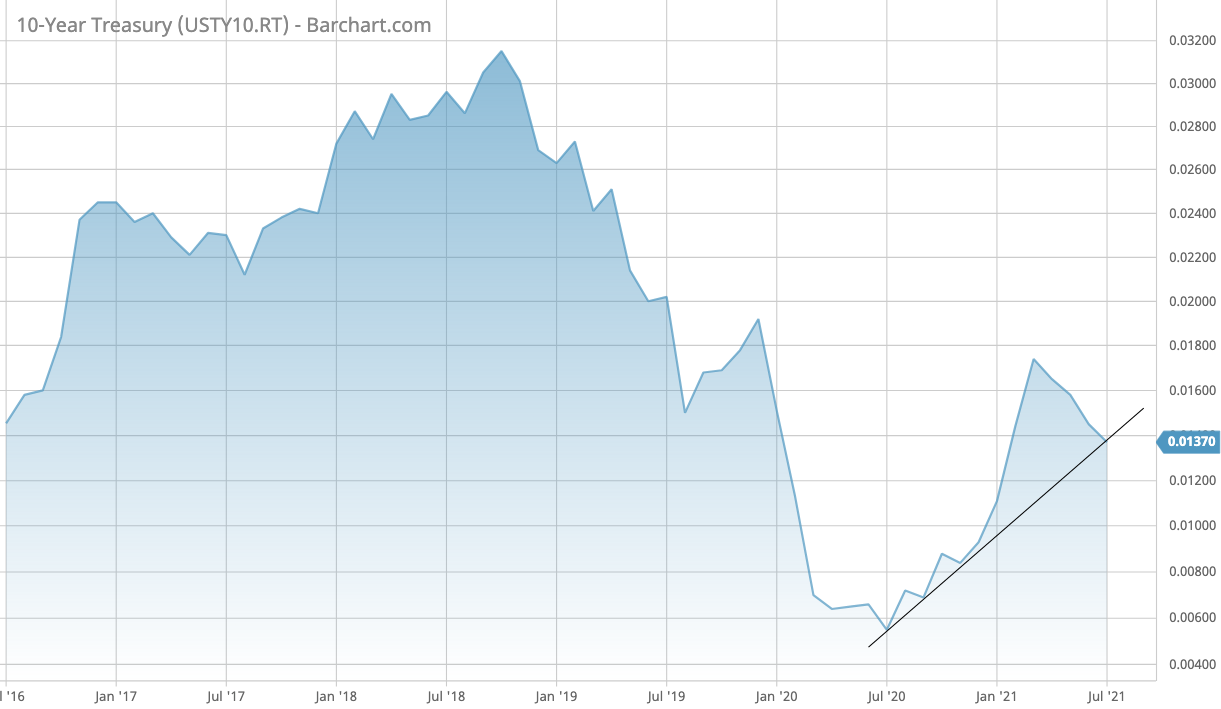
Many investors have been scratching their heads over this move lower in yields given Consumer Price Index (CPI) inflation is running 5% and oil prices have continued to move higher. The picture becomes clear when you look at the U.S. Treasury market supply & demand fundamentals.
There are six factors at play here that explain the 2nd quarter decline in longer term interest rates.
-
The U.S. Treasury sold a large amount of bonds in March above and beyond what was already required to cover the structural budget deficit—roughly $342 billion by my estimate. This explains the peak in the 10-year bond yield in mid-March. The Treasury got a lot of additional needed borrowing out of the way before the 2nd quarter.
-
The U.S. Treasury exited the 1st quarter with $1.1 billion in its bank account at the Federal Reserve (Treasury General Account). On June 30th it was $852 billion. The Treasury thus had $250 billion of additional funds from drawing down this account.
-
U.S. Commercial banks continued their heavy buying in the 2nd quarter to the tune of $301 billion.
-
Foreigners started buying again in April (+$42 billion) after being net sellers in March (-$71 billion). Foreigners have not been net buyers of Treasuries since July 2020 so this is an interesting development. May and June data is not out yet, but I expect that we are going to see further upticks in foreign buying.
-
The U.S. Government still has a lot of spending to do to fund the commitments made in recent spending bills and this means that there is still a lot of borrowing to do—$2.3 billion at the end of May by my estimates.
-
The Federal Reserve continues to buy $80 billion of U.S. Treasuries per month.
I estimate that the Treasury only had to sell $141 billion in net new Treasuries during the 2nd Quarter. When you run the numbers, you can see that there were simply a lot more buyers than sellers. This rosy scenario ends in the 3rd quarter. A test is coming.
Learning From The Third Quarter Interest Rate Move
I estimate that the Treasury will have to sell $771 billion of net new Treasuries in the 3rd quarter. Who is going to buy all of this? Here is what we know:
-
Over the last 7 months, U.S. Commercial banks have been buying an average of $85 billion per month. If this pace continues, then they could potentially buy $255 billion—call it $200 to $300 billion.
-
The Fed will buy at least $240 billion. With headline inflation running 5%, I wouldn’t expect the Fed to exceed $240 billion.
This leaves $276 billion that someone else will have to buy which I expect will send the 10-year yield heading north again along that monthly trend line at the beginning of this Letter. Keep in mind that when you adjust for U.S. Commercial bank buying, private U.S. investors have been net sellers of Treasuries. Foreign investors are the only group that could be buyers at these interest rate levels. U.S. investors are demanding higher rates and how much more so will they if inflation remains elevated or even increases.
It will be important to watch how Foreign demand responds. If it does, it could soften the move. If it doesn’t, the move higher could be stronger.
Lastly here, I see zero room for the Fed to begin tapering its U.S. Treasury purchases in 2020. If higher inflation continues or increases, then this could put the Fed in a serious predicament given that the Treasury will have to continuing selling exceptionally high net new amounts of Treasury bonds through the first quarter of 2022.
Strategic Conclusions
I am looking for interest rates to start climbing again for all the reasons outlined above. I do not know by how much, but the monthly chart above would suggest 2% by year end. Moreover, The 7-month change in total banking system credit provision is accelerating. It bottomed at 8.2% in January 2021 and hit 12.2% in June. This portends continued strength in the U.S. economy and stock market. This credit provision metric was the one I highlighted at the beginning of the year where I concluded that the U.S. stock market was going higher. The S&P 500 Index continues to move in tandem with this. I think the S&P will exceed 4,600 by year end (SPX).
In this recently started 3rd quarter, I am expecting renewed strength in the cyclical sectors of the stock market—consumer discretionary, energy, financials, industrials, and materials.
If the first quarter patterns repeat, gold (GLD) could suffer for a while on rising interest rates. Silver (SLV) is the better option as it is more of a true inflation hedge and has shown relative strength versus gold all year.
The information presented in the True Vine Letter is general in nature and designed for do-it-yourself and professional investors. It does not have regard to the investment objectives, financial ...
more

