
Technically Speaking: Too Fast, Too Furious
On December 25th, I penned “My Christmas Wish” wherein I stated that is was “now or never” for the bulls to make a stand.
“If we take a look back at the markets over the last 20-years, we find that our weekly composite technical gauge has only reached this level of an oversold condition only a few times during the time frame studied. Such oversold conditions have always resulted in at least a corrective bounce even within the context of a larger mean-reverting process.”
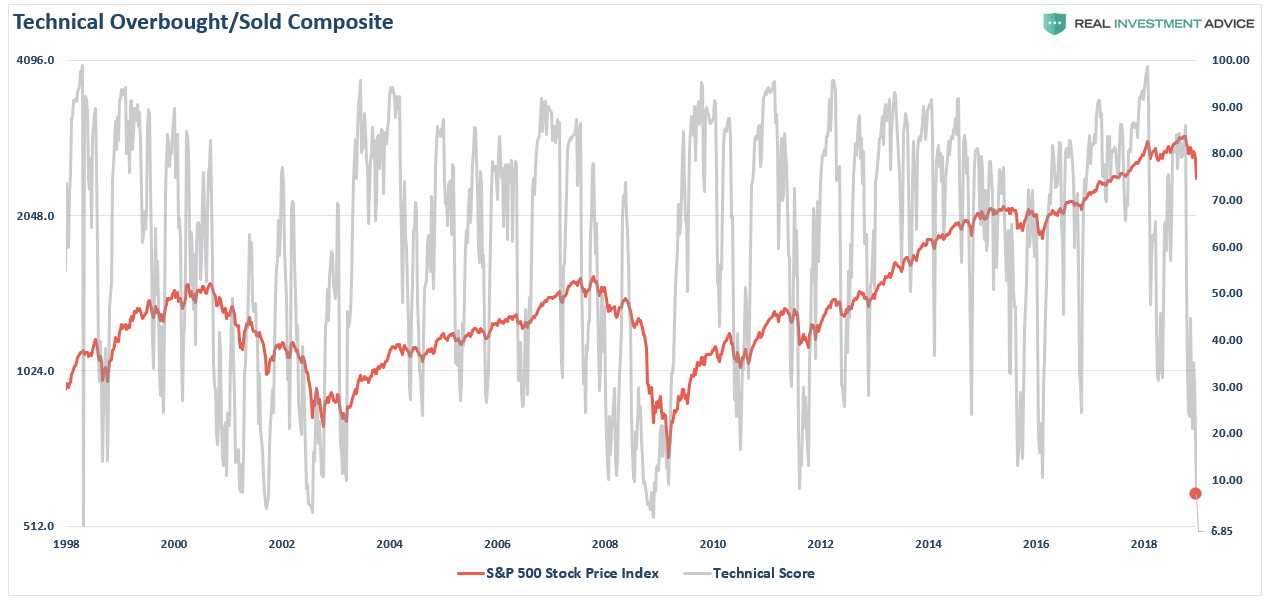
“What this oversold condition implies is that ‘selling’ may have temporarily exhausted itself. Like a raging fire, at some point the ‘fuel’ is consumed and it burns itself out. In the market, it is much the same.
You have always heard that ‘for every buyer, there is a seller.’
While this is a true statement, it is incomplete.
The real issue is that while there is indeed a ‘buyer for every seller,’ the question is ‘at what price?’
In bull markets, prices rise until ‘buyers’ are unwilling to pay a higher price for assets. Likewise, in a bear market, prices will decline until ‘sellers’ are no longer willing to sell at a lower price. It is always a question of price, otherwise, the market would be a flat line.”
We now know where the buyers were willing to start buying again.
Let’s take a look at that same technical indicator just one month later.
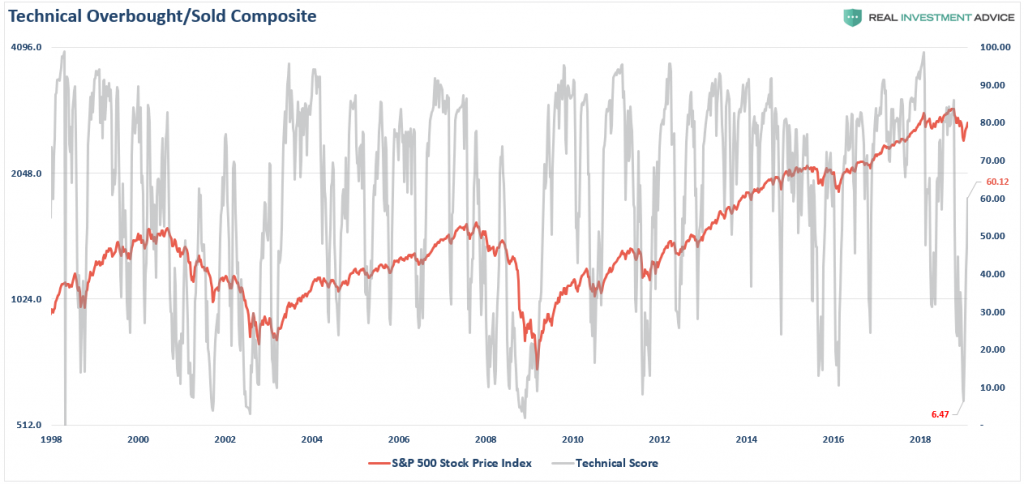
Now, let me remind you this is a WEEKLY indicator and is therefore typically very slow moving. The magnitude of the advance from the December 24th lows has been breathtaking.
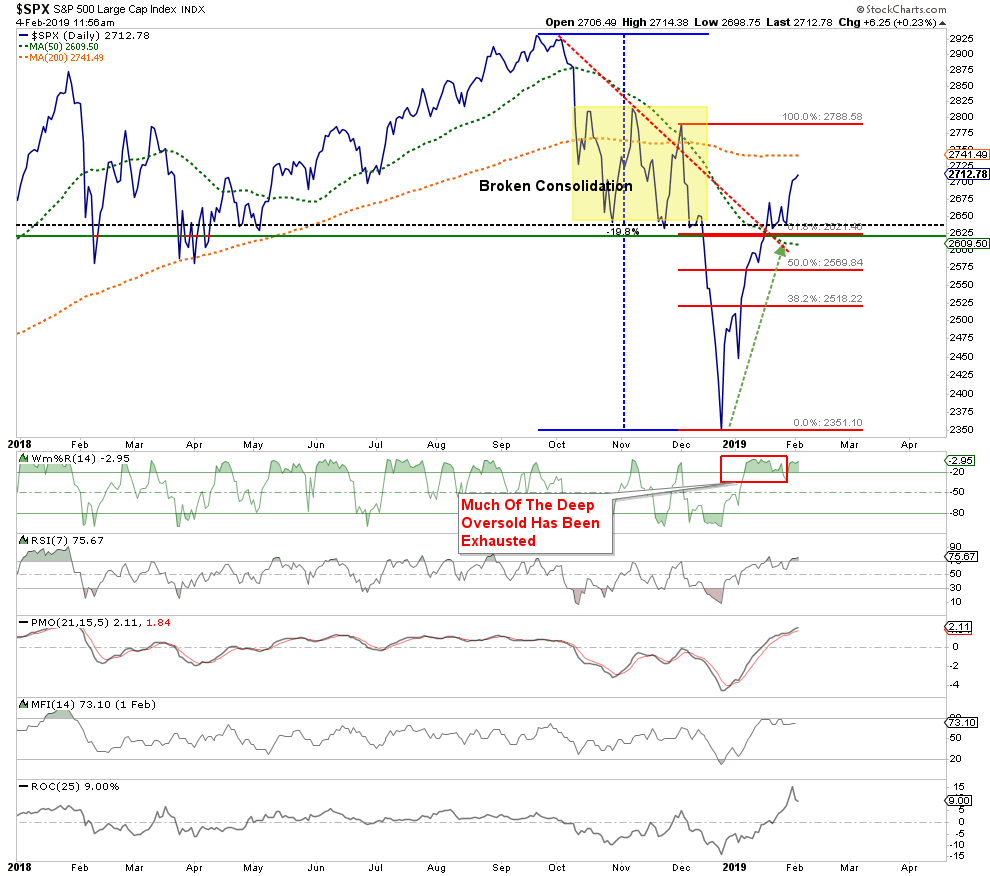
Short-term technical indicators also show the violent reversion from extreme oversold conditions back to extreme overbought.
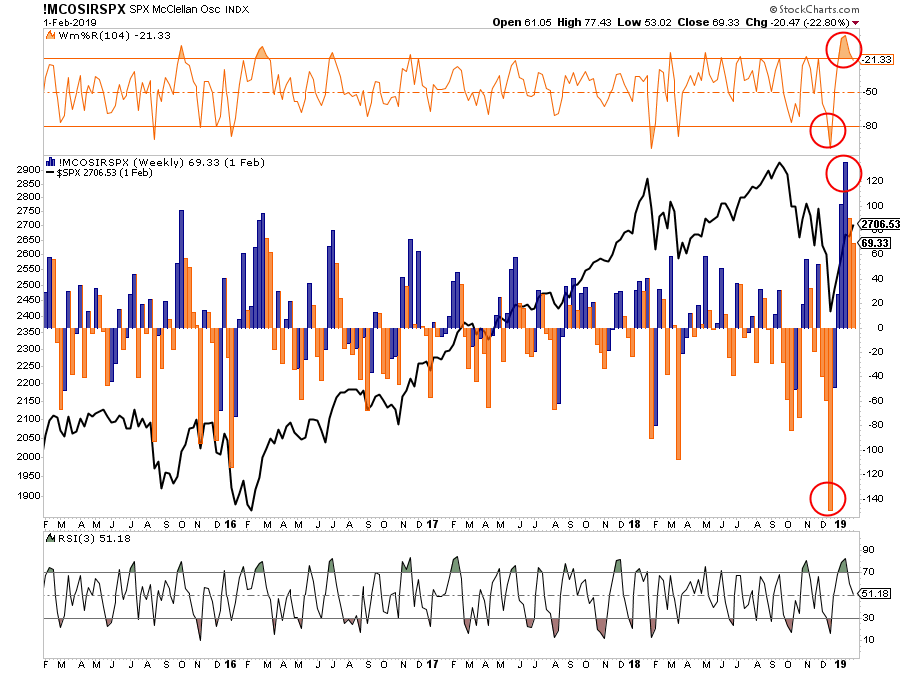
The McClellan Oscillator also swung from record low readings to record high readings in the same time frame as well.
But it isn’t just the technical change that has had a violent reversion but also the rush back into equities by investors.
Oh, wait, that didn’t actually happen.
As noted by Deutsche Bank’s Parag Thatte noted recently:
“While the S&P 500 rallied +15% since late December, equity funds have continued to see large outflows. As Thatte elaborates, “US equity funds in particular have continued to see large outflows (-$40bn) since then, following massive outflows (-$77bn) through the sell-off from October to December.”
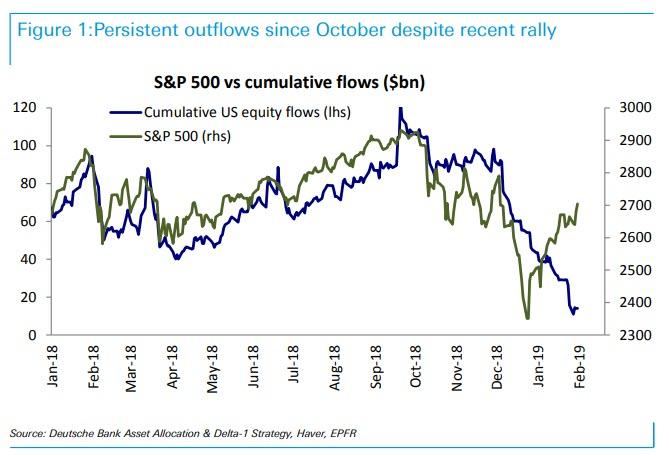
This confirms our concern the recent rally has primarily been a function of short-covering and repositioning in the markets rather than an “all-out” buying spree based on a “conviction” the “bull market” remains intact.
David Rosenberg recently confirmed the same:
“Let’s go back to December for a minute. This was the worst December since 1931, mind you, followed by the best January since 1987. This is nothing more than market that has gone completely manic.
To suggest that there is anything fundamental about this dead-cat bounce in equities is laughable. This is an economy, and a market, that couldn’t even sustain a 3% yield on the 10-year T-note. It sputtered at the thought of the Fed taking the funds rate marginally above zero on a ‘real’ basis, even as it feasted on unprecedented stimulus for a such a late-cycle economy.
Yes, Powell et al. helped trigger this latest up-leg, not just at last week’s meeting, but in the lead-up to the confab as well. The Fed has been crying uncle for weeks now.”
As I discussed previously, this also highlights the importance of long-term moving averages.
“Again, as noted above, given that prices rise and fall due to participant demand, long-term moving averages provide a good picture of where demand is likely to be found. When prices deviate too far above, or below, those long-term averages, prices have a history of reverting back to, or beyond, that mean.”
Well, as we now know, the market found support at the 200-week (4-year) moving average. As you will notice, with only a couple of exceptions, the 200-week moving average has acted as a long-term support line for the market. When the market has previously confirmed a break below the long-term average, more protracted mean-reverting events were already in process. Currently, the “bull case” remains intact as that long-term average has held…so far.
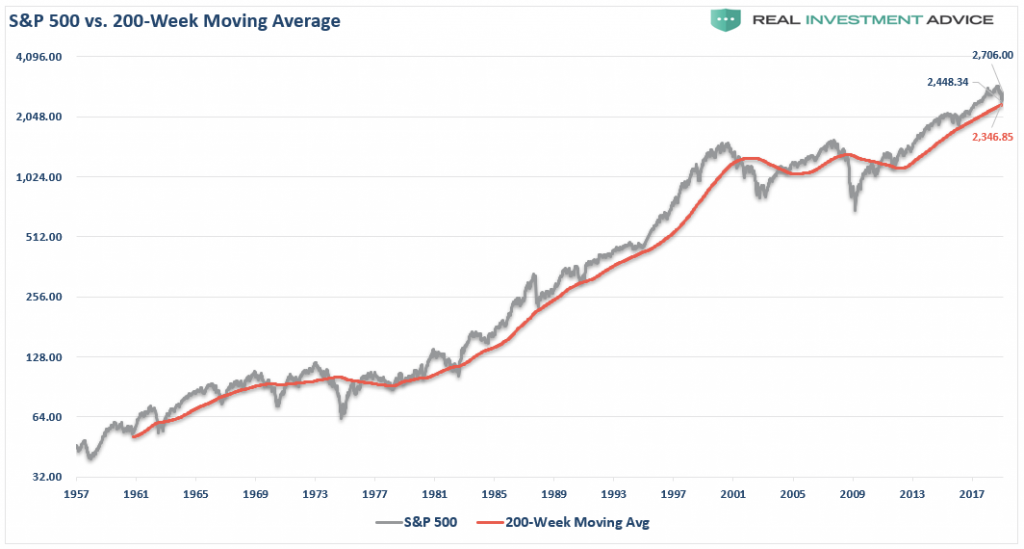
However, just because the initial test of the trend has held, it doesn’t mean the correction is over. As was seen in late 2015 and early 2016, the market held that trend during two sequential tests of the lows. While the bulls remain in charge for the moment, it will be whether the bulls can successfully manage a retest of lows without breaking the long-term trend.
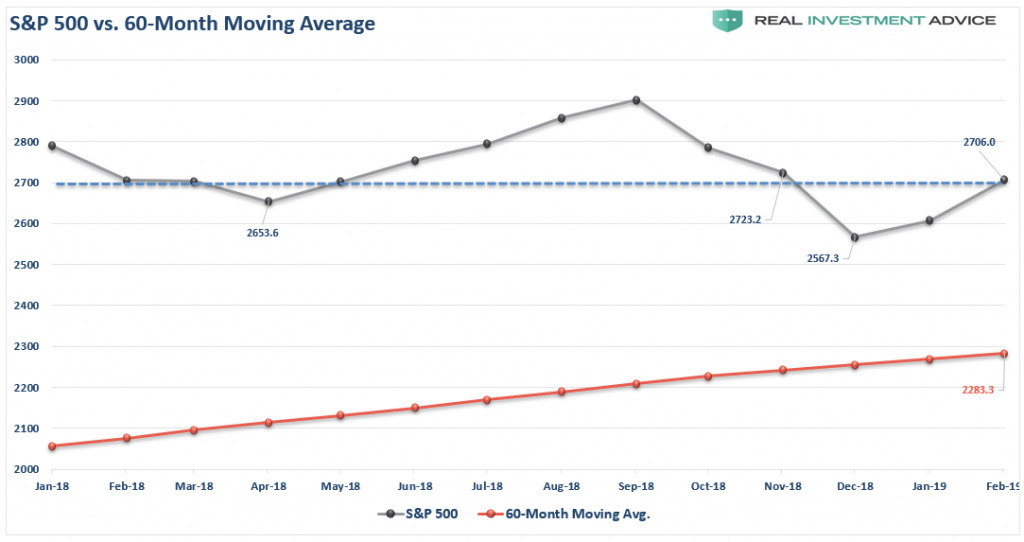
The same goes for the 60-month (5-year) moving average. With the market currently sitting just above the long-term trend support line, the “bull market” remains intact for now.
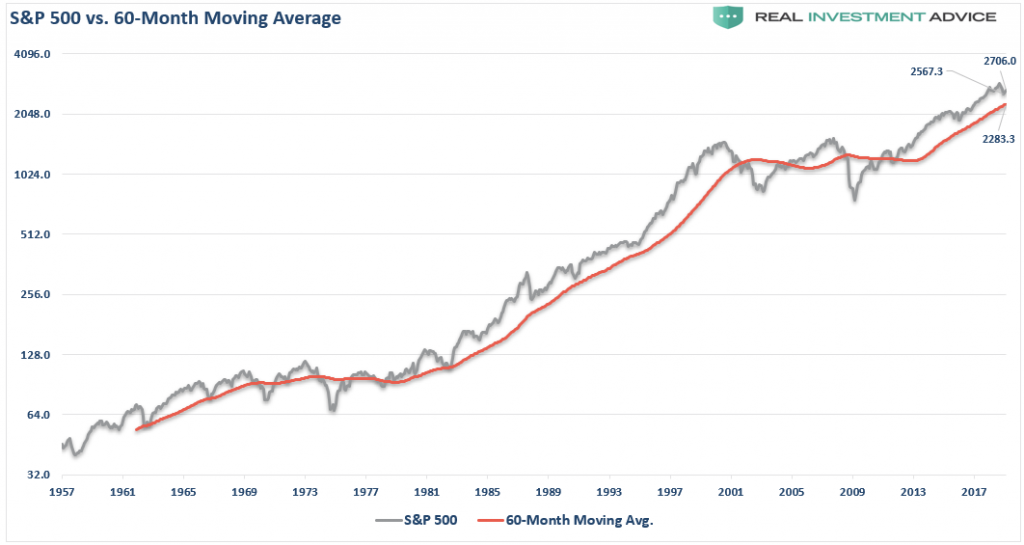
Again, a monthly close below 2280 would suggest a more protracted “bear” market is underway.
The Bounce Hits Our Targets
As I noted in the Christmas report, we were looking for an oversold retracement rally to push stocks back toward the previous October-November closing lows of 2600-2650. The rally has hit and slightly exceeded those original estimates.
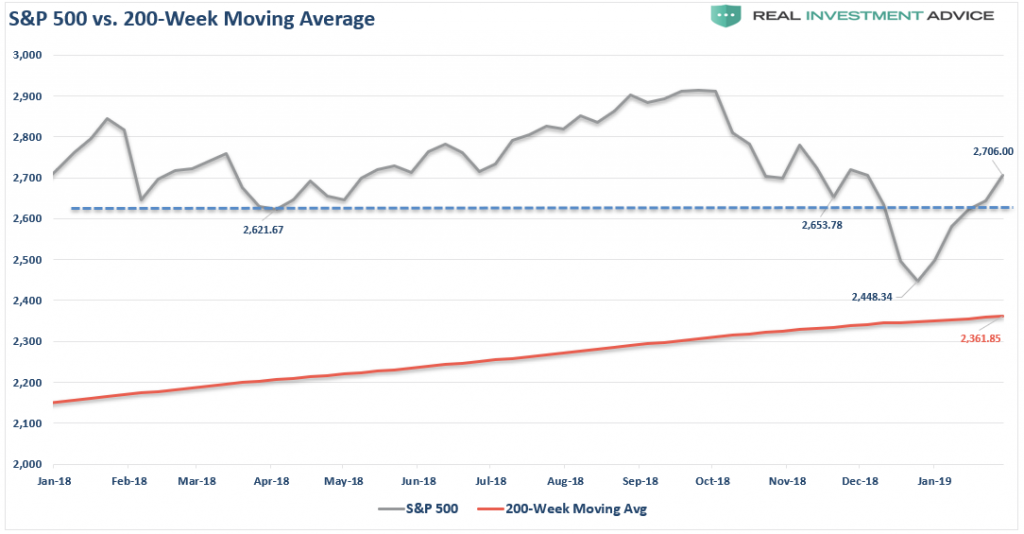
But, we also said that on a monthly basis the rally could extend as high as 2700 which is roughly where January closed.
And, not surprisingly, it all turned out precisely as I stated:
“From yesterday’s closing levels that is a 12.7% to 14.8% rally.
A rally of this magnitude will get the mainstream media very convinced the ‘bear market’ is now over.”
It is too early to suggest the “bear market of 2018” is officially over.
But, the rally has simply been “Too Fast, Too Furious,” completely discounting the deteriorating fundamental underpinnings:
- Earnings estimates for 2019 have sharply collapsed as I previously stated they would and still have more to go.
- Stock market targets for 2019 are way too high as well.
- Despite the Federal Reserve turning more dovish verbally, they DID NOT say they actually WOULD pause their rate hikes or stop reducing their balance sheet.
- Trade wars are set to continue as talks with China will likely be fruitless.
- The effect of the tax cut legislation has disappeared as year-over-year comparisons are reverting back to normalized growth rates.
- Economic growth is slowing as previously stated.
- Chinese economic has weakened further since our previous note.
- European growth, already weak, will likely struggle as well.
- Valuations remain expensive
You get the idea.
But more importantly, as recently noted by Sven Henrich, it also resembles much of what was seen at the previous two bull market peaks.
“Note the common and concurrent elements of the previous two big market tops (2000, 2007) versus now:”
- New market highs tagging the upper monthly Bollinger band on a monthly negative RSI (relative strength index) divergence — check.
- A steep correction off the highs that breaks a multi-year trend line — check.
- A turning of the monthly MACD (Moving Average Convergence Divergence) toward south and the histogram to negative — check.
- A correction that transverses all the way from the upper monthly Bollinger band to the lower monthly Bollinger band before bouncing — check.
- A counter rally that moves all the way from the lower Bollinger band to the middle Bollinger band, the 20MA — check.
- A counter rally that produces a bump in the RSI around the middle zone, alleviating oversold conditions — check.
- All these events occurring following an extended trend of lower unemployment, signaling the coming end of a business cycle — check.
- All these events coinciding with a reversal in yields — check.
- All these events coinciding with a Federal Reserve suddenly halting its rate hike cycle — check.
The rally we “wished” for on Christmas has come to fruition. However, it isn’t a rally to become overly complacent in as there remain significant challenges coming from weaker economic growth, rising debt levels, and slowing earnings growth.
But as I concluded in this past weekend’s missive:
“While markets can certainly remain extended for much longer than logic would predict, they can not, and ultimately will not, stay overly extended indefinitely.
The important point here is simply this. While the Fed may have curtailed the 2018 bear market temporarily, the environment today is vastly different than it was in 2008-2009. Here are a few more differences:
- Unemployment is 4%, not 10+%
- Jobless claims are at historic lows, rather than historic highs.
- Consumer confidence is optimistic, not pessimistic.
- Corporate debt is a record levels and the quality of that debt has deteriorated.
- The government is already running a $1 trillion deficit in an expansion not half that rate as prior to the last recession.
- The economy is extremely long is a growth cycle, not emerging from a recession.
- Pent up demand for houses, cars, and other durables has been absorbed
- Production and Services measures recently peaked, not bottomed.
In other words, the world is exactly the opposite of what it was when the Fed launched “monetary accommodation”previously. Logic suggests that such an environment will make further interventions by the Fed less effective.
The only question is how long will it take the markets to figure it out?”
I suspect not too much longer.
Disclosure: The information contained in this article should not be construed as financial or investment advice on any subject matter. Real Investment Advice is expressly disclaims all liability ...
more

