
Technically Speaking: The Bull Market Is On Shaky Ground
Last week’s sell-off left the “bull market” on shaky ground.
The big question for investors at the moment is whether the 11-year old bull market is ending or is this just a “pause that refreshes?”
While the optimistic “hope” is that this is just a pause within a continuing “bull market” advance, from a money management standpoint getting the answer “right” is vastly more important to long-term investing outcomes.
The easiest way to approach this analysis is to start with the following basic premise:
“Bull markets are born on pessimism, grow on skepticism, and die on euphoria.” -Sir John Templeton
Euphoria Has Been Evident
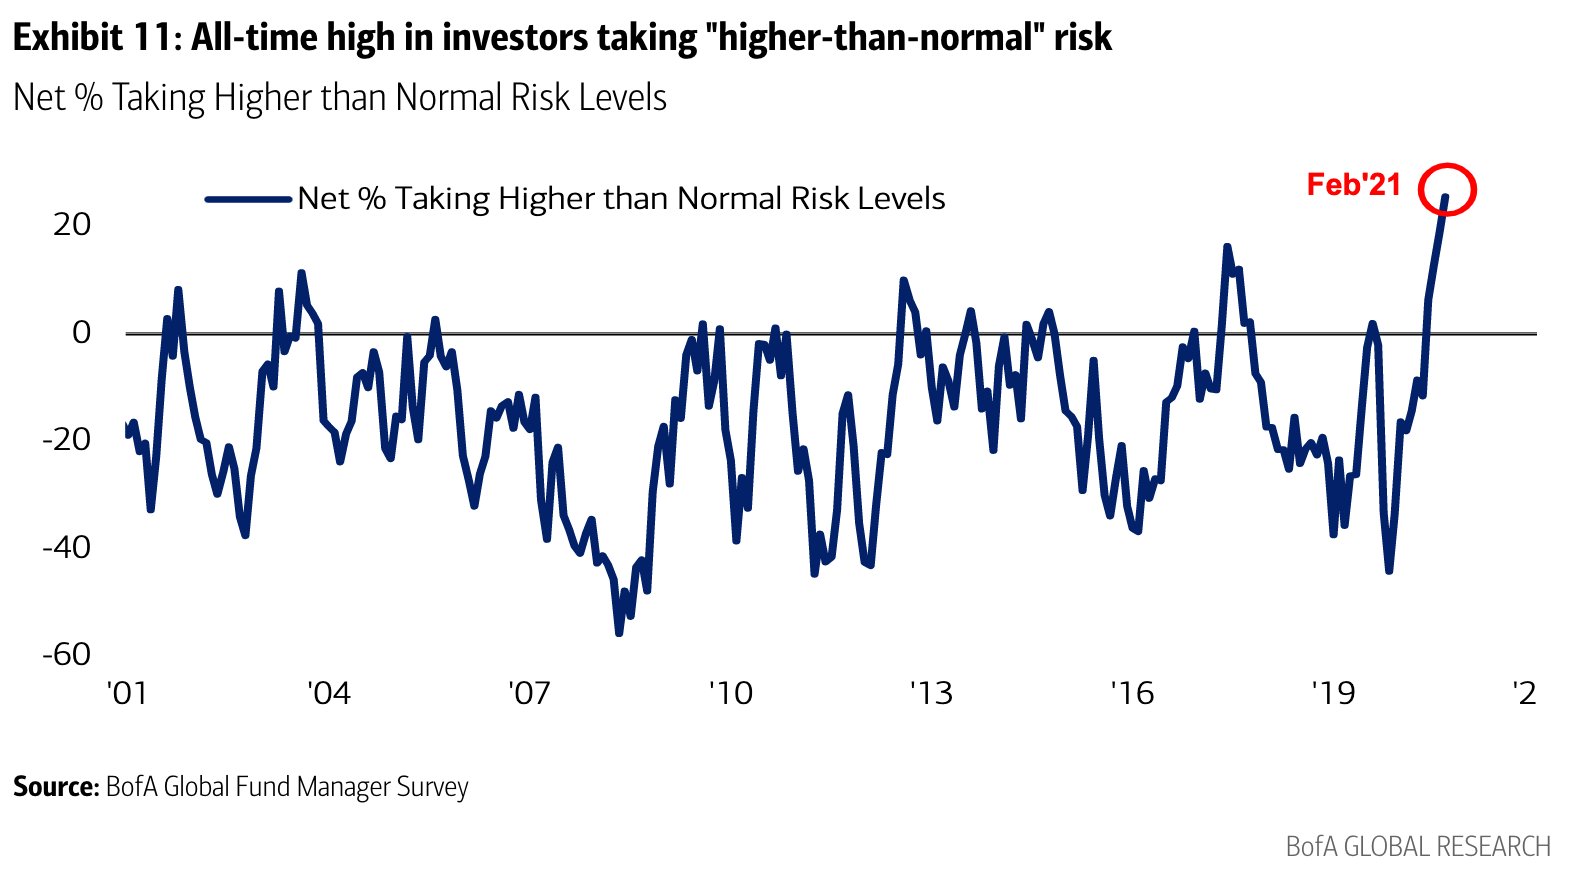
There is little argument that “euphoria” has not been evident in the market recently. From excessive levels of call-option buying by small traders to chasing the most shorted stocks in the market. As I noted just recently in “No One Is Bearish:”
- Fund managers’ allocation to cash is down to 3.8%, the lowest since March 2013. Such was just before the “taper tantrum” era under former Federal Reserve Chairman Ben Bernanke.

- Allocations to stocks and commodities are the highest since February 2011.
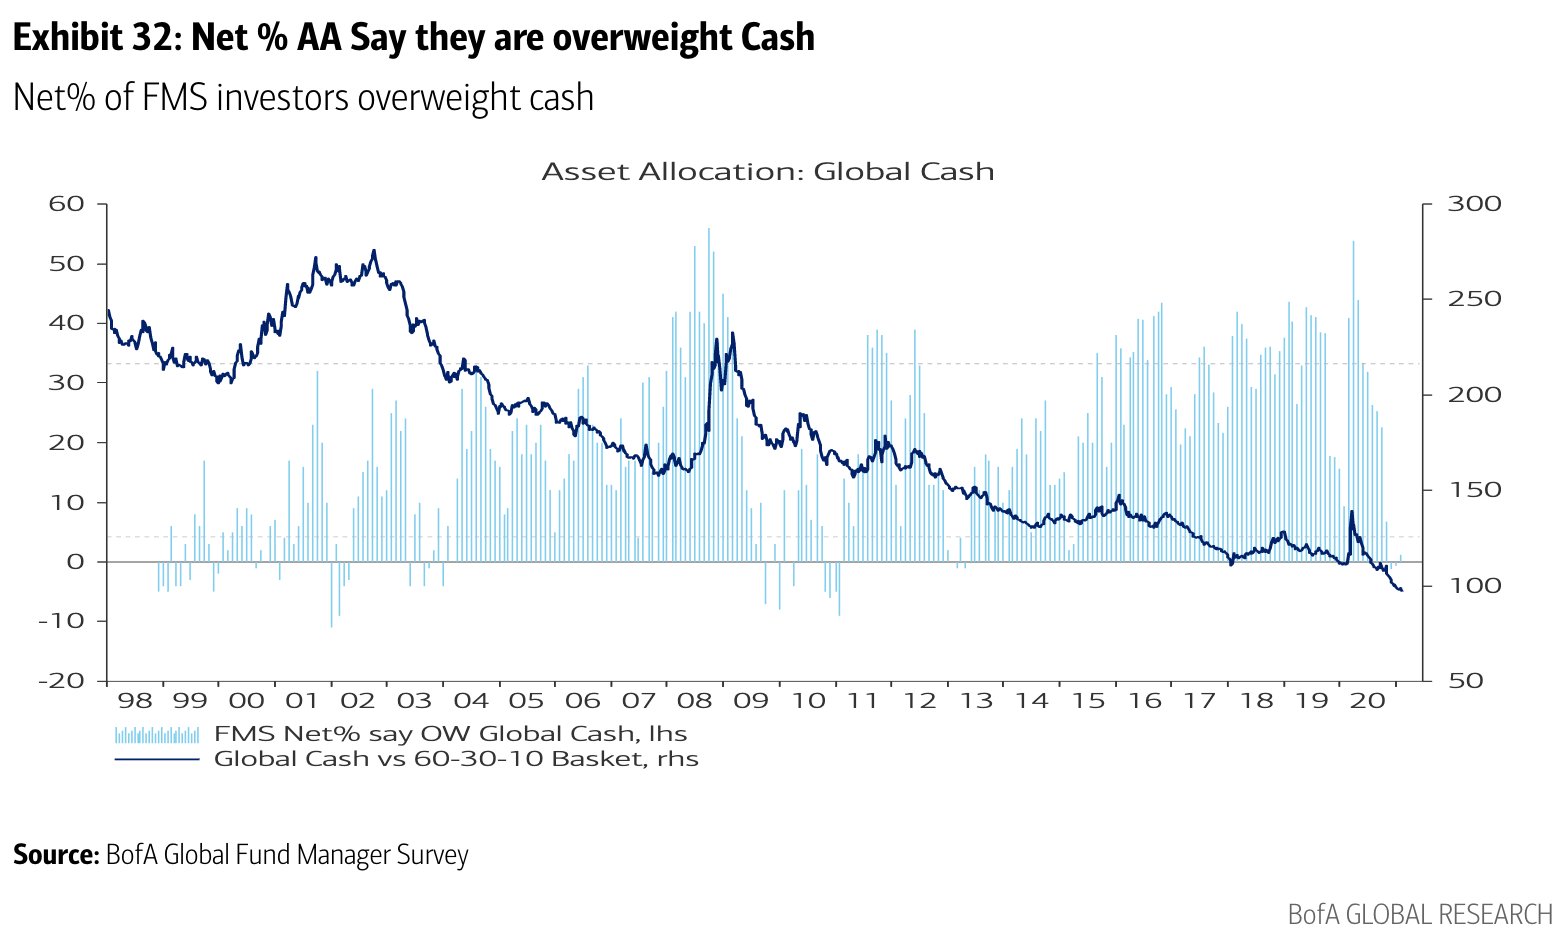
The point here, of course, is that when everyone is “in the pool,” it doesn’t take much to create a reversion.
The Value Trade Is No Longer A Value
Such is what we begin to see last week, as the previous favorite “momentum” trades were swapped in a massive rotation to “value.” Given the massively overbought extremes in the “value” plays, that rotation is likely going to be akin to “jumping from the frying pan into the fire.”
Small-cap value is more extended currently than at any point over the last 20-years using weekly data. With the index well into 3-standard deviation territory, extremely deviated from long-term means, and grossly overvalued, the eventual reversion will be brutal.

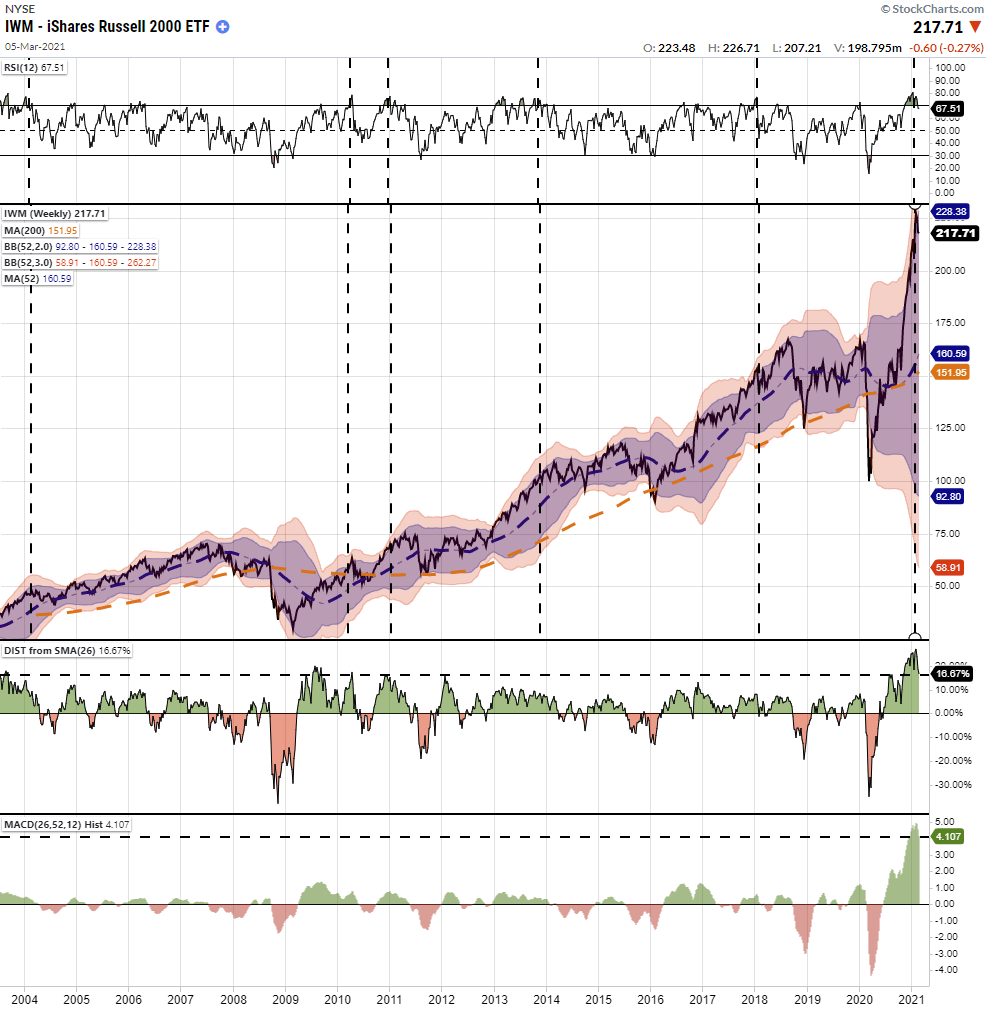
The same is seen in the weekly chart of the Russell 2000 index which picks up the Mid-cap exposure as well. With valuations in these stocks well ahead of even the most optimistic economic outlook, the risk of disappointment is high.
The poster child for the economic reopening and value rotation trade has been energy. Like small-cap value and the Russell 2000, energy is also exceedingly extended, overbought, and deviated from long-term means. At every similar point in history, the reversion was brutal.
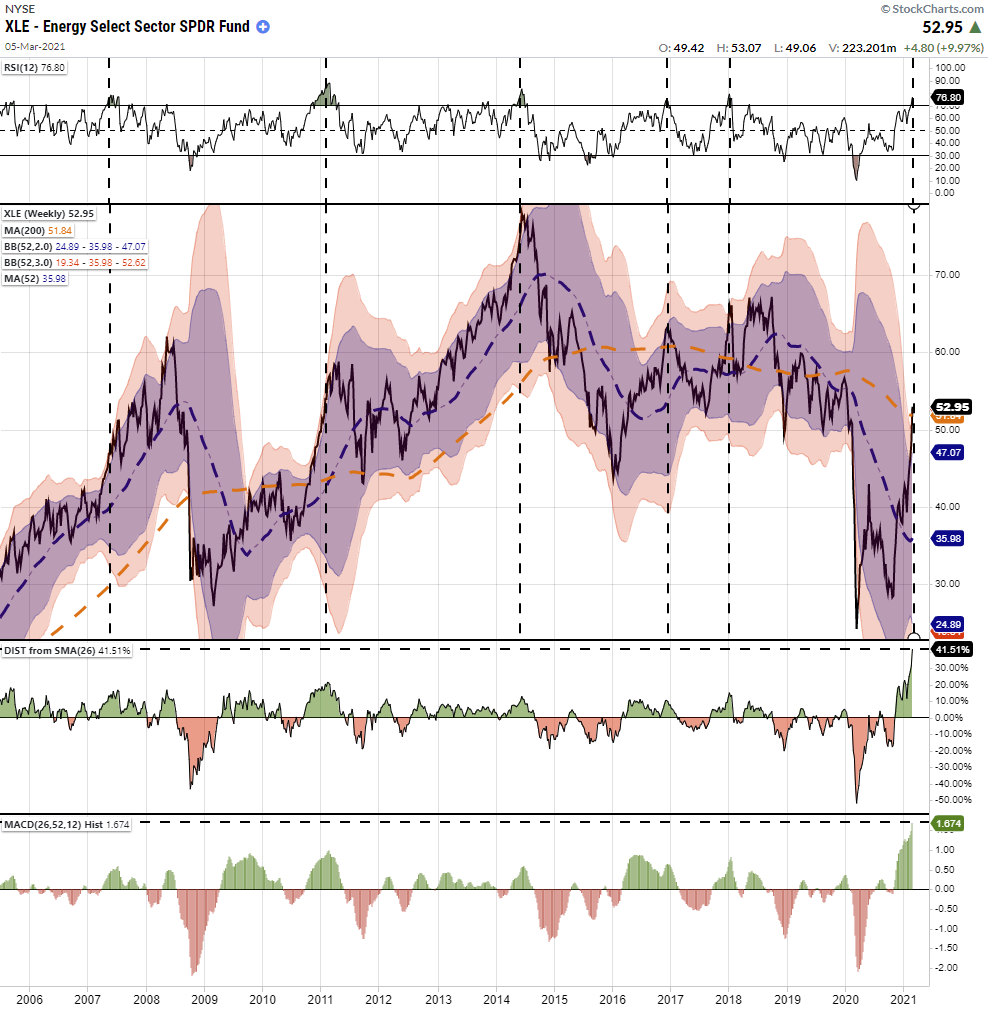
This time is unlikely to be different.
Intermediate Indicators Worrisome
Our intermediate-term indicators, (which utilizes weekly data), continue to paint a more concerning picture. Turn your focus to the middle panel of “money flows.” Despite the “seeming” exuberance of the market over the last few months, money flows have continued to weaken.
In early November, we recommended increasing equity exposure to portfolios as the “buy signal” was triggered. However, beginning in February, that signal reversed leading to continued downward price pressures.
While the market could indeed bounce in the short-term, the decline in “money flows,” and the convergence of “sell signals,” does increase our concern of a bigger decline over the next month or so.
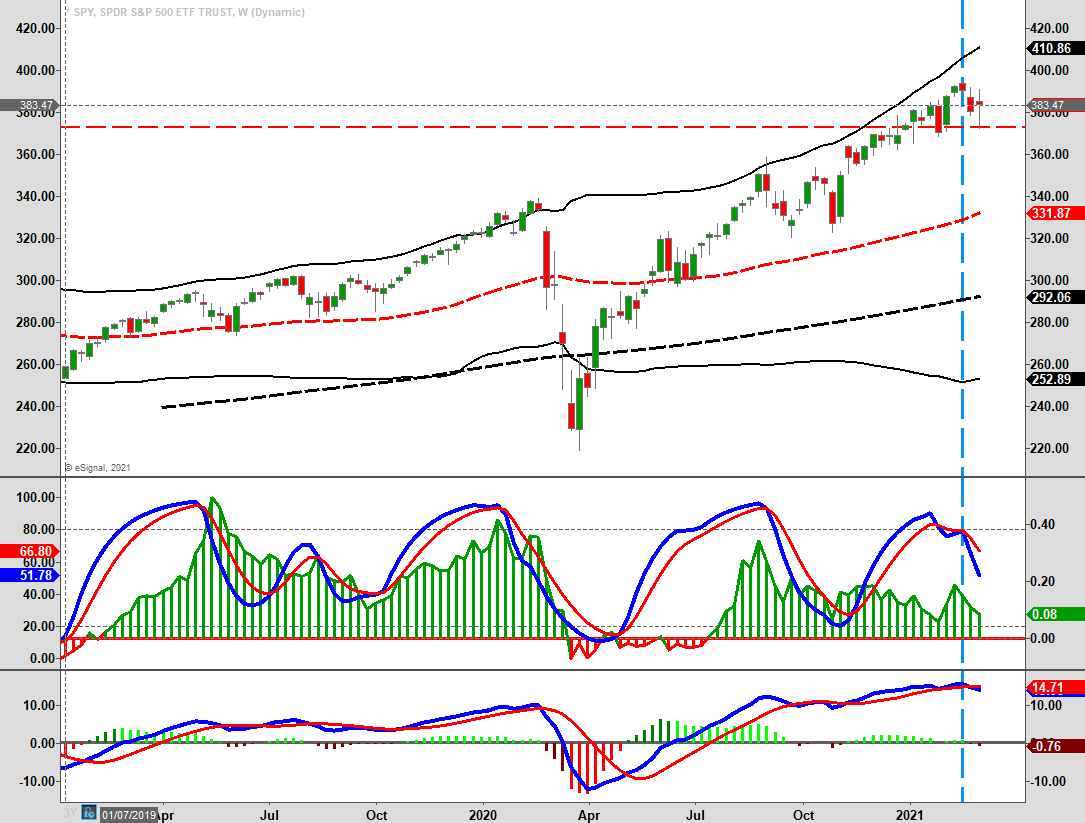
The problem with the indicator is that it does not distinguish between declines. The “sell signal” in September and October of 2020 coincided with two 10% declines. The signal in March was a 35% crash over a 3-week period.
There is certainly a risk of a larger decline given the confirming MACD sell signal in the lower panel. I suspect in the near-term declines will still be met with buyers as the “momentum” chase remains. However, the risk of a deeper correction is certainly possible if something “spooks” the market, so risk management remains key.
Longer-Term Concerns
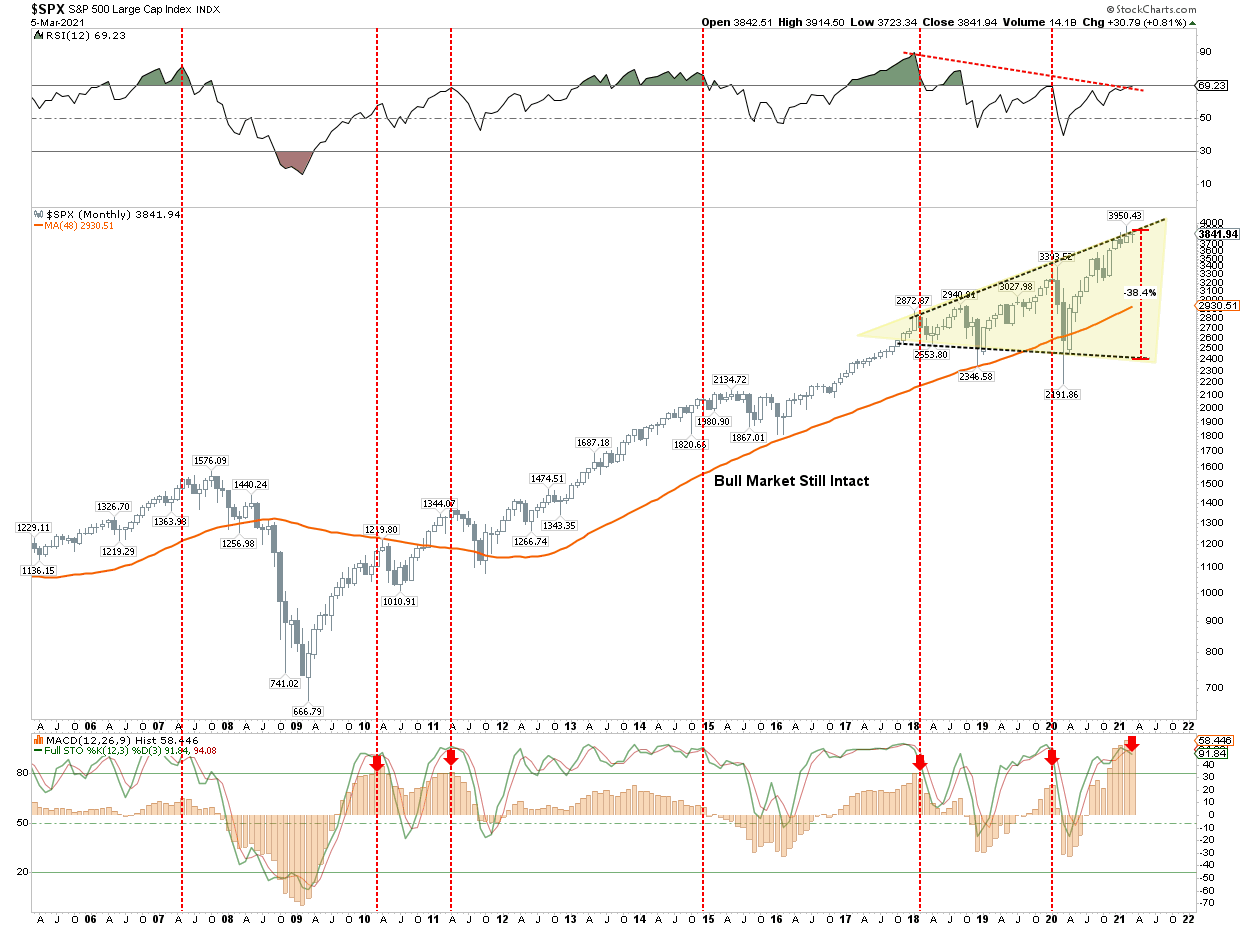
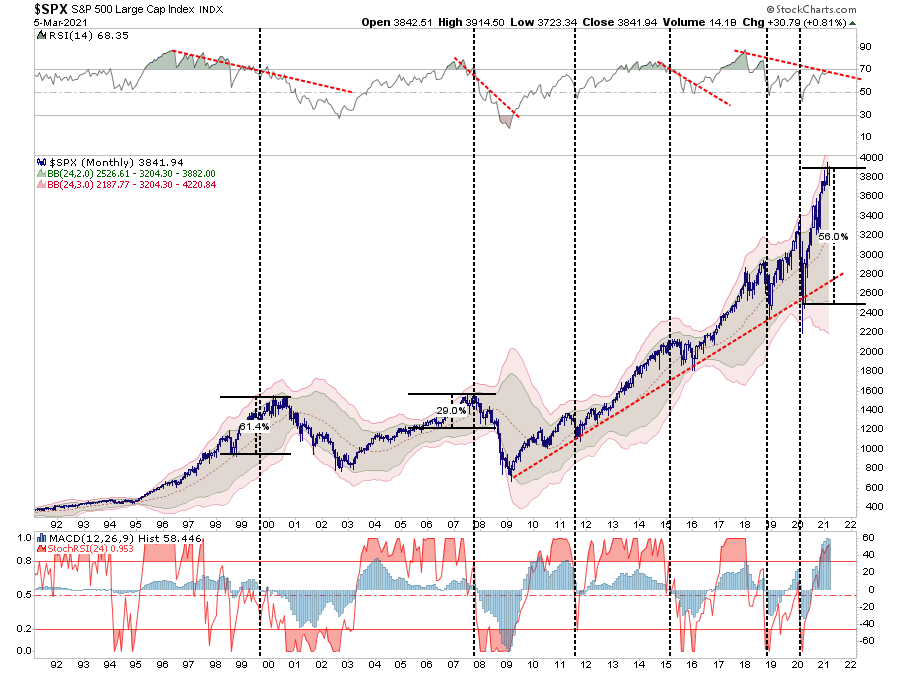
One of the more concerning charts we have been monitoring for some time is the monthly expanding price pattern. Once again, the market has struggled with the top of the expanding pattern as relative strength continues to deteriorate. With the markets extremely extended on a monthly basis, as denoted by the red arrows, such periods have had less positive outcomes for investors.
Monthly price charts are NOT TO BE USED for trading portfolios. Indications are only valid at the end of the month, and they are slow to turn.
Due to the lag, most short-term focused investors make assumptions the indications are “wrong” this time. However, history tends to prove that extreme market extensions rarely resolve themselves to the upside.
Of course, what causes the eventual “reversion” is always an unexpected, exogenous event when sends investors scrambling for exits where there are few buyers.
Managing Past The Noise
There are many arguments for both bulls and bears. On the bullish side, the passage of another stimulus bill will provide a short-term “sugar rush” in the markets and economy.
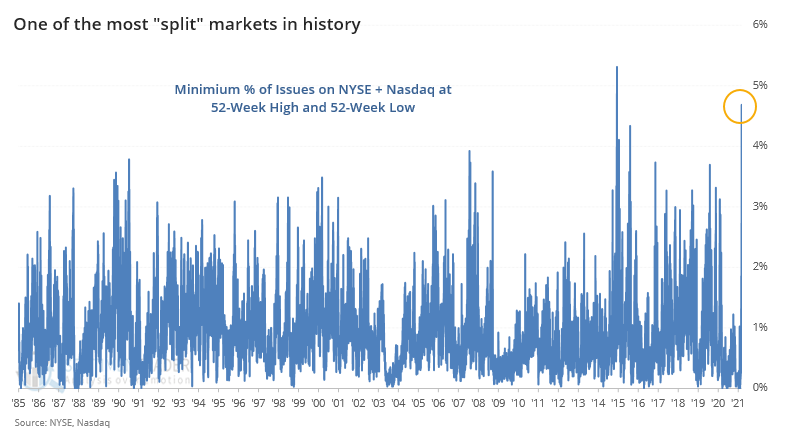
On the bearish side, everything from extreme exuberance to overvaluation poses a longer-term threat. As noted by SentimenTrader over the weekend:
“Yesterday was the biggest split in almost 40 years. There were so many stocks hitting 52-week highs AND 52-week lows on both the NYSE and Nasdaq that it registered the 2nd most extreme reading since 1984. Split markets have a strong tendency to be ‘not bullish.'”
Whether you are bullish or bearish there is an argument to fit your agenda.
Therein Lies The Rub
YOUR personal bias may be leading you astray as “cognitive biases” impair investor returns over time.
“Confirmation bias, also called my side bias, is the tendency to search for, interpret, and remember information in a way that confirms one’s preconceptions or working hypotheses. It is a systematic error of inductive reasoning.”
Therefore, it is important to consider both sides of the current debate in order to make logical, rather than emotional, decisions about current portfolio allocations and risk management.
Currently, the “bulls” are still in control of the market. The long-term running bull trend remains intact…for now. The chart below is a MONTHLY chart of the S&P 500. Importantly, the bullish trend that began in 2009 remains intact. A correction back to that trendline would encompass a nearly 30% decline from last week’s close.
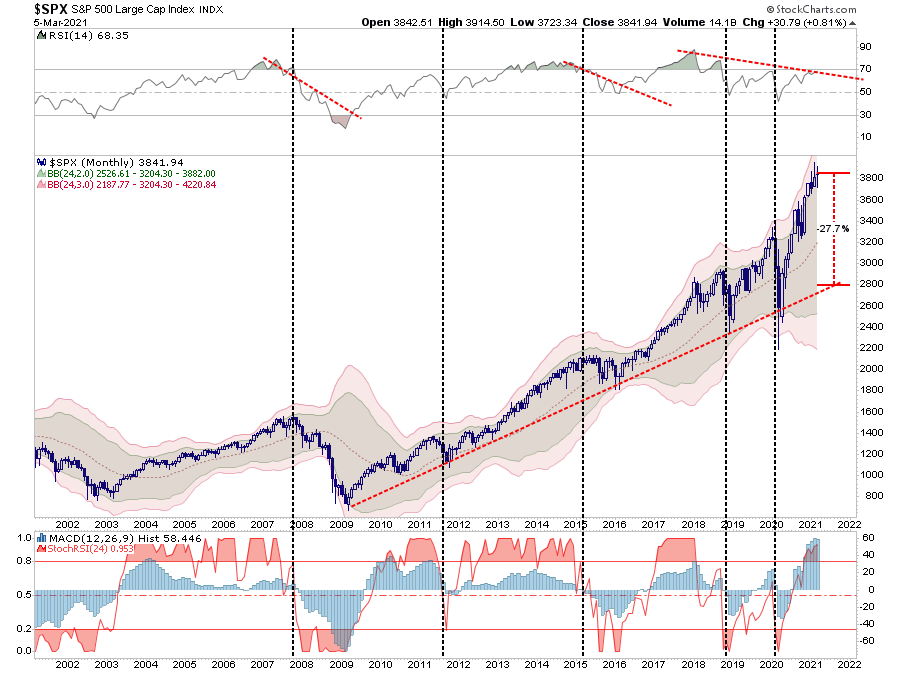
However, the real question is the sustainability of the market at current levels given the rather extreme deviation from long-term means.
For those of you who like analogs, the most comparable period historically is the 1998-1999 market “melt-up.” During that period, the market bounced off support and then began a 60% “melt-up” to the final peak in 2000. Currently, from the March lows, the S&P has risen by nearly 60%. In both cases, the negative divergence in relative strength combined with grossly extended markets did not work out well.
Continue To Focus On Risk Controls
The big question right now is whether the correction that began a couple of weeks ago is over?
I would not be surprised to see a reasonable bounce in the market given the passage of the stimulus, and short-term oversold conditions. Such certainly continues to support the “economic recovery” story. Unfortunately, once the stimulus runs through the system, the markets will again face economic realities.
For all of these reasons, we continue to hold slightly higher levels of cash and continue to focus on basic risk management controls. As such, over the next couple of weeks we will likely:
- Sell positions that simply are not working. If they were not working in the strongly rising market and failed to hold support during the decline, acknowledge your thesis is wrong. Investment Rule: Cut losers short.
- Trim winning positions back to original portfolio weightings. This allows you to harvest profits but remain invested in positions that are working. Investment Rule: Let winners run.
- Retain cash raised from sales for opportunities to purchase investments later at a better price. Investment Rule: Sell High, Buy Low
While “bearish” concerns are often dismissed when markets are rising, it does not mean they aren’t valid. Unfortunately, by the time the “herd” is alerted to a shift in overall sentiment, the stampede for the exits will already be well underway.
Is the current bull market dead? I don’t know, and trying to predict the market is quite pointless. The risk for investors is the “willful blindness of change” until it is far too late to matter. Just remember, no one thought the “bull market was dead” in 1999 and 2007 either.
Disclaimer: Click here to read the full disclaimer.


