
Technically Speaking: The Bull & Bear Market Case
Last week’s “Technically Speaking” covered the first part of the bull and bear market case as we head into the end of the year. As we noted, investors face a conundrum between year-end seasonality and the Fed starting to taper its bond-buying program.
I received lots of comments about the article from individuals pointing out their perspectives on the market. In addition, there were enough excellent comments to derive a follow-up to last week’s post.
The dichotomy of views is broad. Numerous articles recently discussed how the bull rally would emulate that of the 1920s. Others discuss the biggest crash ever is coming. The problem is wading through the noise to discern the underlying risk at any given point.
It’s challenging to do. Such is why so many advisors charge clients a fee for “buy and hold” strategies. Since there is a lack of knowledge or experience to manage risk, they tell clients they can’t do any better than deal with the eventual losses.
That isn’t investing. That is a capitulation to laziness, a lack of research, and a lack of defined investment discipline and strategy. While such approaches seem to work while markets are rising, financial goals get permanently destroyed when markets eventually decline.
If such was not the case, then why, after two of the largest bull markets in history, are80% of Americans woefully unprepared for retirement?
While the promise of a continued bull market is very enticing, it is essential to remember that all markets ultimately complete a “full cycle.” Therefore, if your portfolio, and eventually your retirement, depends on the thesis of an indefinite bull market, you should at least consider the following charts.
The Bullish Case
1) Sentiment
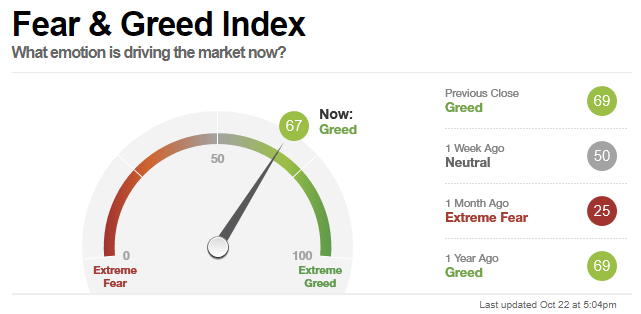
Despite the recent correction in the market, bullish sentiment has quickly returned to the market. As a result, the CNN Fear & Greed Index is back to “greed” levels after the latest rally. However, the index gets heavily influenced by the movement of the market.
Our “Fear/Greed” index gets based on how investors allocate to the market without any influence from market price changes. While our index declined with the recent correction, investors have quickly piled into equity risk over the last week.
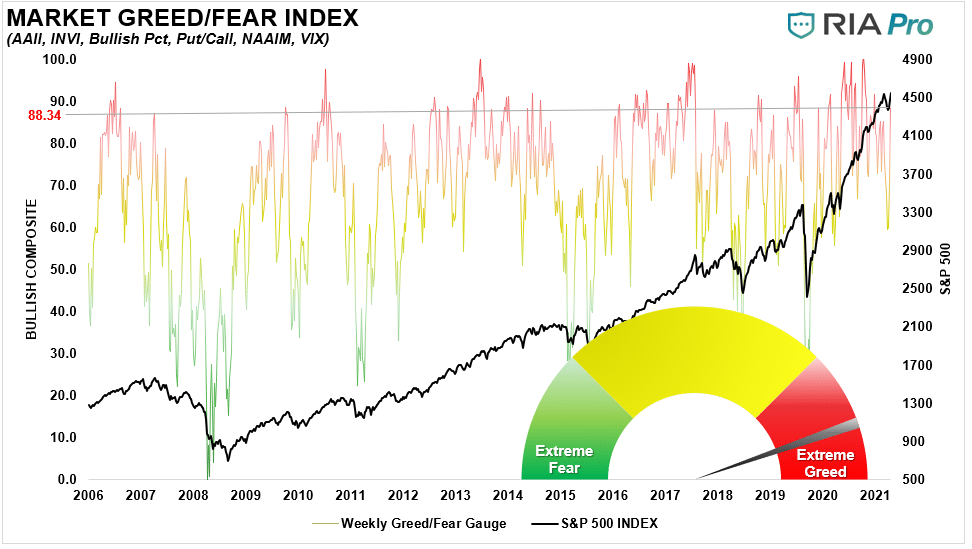
What is clear, judging by the surge in SPACs like Digital Media (DWAC) last week, investors have been quick to jump back into some of the most speculative assets recently without regard to the underlying risk. But, of course, such is also a sign of a high degree of “complacency.”
2) Complacency
At the moment, there are plenty of concerns, but investor psychology remains hugely bullish. Most concerns are well known, and, as such, the market discounts them concerning forward expectations, valuations, and earnings projections. However, what causes a sudden “mean reverting event” is an exogenous, unexpected event that surprises investors. In 2020, that was the pandemic-related “shutdown” of the economy.
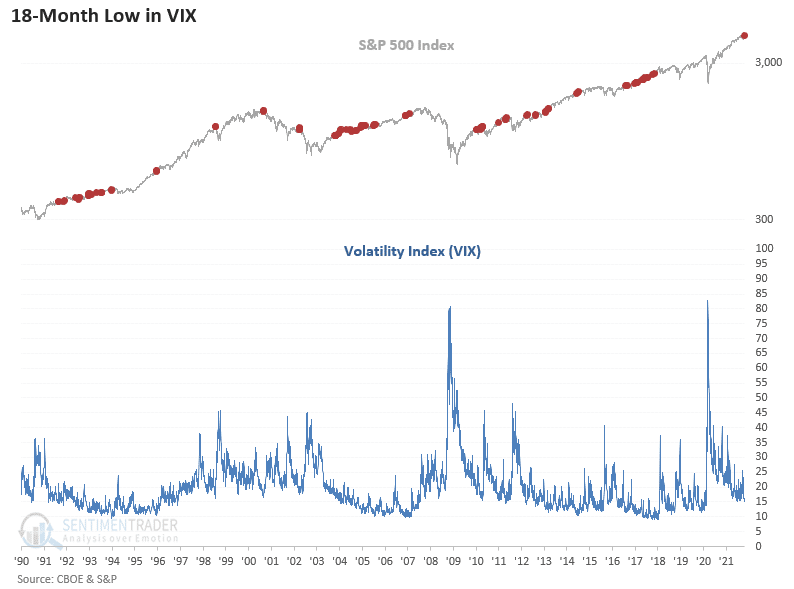
Currently, as shown by the collapse in the volatility index over the last couple of weeks, investors are highly confident that a “correction” will not occur.
“The Volatility Index (VIX) closed at a new 18-month low as the S&P 500 closed at a new multi-year high on Thursday, 10/21/21. If you were wondering, the 18-month low in the VIX Index represents the first occurrence since November 2017.” – Sentiment Trader
It is worth remembering the market had three 10-20% corrections in 2018 as low volatility begets high volatility.
3) Earnings Expectations
Currently, significant support of the bullish advance remains the rather exuberant expectations of earnings heading into the end of the year. With estimates very high, forward valuations are dropping as market prices remain at the same level currently as in August.
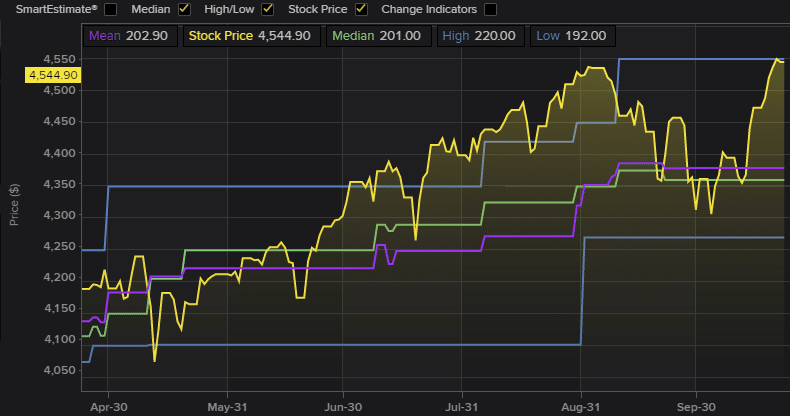
As long as expectations get met, the bullish advance can continue. Furthermore, as noted last week, with the buyback window opening November 1st, that support for asset prices will continue into year-end.
So with this very bullish backdrop for equities short-term, what is there to be worried about?
The Bearish Case
1) It’s Been A Long Time
As noted this past weekend,the S&P 500 index has gone 345-days without violating the 200-dma. Such is the sixth-longest streak going back to 1960.
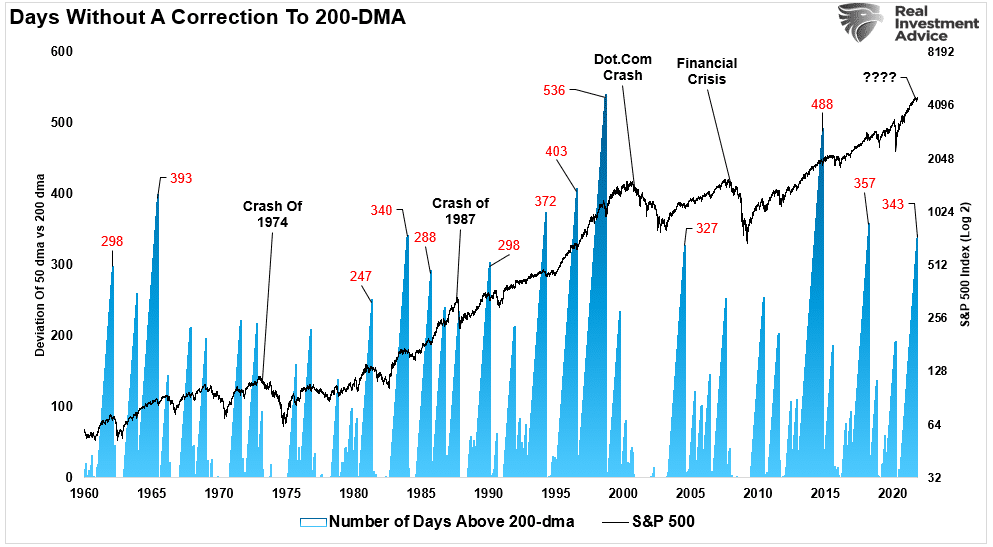
While investors are currently starting to believe that a test of the 200-dma won’t happen, there are several points to be mindful of.
- Corrections to the 200-dma, or more, happen on a regular basis.
- Long-stretches above the 200-dma are not uncommon, but all eventually resolve in a mean-reversion.
- Extremely long periods above the 200-dma have often preceded larger drawdowns.
The most crucial point to note is that in ALL CASES, the market eventually tested or violated the 200-dma. Such is just a function of math. For an “average” to exist, the market must trade both above and below that “average price” at some point.
2) Lack Of Liquidity
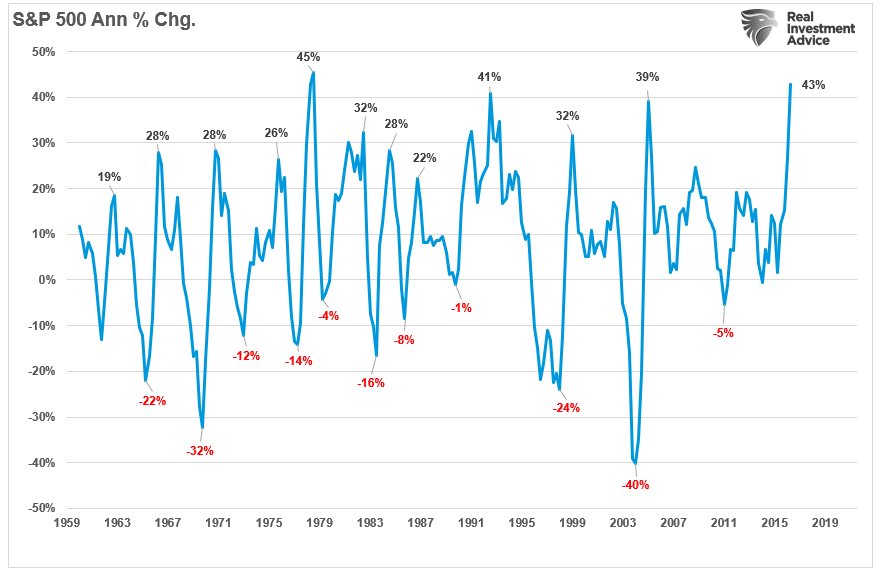
Since the pandemic-driven shutdown, there has been a flood of liquidity into the financial system. In the short term, that liquidity supports economic growth, the surge in retail sales, and the explosive recovery in corporate earnings. That liquidity is also flowing into record corporate stock buybacks, retail investing, and a surge in private equity. With all that liquidity sloshing around, it is of no surprise we have seen a near-record surge in the annualized rate of change of the S&P 500 index.
“However, as stated, there is a dark side to that liquidity. With the Democrats struggling to pass an infrastructure bill, a looming debt ceiling, and the Fed beginning to “taper” their bond purchases, that liquidity will start to reverse later this year. As shown below, if we look at the annual rate of change in the S&P 500 compared to our “measure of liquidity” (which is M2 less GDP), it suggests stocks could be in trouble heading into next year.”
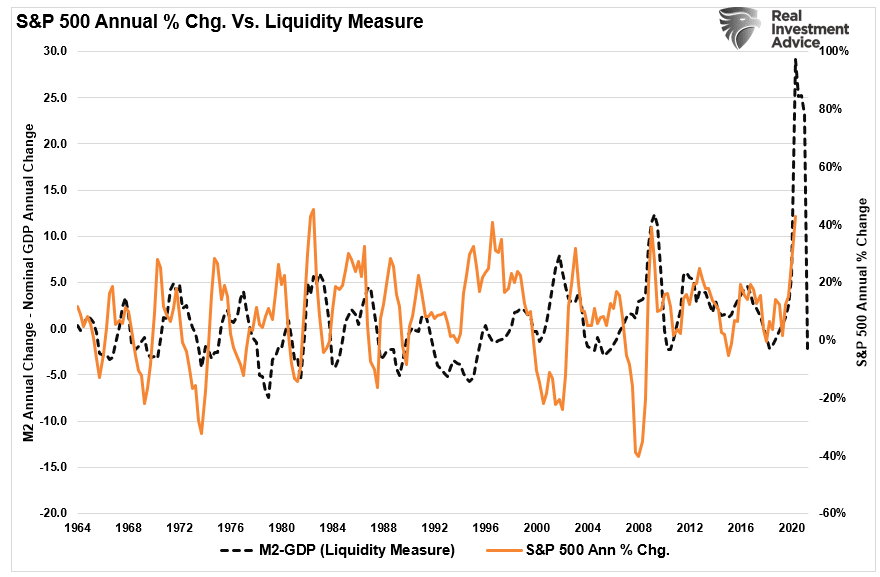
While not a perfect correlation, it is high enough to pay attention to at least. With global central banks cutting back on liquidity, the Government providing less, and inflationary pressures taking care of the rest, it is worth considering increasing risk-management practices.
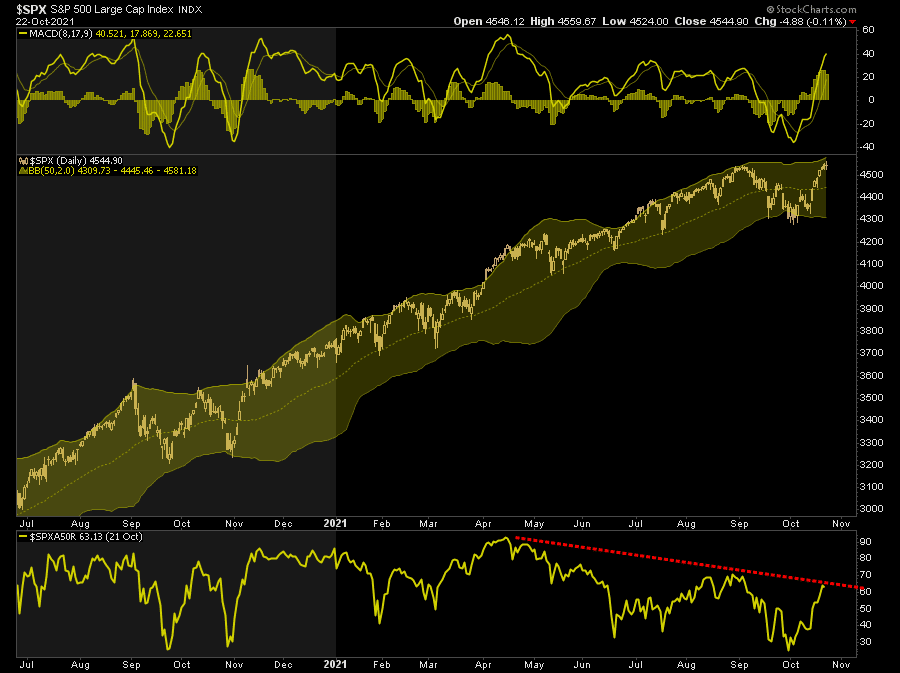
3) Bad Breadth & Volume
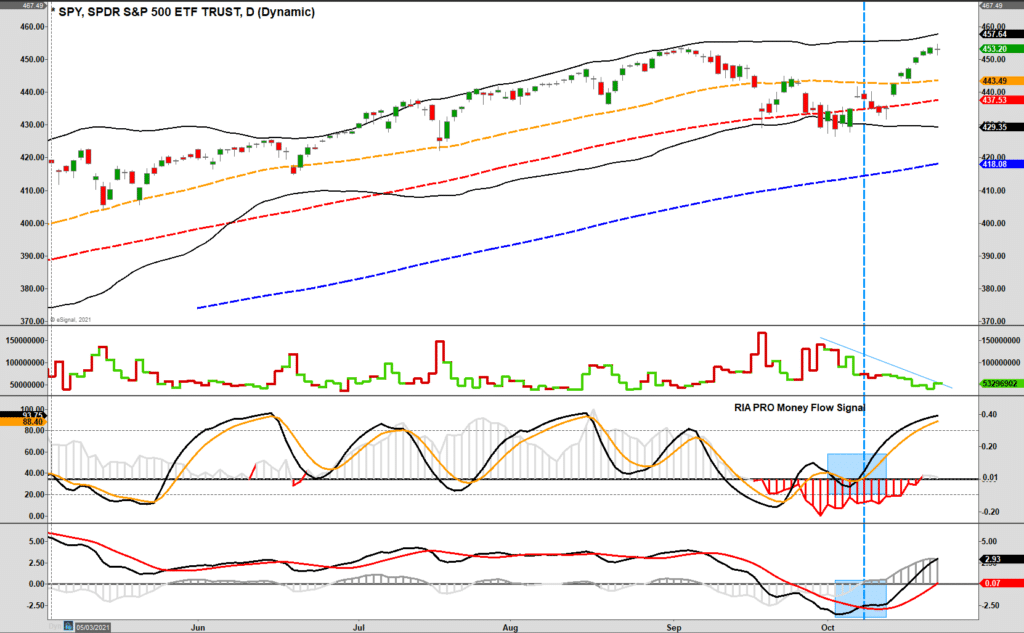
In the very short term, despite the bullish market rally, the technical backdrop remains exceptionally weak. However, to expand on a point from last week, breadth remains dismal, with only 60% of stocks above their respective 50-dma even though the index is at all-time highs.
(Click on image to enlarge)
Moreover, while our “money flow buy signal” reversed to previous highs, volume dissipated sharply during the advance. Such suggests that “commitment” to the market rally remains lacking, and liquidity is thin.
(Click on image to enlarge)
Plenty Of Risk, Limited Reward
While anything is possible in the near term, complacency has returned to the market very quickly. As noted, while investors are very bullish, there are numerous reasons to remain mindful of the risks.
- Earnings and profit growth estimates are too high
- Stagflation is becoming more prevalent
- Inflation indexes are continuing to rise
- Economic data is surprising to the downside
- Supply chain issues are more persistent than originally believed.
- Inventory problems continue unabated
- Valuations are high by all measures
- Interest rates are rising
Furthermore, as noted above, there is limited upside as the annual rate of change in the market declines.
So what do you do?
As discussed last week, we believe additional equity exposure gets warranted due to the bullish case. However, the longer-term dynamics are bearish.
For now, we remain optimistic about the markets due to liquidity, seasonality, and bullish sentiment. However, we remain concerned about the broader macro risks, which keep us cautionary. Therefore, it is crucial to stay unemotional and focus on managing your portfolio.
Such is why focusing on “risk controls” in the short-term, and avoiding subsequent significant draw-downs, will allow the long-term returns to take care of themselves. The following are the “control boundaries” under which we operate.
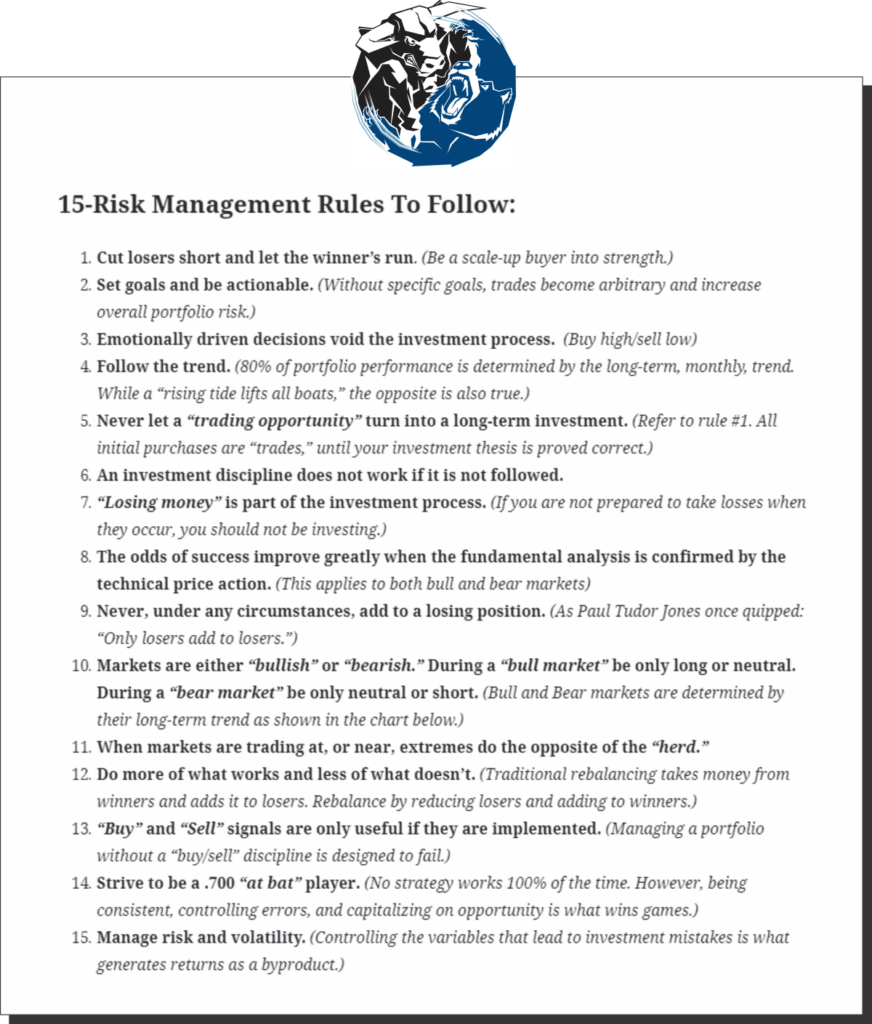
Everyone approaches money management differently. Our process isn’t perfect, but it works more often than not.
The important message is to have a process that can mitigate the risk of loss in your portfolio.
Does this mean you will never lose money? Of course, not.
The goal is not to lose so much money you can’t recover from it.
Disclaimer: Click here to read the full disclaimer.


