
Technically Speaking: S&P 3750. Is It The Light, Or A Train?
Mentally, it has been a challenge to marry a market challenging all-time highs against a backdrop of weaker earnings, falling profits, surging unemployment, and a recessionary economy. Yet, here we are. While the bulls have set S&P targets to 3750 over the next 12-months while bearish signals persist. For investors, it will be the difference in determining the “light” from the “train.”
As discussed in “Bulls Chant Into A Megaphone,”
“A breakout of the consolidation range, which was capped by the June highs, would put all-time highs into focus.”
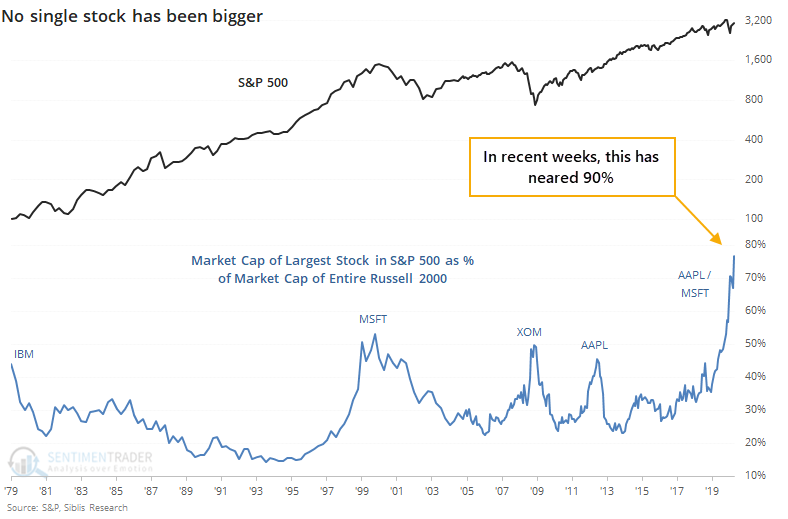
Of course, we also discussed the importance of the issue of the “capitalization effect” on the market’s advance, mainly since Apple and Microsoft make up such a significant weight. As noted by Sentiment Trader last week:
“The most significant stock in the U.S. and nearly the world, Apple, keeps powering higher. At the end of June, the value of Apple alone was almost 80% of the Russell 2000 index’s market capitalization. As of today, it’s nearly 90%. Such is astounding – in the past 40 years, no single stock has come close to dwarfing the value of so many other companies. “
Recapping The Math
“Currently, the top-5 S&P stocks by market capitalization (AAPL, AMZN, GOOG, FB, and MSFT) make up the same amount of the S&P 500 as the bottom 394 stocks. Those same five also comprise 26% of the index alone. “
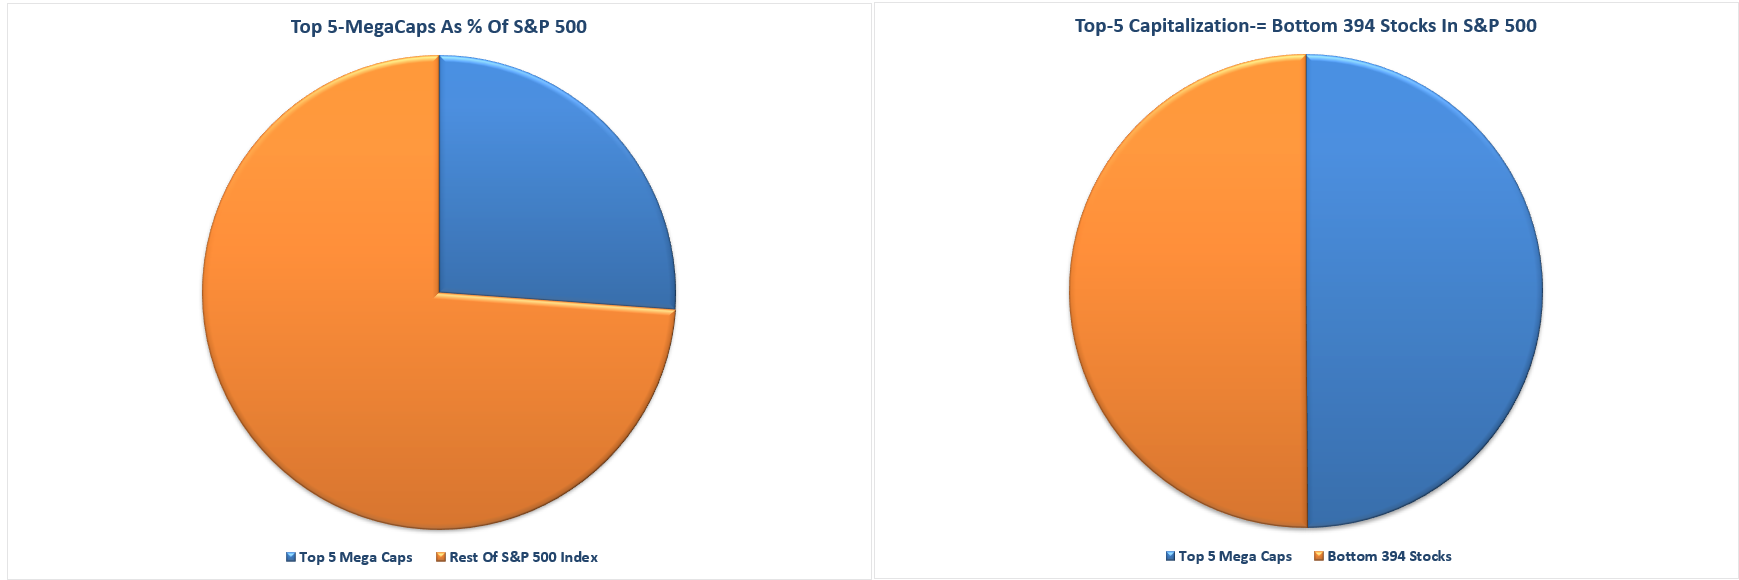
“What investors are missing is that the top-5 stocks are distorting the movements in the overall index.
Putting $1 into each of the top-5 stocks has the same impact as putting $1 into each of the bottom 394 stocks. Such is not a true representation of either the market or the economy.
As we have noted recently, if you own anything OTHER than those top-5 stocks, your portfolio is likely underperforming the market this year.”
The distortion in the markets caused by the flows into the Mega cap stocks will most certainly be a problem. While investors have chased markets higher, these Megacaps will eventually also lead the markets lower.
The question, as always, is the timing and catalyst, which eventually reverses the money flows.
In the meantime, the question is, what is the most logical next target for the S&P 500 if bulls can achieve new “all-time” highs?
Bulls Target 3750
Technical analysis works well when there are defined “knowns” such as a previous top (resistance) or bottom (support) from which to build analysis. However, when markets break out to new highs, it is becomes much more of a “wild @$$ guess” or “WAG.”
Lately, the bulls are running amok trying to predict how much higher the bull market can go. As noted on CNBC:
“We may stall here for a while into the fall, … but I think you’re going to get a rocket ship coming in the fall. I think the S&P is going to trade out above 4,000.” – Jeffrey Saut
When discussing the current “risk/reward ranges,” , 4000 was one of the targets discussed. To wit:
“With the markets closing just at all-time highs, we can only guess where the next market peak will be. Therefore, to gauge risk and reward ranges, we have set targets at 3500, 3750, and 4000 or 4.4%, 12.2%, and 19.5%, respectively.”
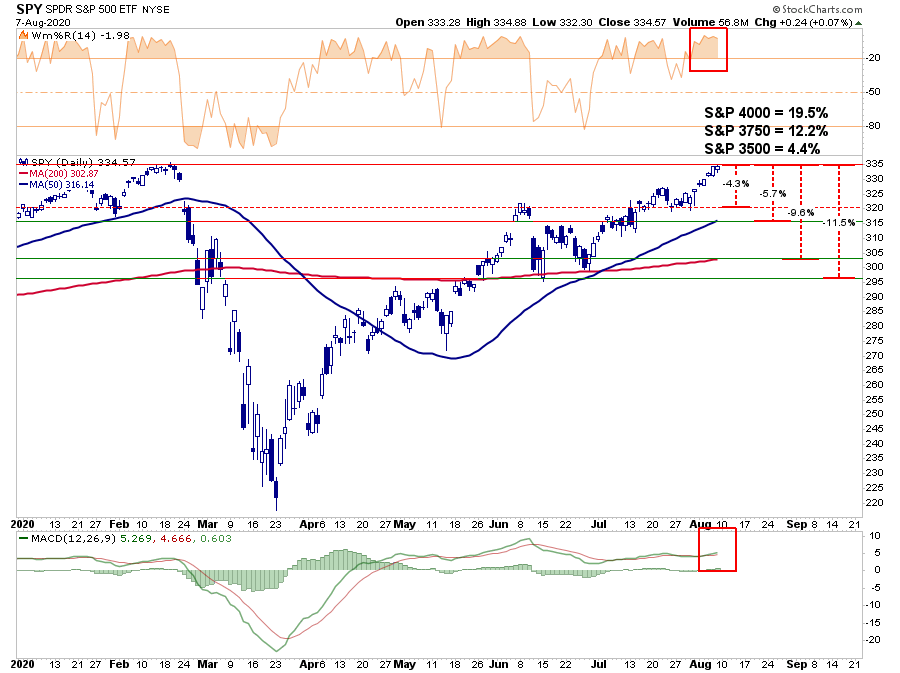
“Given there is no good measure to justify upside potential from a breakout to new highs, you can personally go through a lot of mental exercises. While there is certainly a potential the market could rally 19.9% to 4000, it is also just as reasonable the market could decline 22.2% test the March closing lows.
Just in case you think that can’t happen, just remember no one was expecting a 35% decline in March, either.”
No Real Basis For 4000
The problem with calls for “S&P 4000” is there is no technical or fundamental basis for the assumption.
From a fundamental perspective, if we assume current 2021 estimates are correct, the market will be trading at 26x forward reported earnings. However, given estimates are regularly 30% too high, forward reported earnings will be closer to $130/share leaving valuations at 30x.
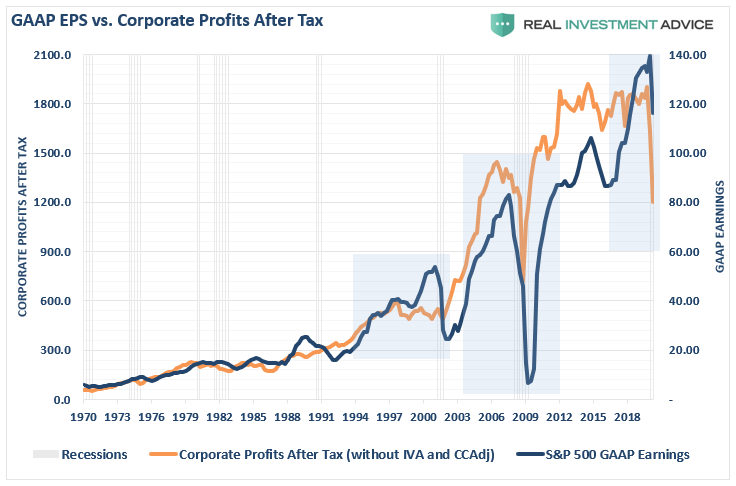
Valuations may not seem to matter currently. However, if the economy continues to lag, and employment and wages weaken, they will. Corporate earnings and profits are going to become more critical. Already, the deviation between the market and corporate profits is at extremes. As with all extremes, an eventual reversion completes the cycle.
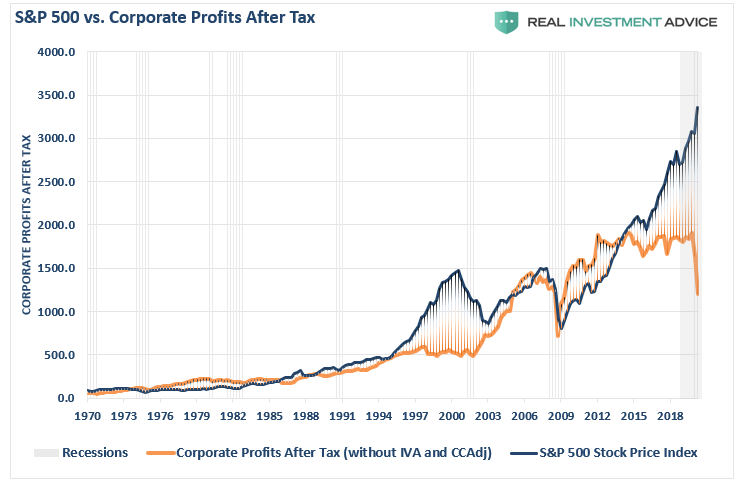
Furthermore, given the depth of the profits decline, it is improbable that earnings will remain at these levels and not worsen.
Importantly, while “valuations” may not seem to matter at the moment, they always, without exception, eventually do.
Technical Deviations
Secondly, the technical trends don’t support S&P 4000 either.
From the 2009 lows, the S&P has traded withing a fairly defined trend channel, as shown below. The upper bullish trend line, which coincides with the February 2020 market peak and the polynomial trend line, suggests 3750 as the next target.

As noted above, such would suggest a 12.2% advance from Friday’s close. While Saut’s 4000 number sounds excellent, such would violate trends that have existed for 11-years.
Furthermore, 3750, much less 4000, is going to stretch the deviation from the long-term bullish trendline (lower line) to more extreme levels. The last time the market reached this extreme was in February of this year. It is also notable that 3750 also intersects with the accelerated trendline from the 2016 lows.
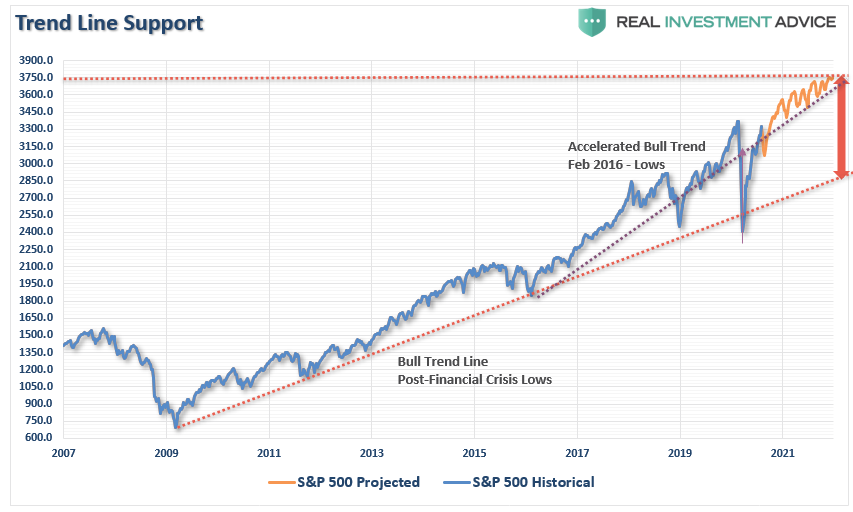
As noted previously, trend lines and moving averages tend to act as “gravity.” The further away from the trendline, the market becomes, the greater the pull becomes.
Warning Signs
It the short-term, the market seems to be headed higher. However, it is worth remembering that every previous peak of the market since 2016 has been from “all-time” highs.
With the market at all-time highs, there are numerous warning signs of excess built up, which could trigger a reversion.
- Low participation
- An extremely low put/call ratio (speculative excess)
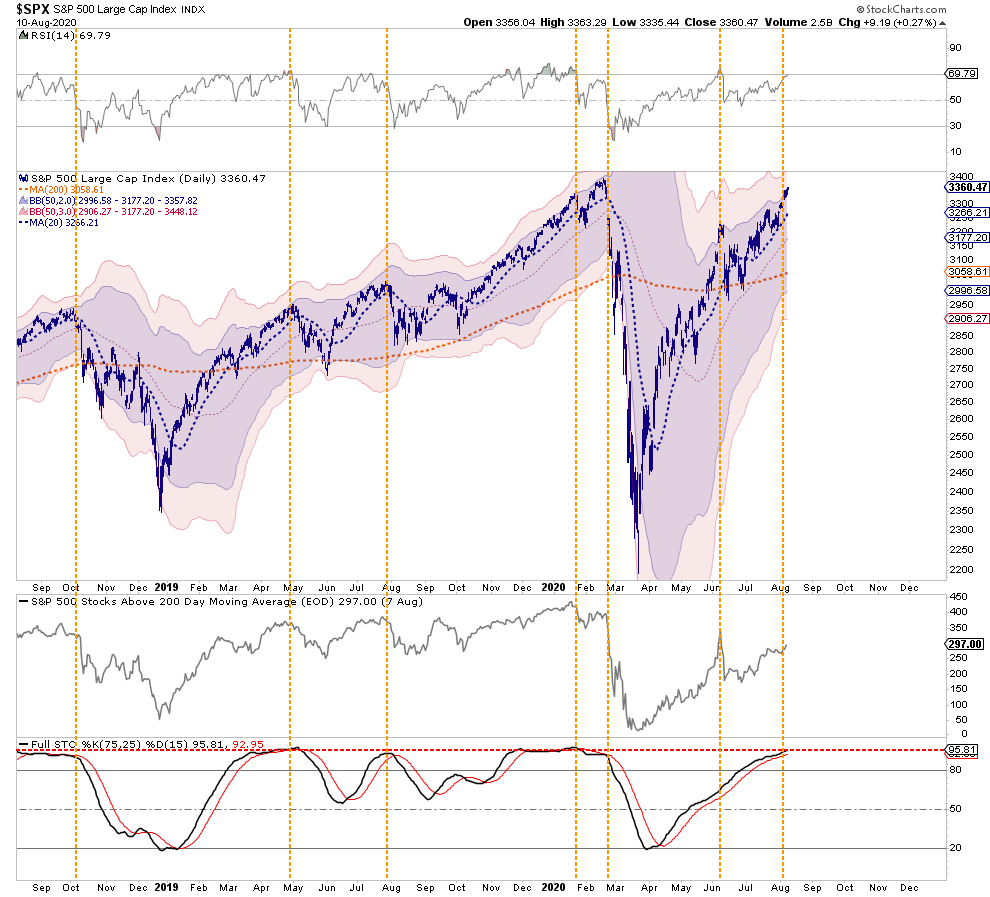
- Markets trading 2- and 3- standard deviations above their means.
- Large deviations from respective 200-dma’s
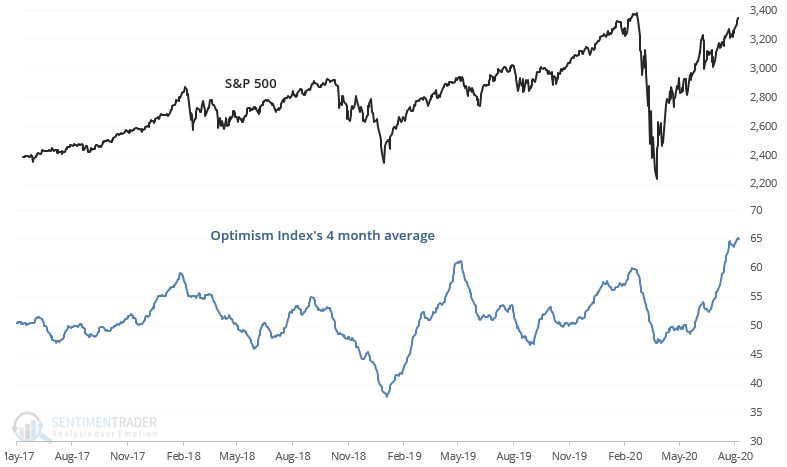
- High levels of investor optimism (chart below)
- A historical deviation between value and growth.
- A high level of equity allocations
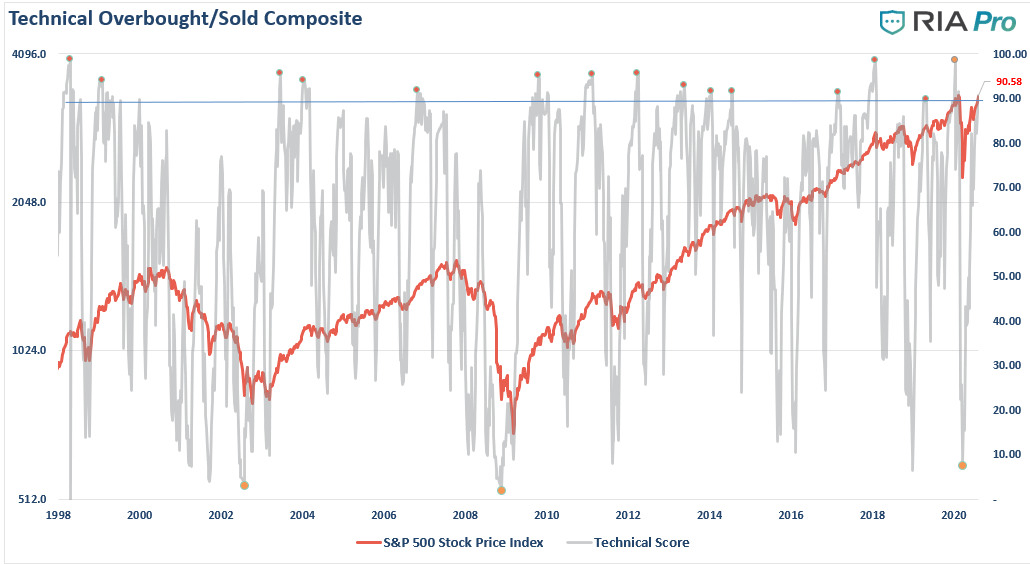
- Technical extremes (RIAPro technical gauge below)
Currently, the evidence is mounting that markets are reaching the limits of the current move. By itself, these signs reflect the prevailing extremely bullish attitude of market participants. However, much like an explosive, at some point, an unexpected, exogenous event occurs. That event is the catalyst which ignites the chain reaction. The ensuing “reversion” to the trend catches overly confident “bulls” off guard.
Light At The End Of The Tunnel
The problem for investors currently is there is precious little that hasn’t already been fully priced into the market.
- A full economic recovery
- A return to full unemployment
- More stimulus
- Low bond yields
- No recession
- A return to pre-pandemic earnings levels
The problem comes when one, or more, of those things, fails to occur. Paul Singer of Elliot Management had a significant point in this regard:
“We cannot think of another time when the basic terms and conditions of making – and more to the point keeping – money were more challenged. The planet’s central bankers seem desperate to hold up all stock markets and keep them from tumbling to the floor. They think that’s the way to run monetary policy and, actually, fiscal policy as well. The fact that public policy is on a slippery slope to monetary ruin – and the slide is steepening – escapes their limited reasoning capability.
They appear to think that so long as there is a model or theory to support their policies and no immediate catastrophe, they can keep doing it. The political winds are hot and fierce, blowing in the face of economic freedom and profits. There has never been a time when it was more important to protect the downside, so that at least nominal capital values are preserved.
However, the reason capital doesn’t just build and build (given all the geniuses in the investment world) is simple: With normal approaches to money management, the march up in compounded value gets interrupted by big losses or wipeouts at infrequent, unpredictable intervals. Sometimes one can “see the train a’comin'”
However, most of the time, investors don’t see the “train,” but mistakenly believe it’s the “light at the end of the tunnel.”
Conclusion
Price action still confirms relative weakness as shown by the percentage of stocks above the 200-dma. Furthermore, the recent rally was primarily focused in the largest capitalization-based companies. These indications suggest market action remains reminiscent of a market topping process rather than the beginning of a new leg of the bull market. With the market trading, 3-standard deviations above its 50-dma and very overbought, such was the same setup we saw at the beginning of the year.
I am not suggesting that the market is on the precipice of another 35% plunge. I am suggesting that the current market and economic dynamics are not as stable as they were following previous market corrections.
The challenge for investors will be the navigation of the markets to ensure they see the “train,” and not the “light.”
Importantly, while the “always bullish” media tends to dismiss warning signs as “just being bearish,” such unheeded warnings have been detrimental.
Complacency is not a great option for managing your capital.
Disclaimer: Real Investment Advice is powered by RIA Advisors, an investment advisory firm located in Houston, Texas with more than $800 million under management. As a team of certified and ...
more

