
Technically Speaking: Selling The 200 Day Moving Average

This past weekend, I recommended taking action as the market approached our target zone of resistance. To wit:
Nearly a month later, and we are watching the “pathways” play out very close to our “guess.”
Chart updated through Monday’s close
(Click on image to enlarge)

“More importantly, we continue to trace out the ‘reflexive rally’ path. However, my guess is we are not likely done with this correction process as of yet. From a very short-term perspective, the backdrop has improved to support a continued reflexive rally next week.
The problem which now arises is the short-term oversold condition, which supported the idea of a “reflexive rally,” has largely been exhausted. Furthermore, the now declining 50-dma, which has also crossed below the 75 and 100-dma as well, suggests that some variation of ‘Option 2’ noted above is likely.
Given the recent rally, and overbought conditions, we are using this rally to follow our basic portfolio management rules. As the market approaches the “neighborhood” of the 100-dma we are:
- Selling laggards and raising cash.
- Rebalancing remaining long-equity exposure to comply with portfolio target weightings
- Rebalancing the total allocation model to comply with target exposure levels.“
Note that we are simply rebalancing risks at these levels – not selling everything and going to cash. There is an early “buy signal” combined with the potential for “earnings season” to support asset prices. The goal here is simply to rebalance risks and let the market “confirm” it has re-established its bullish bias.
A Simple Method Of Risk Management
Ben Carlson recently wrote an interesting piece on selling out of the market when it breaks the 200-day moving average (dma). To wit:
“As the legendary hedge fund manager Paul Tudor Jones said:
‘The whole trick to investing is: ‘How do I keep from losing everything?’ If you use the 200-day moving average rule, then you get out. You play defense, and you get out.’
Investors need to be careful about blindly following any indicator that gets them out of the market. There is no guarantee that markets are headed for a crash just because this trend was broken. There are no market timing signals that work every single time, so there’s no telling if the current correction will morph into an all-out bear market.
There are no silver bullets in the stock market. The 200-day moving average will be breached at some point during the next bear market. That’s a given. But it’s not a given that the most recent signal can assure investors a bear market is right around the corner. The majority of the time corrections don’t turn into crashes. History tells us that a false breakdown is a higher-probability event that further deterioration in the markets.”
While there is nothing “incorrect” contained in the article, in my opinion, Ben dismisses the two most important points about the investing and the portfolio management process – capital preservation and time.
The point of using any method of portfolio risk management is to have a strategy, process and discipline to avoid excessive levels of capital destruction over time. Ben is absolutely correct when he states there are no “silver bullets,” but “false positives” from time to time are a relatively small price to pay to avoid the probability of a major “mean reverting event.”
“In fact, the S&P 500 has crossed the 200-day moving average 150 times since 1997. If this were a perfect signal, that would imply 75 separate market corrections.
In reality, in that time, there were only 11 market corrections when stocks fell 10 percent or worse. That means the majority of the time when the S&P 500 went below the 200-day it was a head fake, when investors sold out of the market only to buy back higher.”
Let’s take a closer look.
The chart below is $1000 invested in the S&P 500 in 1997 on a capital appreciation basis only. The reddish line is just a “buy and hold” plot while the blue line is a “switch to cash” when the 200-dma is broken. Even with higher trading costs, the benefit of the strategy is readily apparent.
(Click on image to enlarge)

It’s Not The Method, It’s You
To Ben’s point, what happens to many investors is they get “whipsawed” by short-term volatility. While the signal gets them out, they “fail” to buy back when the signal reverses.
“I just sold out, now I’m supposed to jump back in? What if it crashes again?”
The answers are “yes” and “it doesn’t matter.” That is the just part of the investment strategy.
But such is incredibly hard to do, which is why the majority of investors fail at investing over time. Adhering to a discipline, any discipline, is hard. Even “buy and hold,” fails when the “pain” exceeds an individuals tolerance for principal loss.
Investing isn’t easy. If it was, everyone would be rich. They aren’t because of the repeated emotional driven investment mistakes over time. This is why every great investor throughout history has had a basic philosophy of “buy low, sell high.” Of course, you can’t buy low, if you didn’t sell high to begin with?
While there are many sophisticated methods of handling risk within a portfolio, even using a basic method of price analysis, such as a moving average, can be a valuable tool over longer-term holding periods.
Will such a method ALWAYS be right? Absolutely not.
Will such a method keep you from losing large amounts of capital? Absolutely.
Let’s go back further in time. The chart below is WEEKLY data to reduce price volatility and smooth out the signals over time. What becomes readily apparent is that using a basic form of price movement analysis can provide a useful identification of periods when portfolio risk should be REDUCED. Importantly, I did not say risk should be eliminated; just reduced.
(Click on image to enlarge)
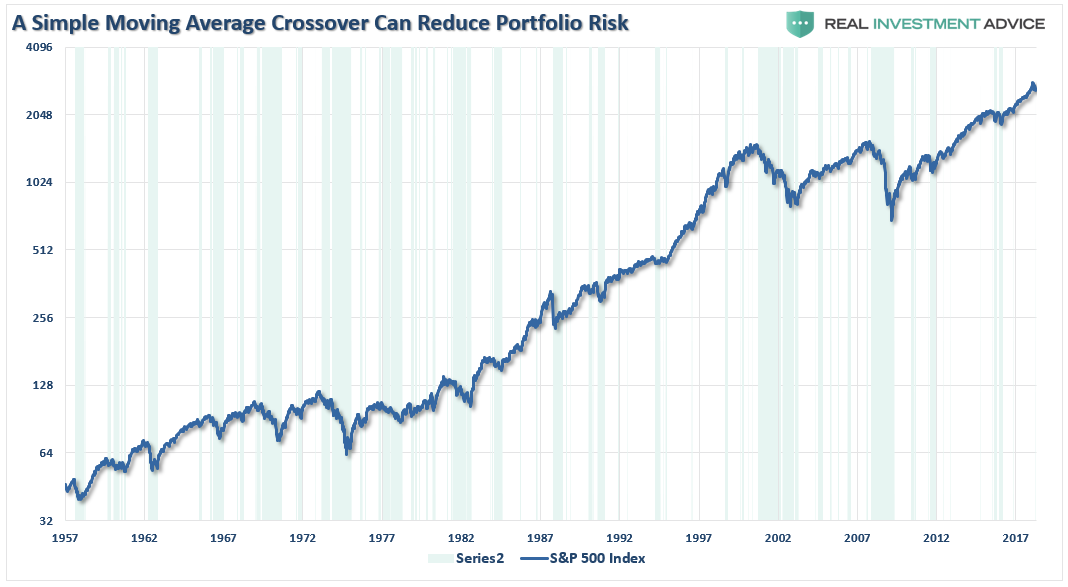
Again, I am not implying, suggesting or stating that such signals mean going 100% to cash. What I am suggesting is that when “sell signals” are given it is the time when individuals should perform some basic portfolio risk management such as:
- Trim back winning positions to original portfolio weights: Investment Rule: Let Winners Run
- Sell positions that simply are not working (if the position was not working in a rising market, it likely won’t in a declining market.) Investment Rule: Cut Losers Short
- Hold the cash raised from these activities until the next buying opportunity occurs. Investment Rule: Buy Low
By using some measures, fundamental or technical, to reduce portfolio risk by taking profits as prices/valuations rise, or vice versa, the long-term results of avoiding periods of severe capital loss will outweigh missed short-term gains. Small adjustments can have a significant impact over the long run.
This is shown in the chart below. There is always a big difference between market prices and the impact of losses on an actual dollar-based portfolio. By using a simple method to avoid losses, the differential over the long-term on $1000 is quite significant. (Chart below is capitalization only for example purposes.)
(Click on image to enlarge)
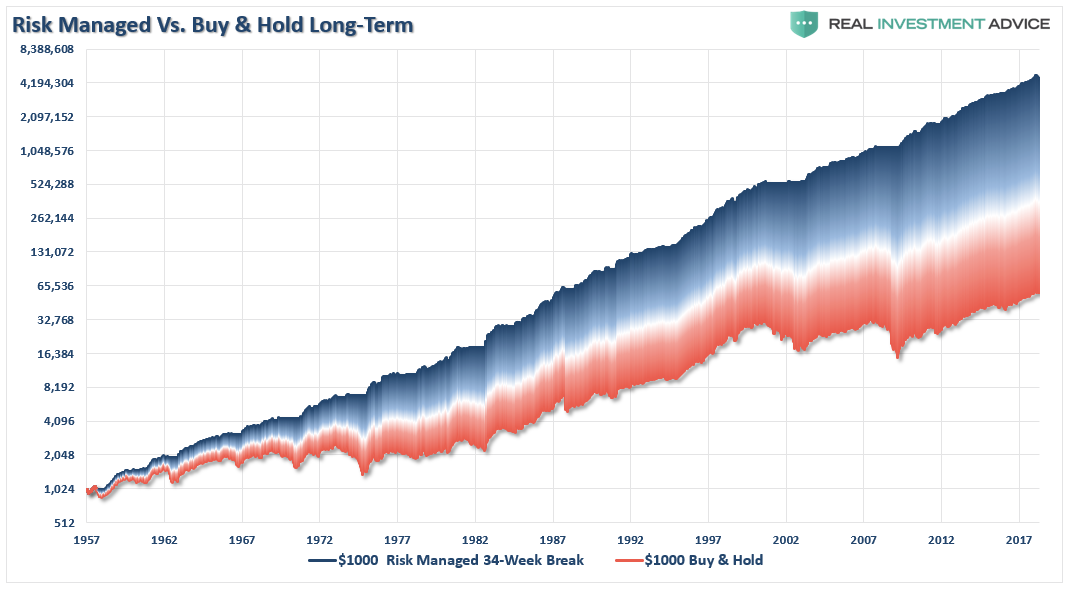
As shown in the chart above, this method doesn’t avoid every little twist and turn of the market, and yes, were many “head fakes” along the way. But what it did do was avoid a bulk of the major market reversions and inherent capital destruction.
Yet, despite two major bear market declines, it never ceases to amaze me that investors still believe that somehow they can invest in a portfolio that will capture all of the upside of the market but will protect them from the losses. Despite being a totally unrealistic objective this “fantasy” leads to excessive risk taking in portfolios which ultimately leads to catastrophic losses. Aligning expectations with reality is the key to building a successful portfolio. Implementing a strong investment discipline, and applying risk-management, is what leads to the achievement of those expectations.
Conclusion
Chasing an arbitrary index that is 100% invested in the equity market requires you to take on far more risk that you realize. Two massive bear markets over the last decade have left many individuals further away from retirement than they ever imagined. Furthermore, all investors lost something far more valuable than money – TIME needed to achieve their goal.
While I have stated this many times before, it is worth reiterating that your portfolio should be built around the things that matter most to you.
- Capital preservation
- A rate of return sufficient to keep pace with the rate of inflation.
- Expectations based on realistic objectives.(The market does not compound at 8%, 6% or 4% every year, losses matter)
- Higher rates of return require an exponential increase in the underlying risk profile. This tends to not work out well.
- You can replace lost capital – but you can’t replace lost time. Time is a precious commodity that you cannot afford to waste.
- Portfolios are time-frame specific. If you have a 5-years to retirement but build a portfolio with a 20-year time horizon (taking on more risk) the results will likely be disastrous.
In hindsight, it is easy to see that investors should have been out of the market in 2001 and 2008. However, remember just prior to those two major market peaks the Wall Street mantra was the same then, as it is today:
“This time is different.”
The problem, as always, is trying to determine the difference between a “false positive” and a “valid signal.” By the time you know for sure, it is often too late.
Disclosure: The information contained in this article should not be construed as financial or investment advice on any subject matter. Real Investment Advice is expressly disclaims all liability in ...
more

