
Technically Speaking: Sell Today? Risk Vs. FOMO
The market is downright bullish.
There is little reason to argue the point given the bullish trend since the December 24th lows. Of course, such is not surprising given the Fed’s dovish turn from tightening monetary policy to quietly putting the “punch bowl” back on the table.
But yet, this rally is occurring at a time where Europe’s earnings growth rates for the just reported Q4-period stands at a -1% annualized, which is the lowest since Q2-2016, and the U.S. is on the verge of an earnings recession as well as declining economic data.
Something doesn’t quite jive. As Morgan Stanley’s Mike Wilson noted (via Zerohedge):
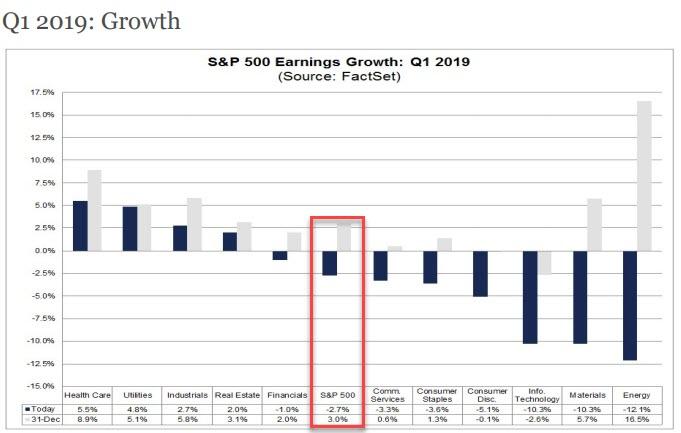
“The US is also about to enter an earnings recession, ironically after one of the strongest years for corporate profits on record, the picture of American companies is not much better. Not only is an above average number of companies issuing negative EPS guidance for Q1 2019 (of the 93 companies providing official guidance, 68 or 73%, have issued negative EPS guidance), but consensus EPS for Q1 is now deep in the red. According to Factset, the average Wall Street forecast now projects Q1 earnings per share to decline by 2.7% Y/Y, worse than a consensus -0.8% forecast drop three weeks ago, and starkly lower than the +3% EPS growth expected for Q1 at the start of the year.”
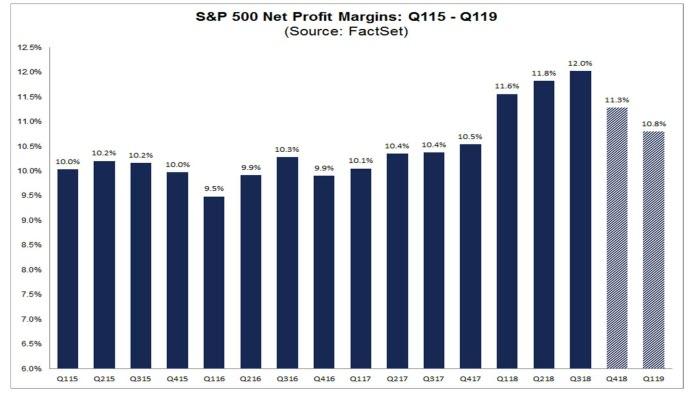
“In a troubling twist, this EPS drop is taking place even as companies continue to buyback record amounts of stock (according to BofA’s client tracker, corporate repurchases are running 98% YTD compared to the same period last year when as a reminder, total announce buybacks topped a record $1 trillion). More perplexing is that the EPS drop will take place even as S&P500 revenue is still expected to post a solid 5.2% Y/Y growth, suggesting that profit margins peaked some time in 2018 and are now declining, as the following chart from FactSet shows.”
As noted, the economic data is also deteriorating markedly in recent weeks as shown in the latest GDP NowCast from the Atlanta Fed.
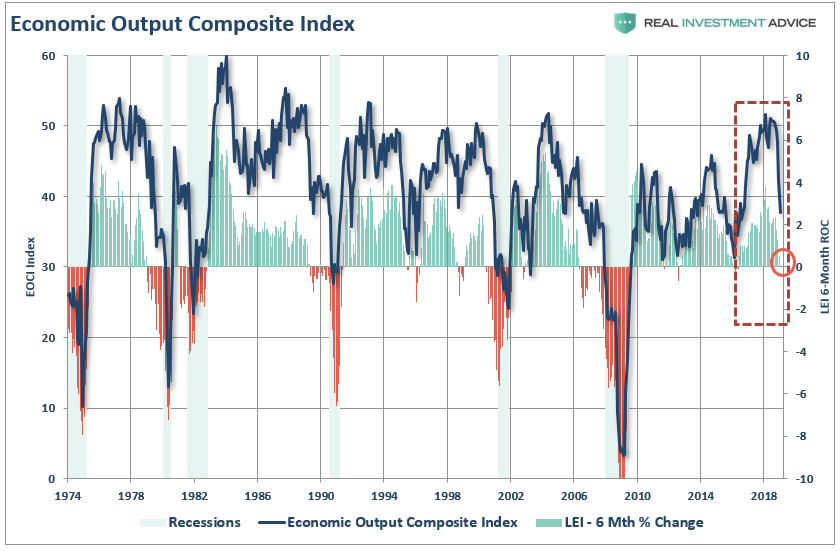
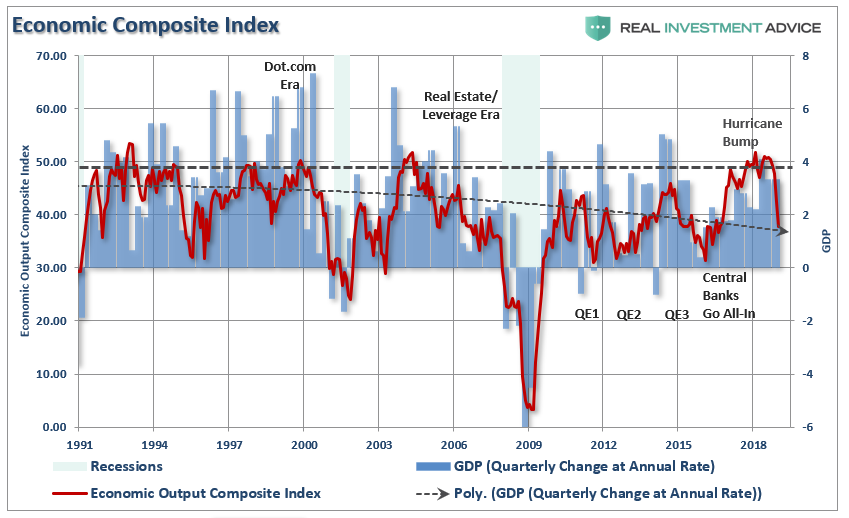
Of course, if you have been reading our missives, this drop in the forecast was already evident by the sharp decline in our composite EOCI index.
(The index is comprised of the CFNAI, Chicago PMI, ISM Composite, All Fed Manufacturing Surveys, Markit Composite, PMI Composite, NFIB, and LEI)
As shown, over the last six months, the decline in the LEI has been sharper than originally anticipated. Importantly, there is a strong historical correlation between the 6-month rate of change in the LEI and the EOCI index. The downturn in the LEI predicted the current economic weakness back in July of 2018 and suggests the data will likely continue to weaken in the months ahead. As of January, the 6-month percentage change was at ZERO and will likely go negative in the next quarter.
The next chart is the EOCI index versus GDP. As we have noted several times previously, the bump in economic growth was from 3-massive hurricanes and 2-devastating wildfires in late 2017. The effect of those natural disasters has quickly dissipated as expected and GDP growth, which is a lagged indicator, will quickly follow.
But despite the underlying economic and fundamental data, the markets have surged back to extremely overbought, extended, and deviated levels.
The chart table below is published weekly.
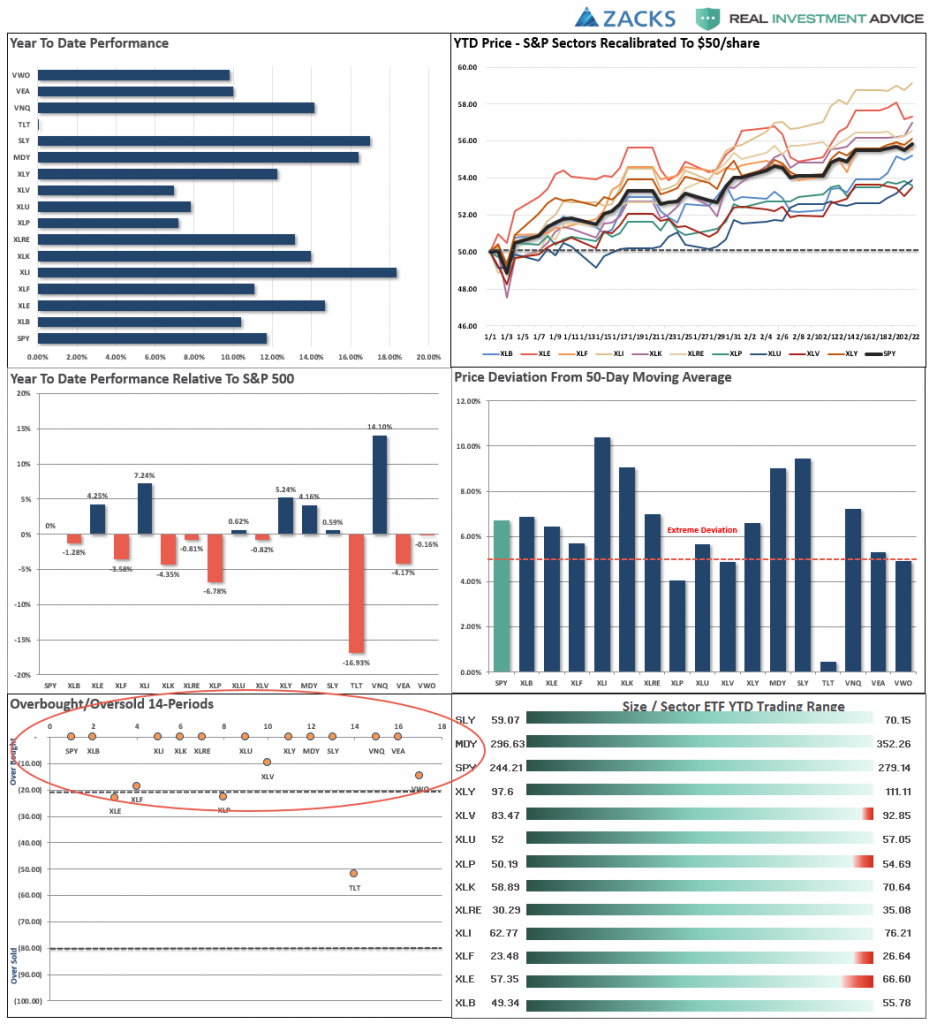
You will note that with the exception of bond prices, every market and sector is more than 5% above its 50-day moving average and year-to-date performance is pushing more historic extremes both in price and in extreme overbought conditions.
Those overbought conditions are more prevalent in the chart below. On virtually every measure, markets are suggesting the fuel for an additional leg higher in assets prices is extremely limited.
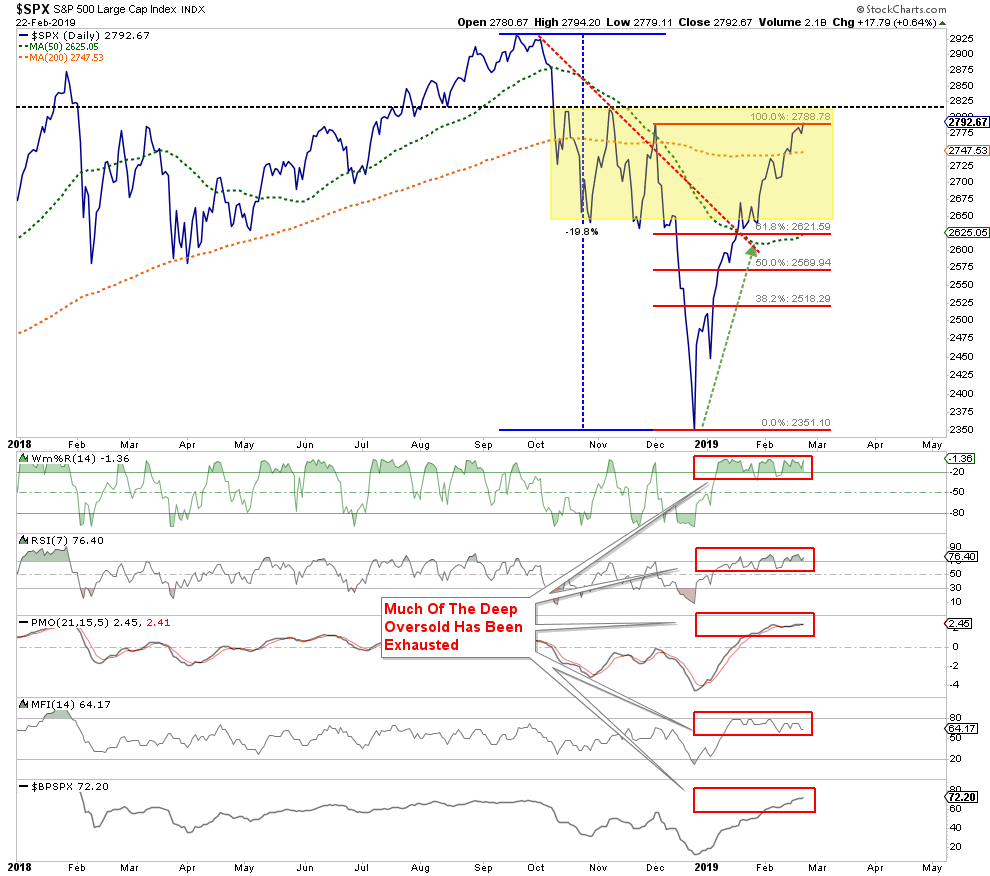
The markets are not immune to the “laws of physics.” While the price action is indeed bullish in the short-term, the shorter-term moving averages act like “gravity” on prices. Given the current extension and deviation above the 50-dma the odds of a pullback, before a continued advance, is a high probability.
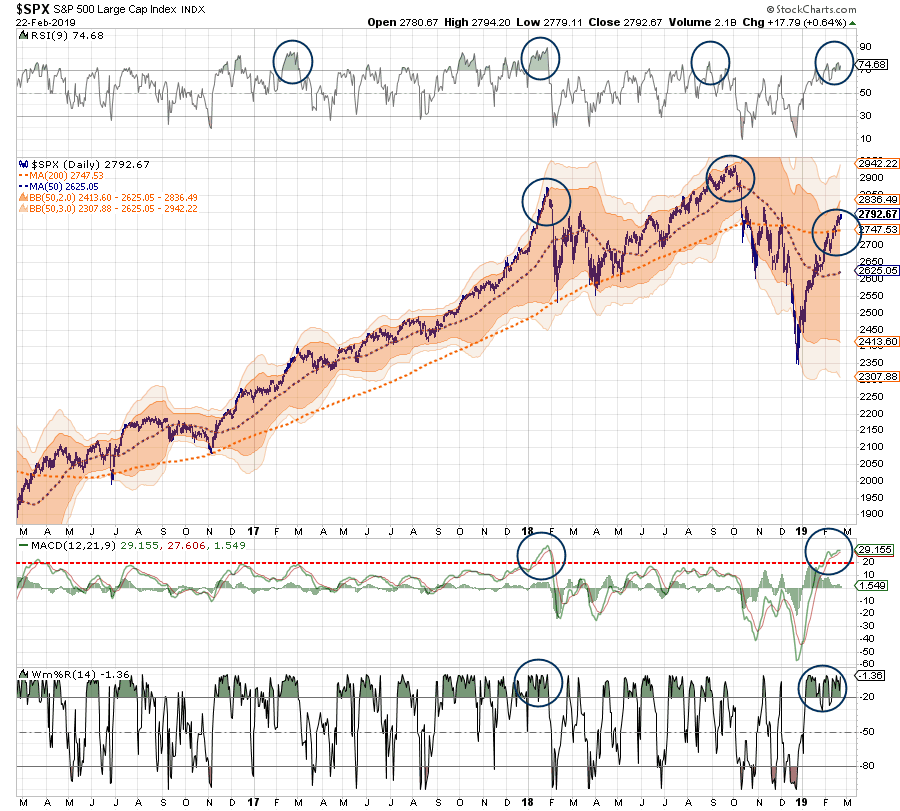
The same is shown in the chart below. Note the current overbought conditions are the same has they have been previously just prior to corrective action.
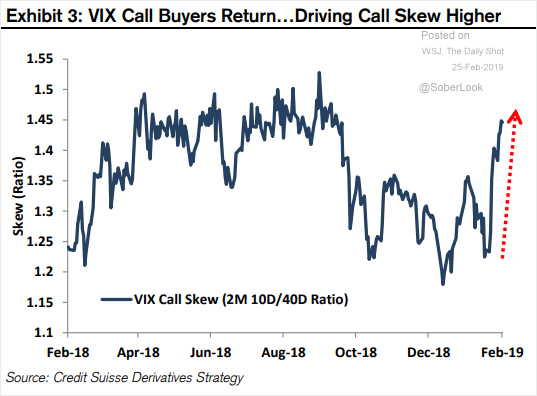
Furthermore, investor complacency has quickly returned to the markets despite the fact investors just took a beating last year.
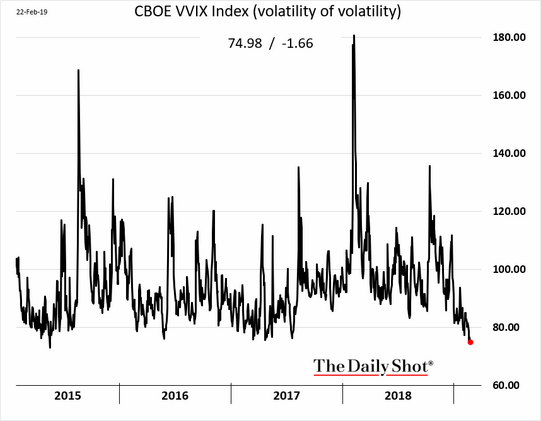
Importantly, record levels of complacency have been previously associated with short-term market peaks rather than the beginnings of bull markets. Unsurprisingly, VIX call buyers have gone on a shopping spree to lock in profits on recent gains as, despite hopes to the contrary, the risk of a price correction has risen markedly.
Here is the point to all of this.
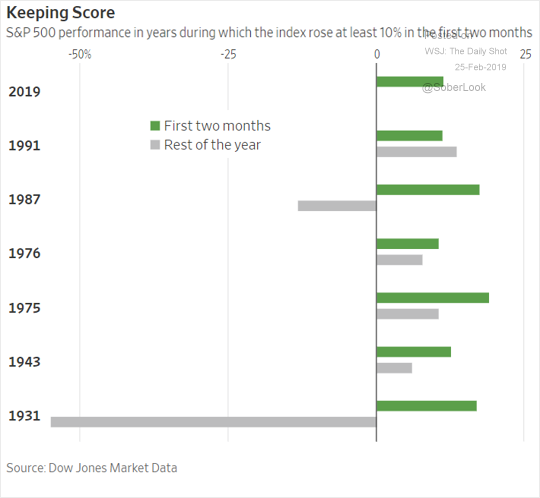
As shown in the table below, it is very likely that if you sold everything today, and went to cash, that you would miss little over the balance of the year. In other words, the bulk of the gains have likely already been made for the year.
“What? I might miss out on a move higher?”
Yes, but at what risk?
Investing is always about measuring risk versus reward. Currently, the risk to investors is a correction over the next couple of months followed by a rally into year end which culminates in a total return which is LESS than where you are today.
I know. That is a hard concept to grasp when the media is telling you to not only stay invested but you better “buy more” now as the “bull market is back.”
I can’t disagree that the long-term trend of the market remains bullish, which is why we continue to have portfolios allocated toward equity risk. As shown below, the market has recently touched on the 3-year moving average confirming the longer-term bull trend of the market. The same occurred in 2015-2016 prior to global central banks leaping into action to flood the system with liquidity in advance of the “Brexit” referendum.
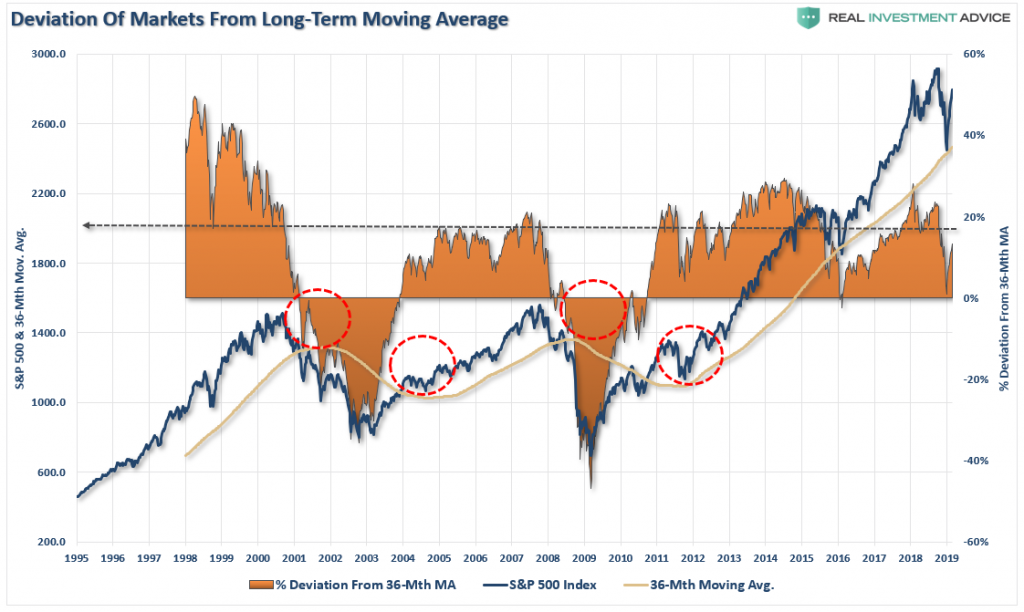
With the current advance already approaching historically high deviations from the long-term mean, again, the risk of a correction greatly outweighs the possibility of a continued advance.
While the intermediate-term market remains bullishly biased, the longer-term monthly dynamics are worrisome. From a purely technical perspective, the monthly backdrop for equities remains bearish and despite the sharp rally over the last two months, the market remains below its long-term bullish trend line. If the current rally fails beneath the long-term trend line, which is being tested now, such has been the hallmark of the change from a bullish to bearish market and suggests much more defensive positioning.
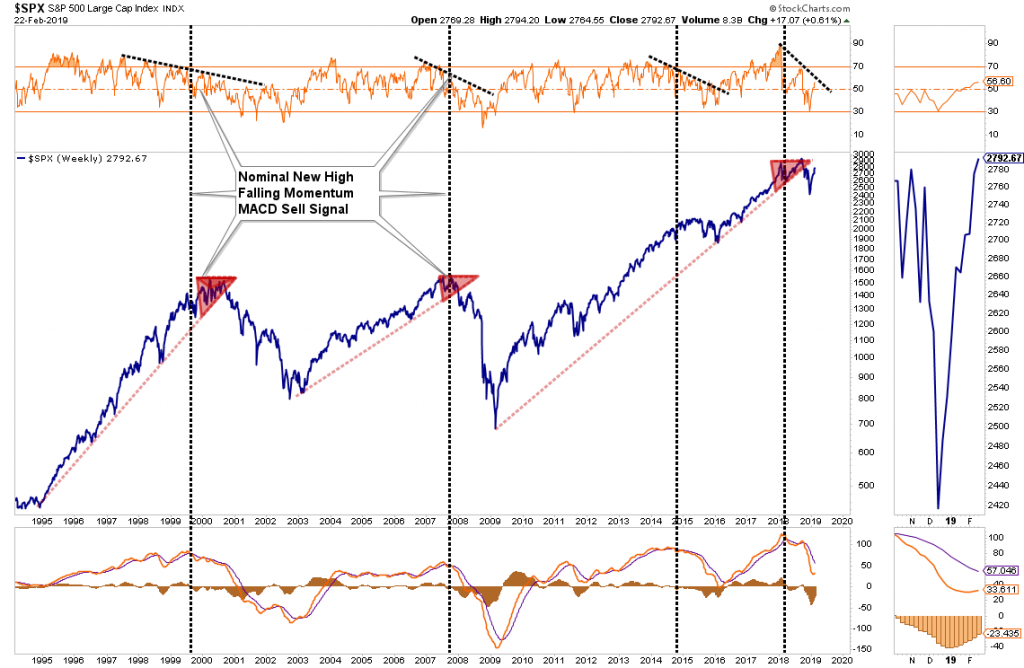
It is also worth noting that on a monthly basis the rally in the market has done little to reverse the declining relative strength of the market (top panel) or the monthly “sell signal” (bottom panel) which both suggest portfolios should remain hedged currently.
“History is replete with examples of major recoveries following big sell-offs, many of which turn out to be head fakes otherwise known as bear market rallies. At the end of the trading day, it’s still fundamentals that should drive investing decisions.”- Danielle DiMartino-Booth
As shown above, I agree with that view which is why, for now, we are holding a higher than normal level of cash. Slightly higher levels of cash in portfolios, not to mention hedges, certainly won’t detract significantly from portfolio performance in the short-term but provide an opportunity to take advantage of panicked sellers later.
Investing is ultimately about understanding the risk to invested capital at any given time. As noted previously, the risk currently outweighs the potential for reward by a significant margin. As Danielle concluded:
“This may be a bear market rally for the ages, but that shouldn’t imply investors should do anything other than rent it. Owning it promises to end in tears.”
RIA PRO subscribers (use code PRO30 for a 30-day free trial)
Lance Roberts is a Chief Portfolio Strategist/Economist for more


