
Technically Speaking: Monthly S&P 500 Chart Update & Review
With June now officially in the books, we can take a look at our long-term monthly indicators to see what they are telling us now.
Does the recent breakout to “all-time highs” mean the bull market is finally back?
Or, is this breakout doomed to failure as the previous breakouts have been?
That’s the answer we all want to know.
However, as longer-term investors and portfolio managers, we are more interested in the overall trend of the market. While it is fundamental analysis derives “what” we buy, it is the long-term “price” analysis which determines the “when” we buy and sell in our portfolio management process.
For us, the best way to measure the TREND of the market is through longer-term weekly and monthly data. Importantly, when using longer-term data, the signals are only valid at the end of the period. It is not uncommon for signals to be triggered and reversed during the middle of the period which creates “false” signals and poor outcomes. Since we are more interested in discerning changes to the overall “trend” of the market, we find monthly indicators, which are slow-moving, tend to reveal this more clearly.
In April of 2018, I penned an article entitled “10-Reasons The Bull Market Ended” in which we discussed the yield curve, slowing economic growth, valuations, volatility, and sentiment. While volatility and sentiment have gone back into complacency, the fundamental and economic backdrop has deteriorated further. Had you heeded our warning then, you could have saved yourself some pain.
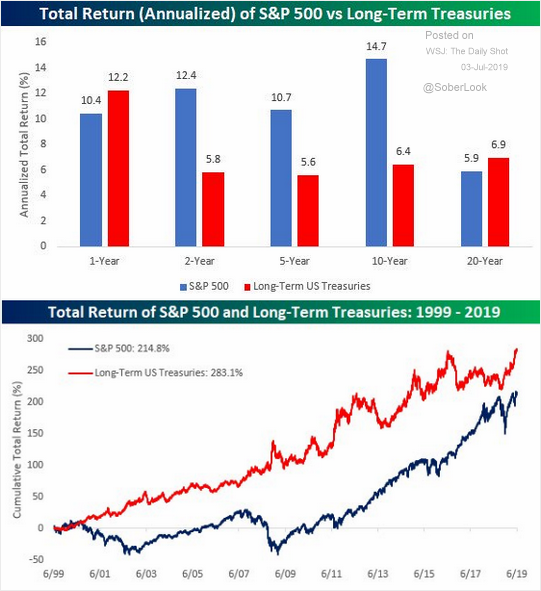
But, if you did hold on, and ride it out, your portfolio is now 4% higher than it was at the peak of the market in January 2018. That is an average return, so far, of 2.67% which is only slightly higher than the yield from a 10-year treasury.
However, bond holders earned a total return of nearly 7% during the same period with much lower volatility.
As I noted in this past weekend’s missive, while the mainstream media and Wall Street prognosticates “stock ownership” as the way to build wealth, you might want to ask bond holders exactly what they missed out on.
Perspective is important.
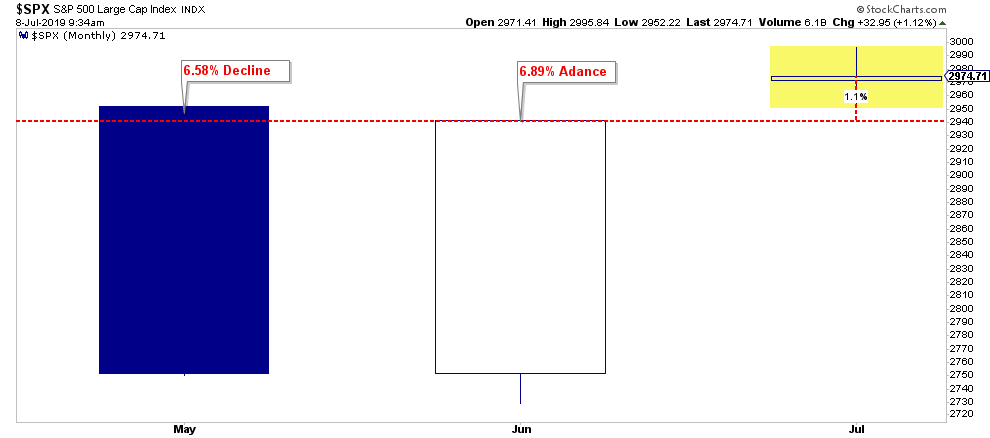
For example, in June, the market rallied 6.89% which was touted as one of the “best June months on record.” While the statement was true, it lost perspective when compared to the May decline of -6.58%,which was also one of the “largest monthly losses” on record. More importantly, the June rally failed to recoup the May losses.
(Fun with numbers: it took a 6.9% advance to repair a 6.58% decline. This is why measuring performance in percentage terms is deceiving.)
As noted, monthly data, while very slow-moving, reveals longer-term signals which can uncover changes to the overall market trend which short-term market rallies can obfuscate.
The chart shows the monthly buy/sell signals stretched back to 1999. As you will see, these monthly “buy” and “sell” indications are fairly rare. During the entirety of that period, only the 2015-2016 signal didn’t evolve into a deeper correction as Central Bank interventions flooded the markets with liquidity to stem the risk of a disorderly “Brexit” and slower economic growth.
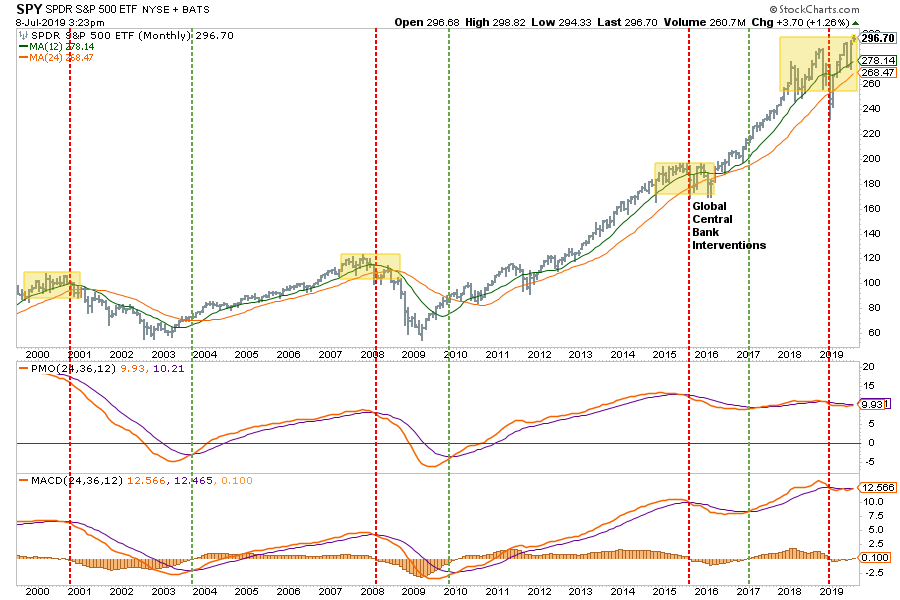
Currently, we are once again facing slower global economic growth, the potential of a disorderly “Brexit,” “trade wars,” an “earnings recession,” “negative yields globally,” a potential bank problem with “Deutsche bank,” and geopolitical upheaval.
Yet markets remain near highs currently hoping “Central Banks” will once again come to the rescue. They may try, but there is a more than significant chance further accommodative measures may have little or no effect. As I noted recently, the Fed is likely “pushing on a string.”
Or, more simplistically, as Doug Kass noted in his daily missive on Monday:
“The markets are underpricing risk.”
With the summer months upon us, when have a tendency to display both weakness and higher levels of volatility, it tends to pay to “err to the side of caution.”
“But this time is different because of ‘_(fill in the blank__’”
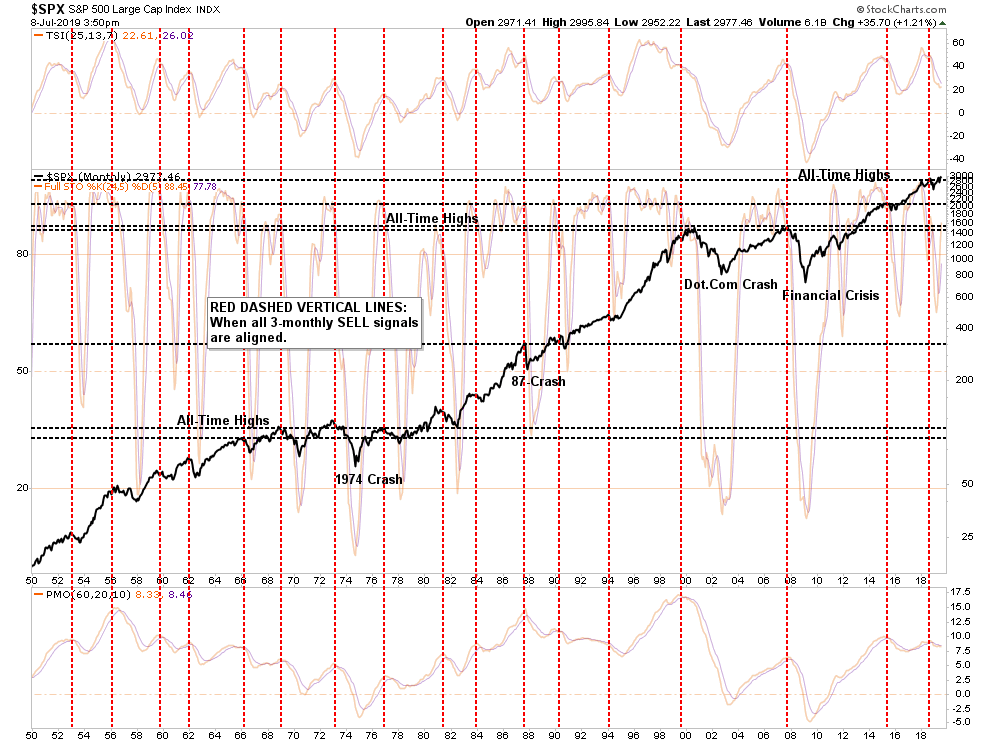
We can take those same monthly indicators and review them going back to 1950. I have added two confirming monthly indicators as well, so the vertical “red dashed lines” are when all three indicators have aligned which reduces false signals.
I can’t believe I actually have to write the next sentence, but if I don’t I invariably get an email saying “but if you sold out, you missed the whole rally.”
What should be obvious is that while the monthly “sell” signals have gotten you out to avoid more substantial destructions of capital, the reversal of those signals were signs to “get back in.”
Investing, long-term is about both deployment of capital and the preservation of it.
Currently, the monthly indicators have all aligned to “confirm” a “sell signal” which since 1950 has been somewhat of a rarity. Yes, the recent signal could turn out to be a “1987” scenario where the market rallied immediately back and reversed the signals back to a “buy” a few months later. Or this could be the beginning of a more substantial corrective process over the course of many months.
Unfortunately, we won’t know for sure until we get there.
This way we pay attention to these indicators to give us “clues” about potential risks so we can hedge portfolios accordingly. If you “wait” to be “sure,” well, it is generally too late by that point to do anything meaningful about it.
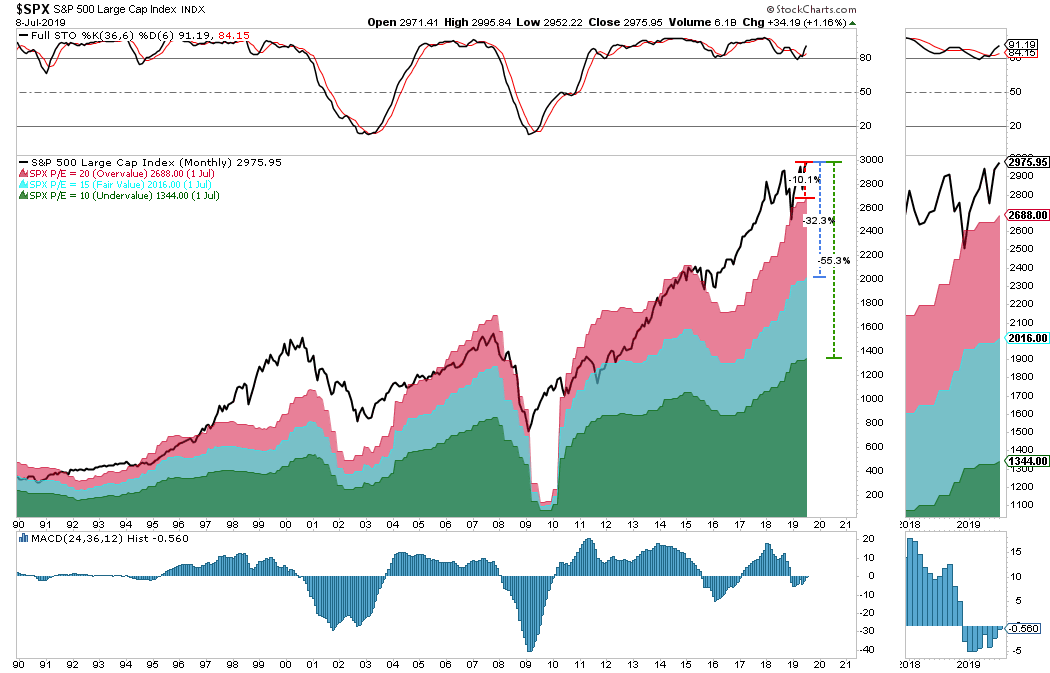
One of the biggest reasons not to equate the current monthly “sell” signal to a “1987” type period is valuations. In 1987, valuations were low and rising at a time where interest rates and inflation were high and falling. Today, that economic and valuation backdrop are entirely reversed. Currently, a correction from current price levels of the market to PE20 (20x current earnings) would be another 10.10% decline. However, a drop back to the long-term average of PE15 would entail a 32% decline and a reversion to PE10, which would be required to “reset” the market, would be a fall of 55.3%.
Still not convinced?
I get it.
Emotionally, the hardest thing for investors to do is to sit on their hands and avoid “risk” when the markets are rising. But this is the psychological issue which plagues all investors over time, which is to “buy high” and “sell low.”
It happens to everyone.
This is why we use technical signals to help reduce the “emotional” triggers that lead to poor investment decisions over the long-term. As I have noted before, the following chart is one of my favorites because it combines a litany of confirming signals all into one monthly chart.
Despite the recent rally, which has pushed prices back above their longer-term moving average, the longer-term trends of the signals remain “non-confirming” of the recent rally.
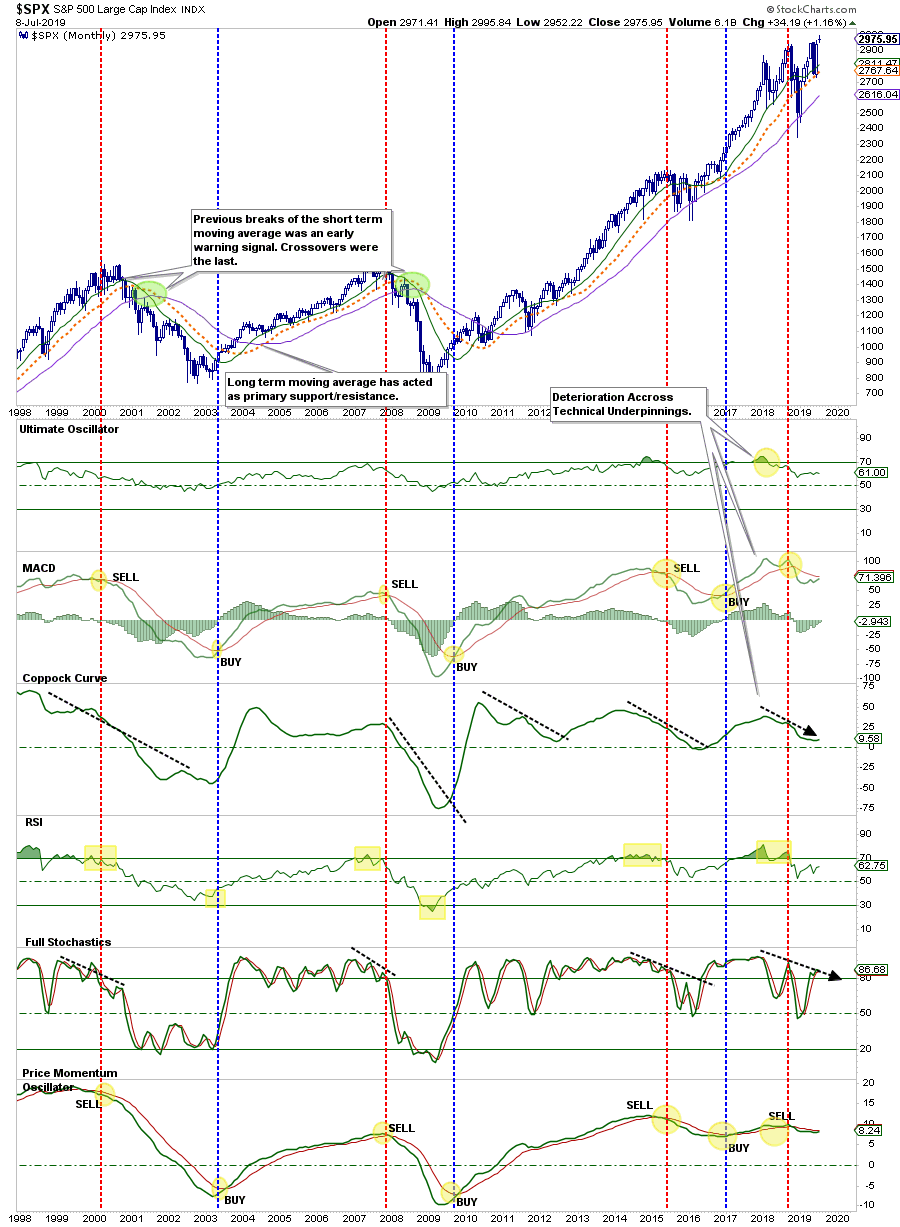
While the technical signals do indeed lag short-term turns in the market, they currently do not support the “bullish narrative” of the market. Rather, and as shown in the chart above, the negative divergence of the indicators from the market should actually raise some concerns about longer-term capital preservation.
What This Means And Doesn’t Mean
Let me repeat from this past weekend’s newsletter:
What this analysis DOES NOT mean is that you should “sell everything” and “hide in cash.”
As always, long-term portfolio management is about “tweaking” things over time.
At a poker table, if you have a “so so” hand, you bet less or fold.
It doesn’t mean you get up and leave the table altogether.
What this analysis DOES MEAN is that we need to use this rally to take some actions to rebalance portfolios to align with some the “concerns” discussed above.
- Trim Winning Positions back to their original portfolio weightings. (ie. Take profits)
- Sell Those Positions That Aren’t Working. If they don’t rally with the market during a bounce, they are going to decline more when the market sells off again.
- Move Trailing Stop Losses Up to new levels.
- Review Your Portfolio Allocation Relative To Your Risk Tolerance. If you are aggressively weighted in equities at this point of the market cycle, you may want to try and recall how you felt during 2008. Raise cash levels and increase fixed income accordingly to reduce relative market exposure.
Could I be wrong? Absolutely. But what if the indicators are warning us of something greater?
What’s worse:
- Missing out temporarily on the initial stages of a longer-term advance, or;
- Spending time getting back to even, which is not the same as making money.
For the majority of investors, the recent rally has simply been a recovery of what was lost last year. In other words, while investors have made no return over the last eighteen months, they have lost 18-months of their retirement saving time horizon.
Yes, if the market corrects and reduces some of its current overbought condition, without violating supports and maintaining the current bullish trend, we will miss some of the initial upside. However, we can be quickly realigned portfolios to participate from that point with a much higher reward to risk ratio than what currently exists.
If I am right, however, the preservation of capital during an ensuing market decline will provide a permanent portfolio advantage going forward. The true power of compounding is not found in “the winning,” but in the “not losing.”
As I noted recently in our blog on trading rules:
“Opportunities are made up far easier than lost capital.” – Todd Harrison


