
Technically Speaking: Just How Long Will Markets Keep “Buying” It?
In this past weekend’s newsletter, I broke down the bull/bear argument dissecting the issues of cash on the sidelines, extreme bearishness, equity outflows. However, even though the economic and fundamental environment is not supportive of asset prices at current levels, the primary argument supporting asset prices at current levels is “optimism.”
“The biggest reason for last week’s torrid stock market rally was rekindled “optimism” that the escalating trade war between the US and China may be on the verge of another ceasefire following phone conversations, fake as they may have been, between the US and Chinese side. This translated into speculation that a new round of tariffs increases slated for this weekend may not take place or be delayed.” – MarketWatch
This, of course, has been the thesis of every rally in the market over the past year. Sven Heinrick summed this up well in a recent tweet.
"What would you do if you were stuck in one place and every day was exactly the same, and nothing that you did mattered?"
— Sven Henrich (@NorthmanTrader) August 30, 2019
— Phil Connors (Bill Murray), Groundhog Day pic.twitter.com/fY5Atw1l93
However, the “ceasefire” did not happen, and at 12:00 am on Sunday, the Trump administration slapped tariffs on $112 billion in Chinese imports. Then, one-minute later, at 12:01 am EDT, China retaliated with higher tariffs being rolled out in stages on a total of about $75 billion of U.S. goods. The target list strikes at the heart of Trump’s political support – factories and farms across the Midwest and South at a time when the U.S. economy is showing signs of slowing down.
Importantly, the additional tariffs by the White House target consumers directly:
“The 15% U.S. duty hit consumer goods ranging from footwear and apparel to home textiles and certain technology products like the Apple Watch. A separate batch of about $160 billion in Chinese goods – including laptops and cellphones – will be hit with 15% tariffs on Dec. 15. China, meanwhile, began applying tariffs of 5 to 10% on U.S. goods ranging from frozen sweet corn and pork liver to bicycle tires on Sunday.
The slated 15% U.S. tariffs on approximately $112 billion in Chinese goods may affect consumer prices for products ranging from shoes to sporting goods, the AP noted, and may mark a turning point in how the ongoing trade war directly affects consumers. Nearly 90% of clothing and textiles the U.S. buys from China will also be subjected to tariffs.” – ZeroHedge
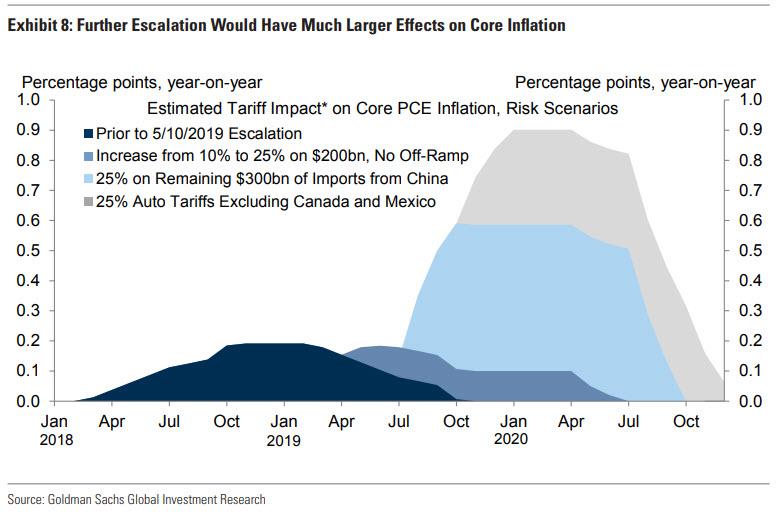
This is only phase one. On December 15th, the U.S. will hike tariffs on another $160bn consumer goods and Beijing has vowed retaliatory tariffs that, combined with the Sunday increases, would cover $75 billion in American products once the December tariffs take effect.
These tariffs, of course, are striking directly at the heart of economic growth. The trade was has ground the global economy to a halt, sent Germany into a recession, and is likely slowing the U.S. economy more than headline data currently suggests.
Yet, “optimism” that “a trade deal is imminent” is keeping stocks afloat. For now.

As we discussed previously, the President has now trained the markets to respond to his “tweets.”
“Ring the bell. Investors salivate with anticipation.”
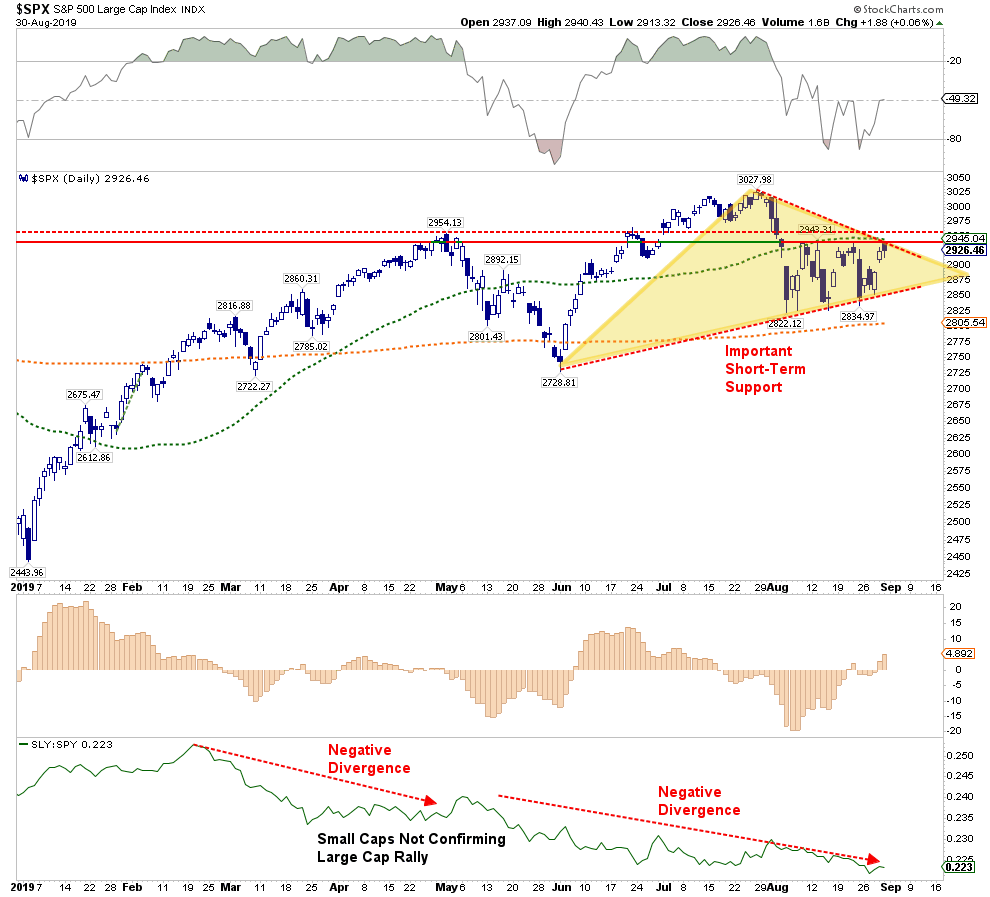
However, despite the rally last week, the markets are still well confined in a very tight consolidation range.
(Click on image to enlarge)
As I noted recently:
- The “bulls” are hoping for a break to the upside which would logically lead to a retest of old highs.
- The “bears” are concerned about a downside break which would likely lead to a retest of last December’s lows.
- Which way will it break? Nobody really knows.
The biggest risk, is what happens when the market quits “buying the rumor” and starts “selling the news?”
Fed To The Rescue
There is another level of “optimism” supporting asset prices.
The Fed.
It is widely believed the Fed will “not allow” the markets to decline substantially. This is a lot of faith to place into a small group of men and women who have a long history of creating booms and busts in markets.
And, as JP Morgan noted over the weekend:
“Positive technical indicators and monetary easing will likely outweigh the uncertainty of the U.S.-China trade war and the “wild card” of developments in tariff negotiations. We now advise to add risk back again, tactical indicators have improved. Admittedly, the next trade move is the wild card to all of this, but we think that the hurdle rate for any positive development is quite low now.”
Currently, there is a 100% expectation of the Fed cutting rates at the September meeting.
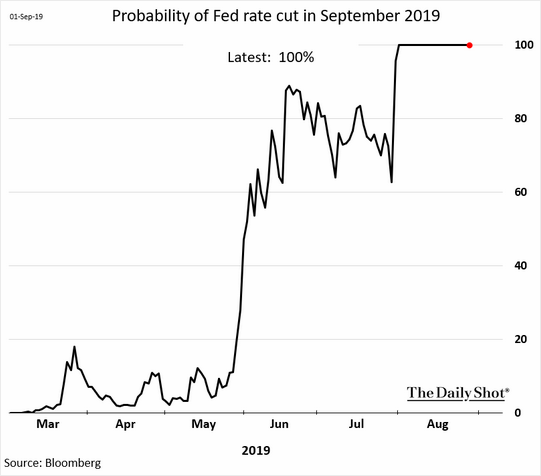
The belief currently, is that lower interest rates will result in higher asset prices as investors will once “chase equities” to obtain a “higher yield” than what they can get in other “safe” assets.
After all, this is indeed what happened as the Federal Reserve kept interest rates suppressed after the financial crisis. However, the difference between now, and then, is that individuals are currently fully invested in the financial markets.
“Cash is low, meaning households are fairly fully invested.” – Ned Davis
(Click on image to enlarge)
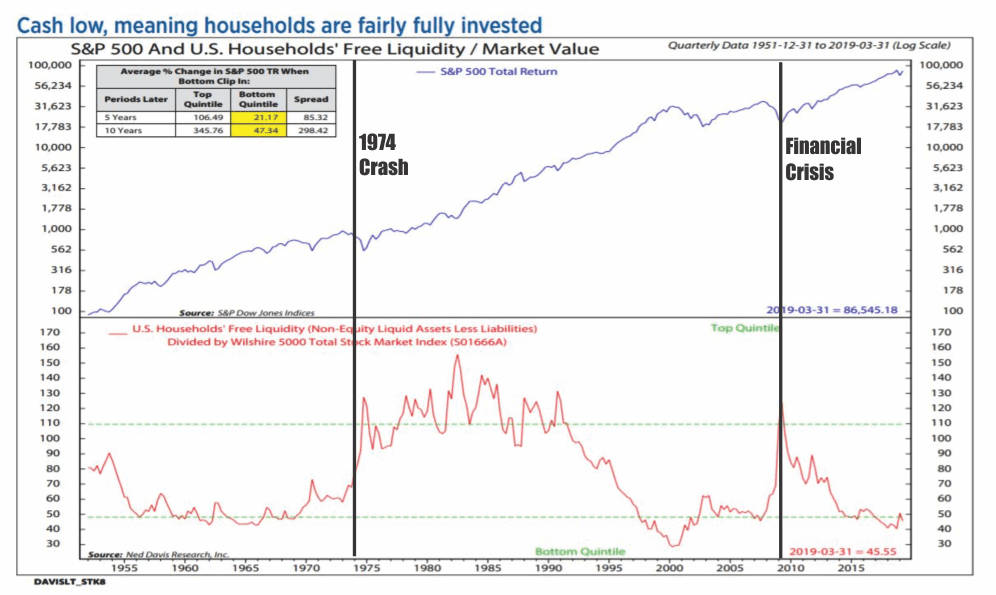
In other words, the “pent up” demand for equities is no longer available to the magnitude that existed following the financial crisis which supported the 300% rise in asset prices.
More importantly, when the Fed has previously engaged in a “rate cutting” cycle when the “yield curve”was inverted, which signals something is wrong economically, the outcomes for investors have not been good.
This last point is an issue for investors specifically. Investing is ultimately about buying assets at a discounted price and selling them for a premium. However, so far in 2019, while asset prices have soared higher on “optimism,” earnings and profits have deteriorated markedly. This is show in the attribution chart below for the S&P 500.
In 2019, the bulk of the increase in asset prices is directly attributable to investors “paying more” for earnings, even though they are “getting less” in return.
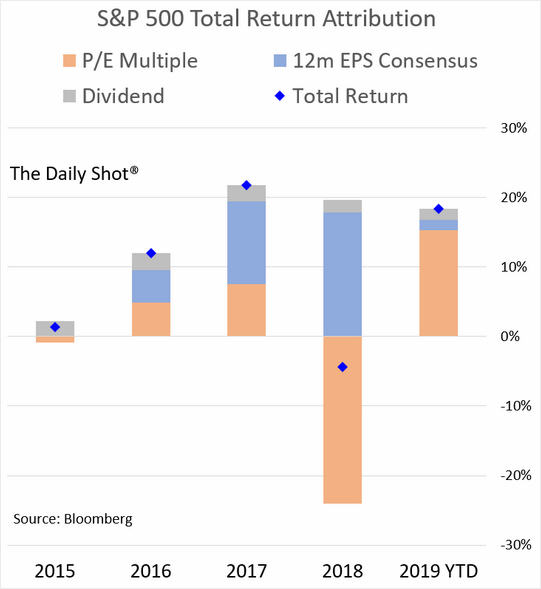
The discrepancy is even larger in small capitalization stocks which don’t benefit from things like “share repurchases” and “repatriation.”
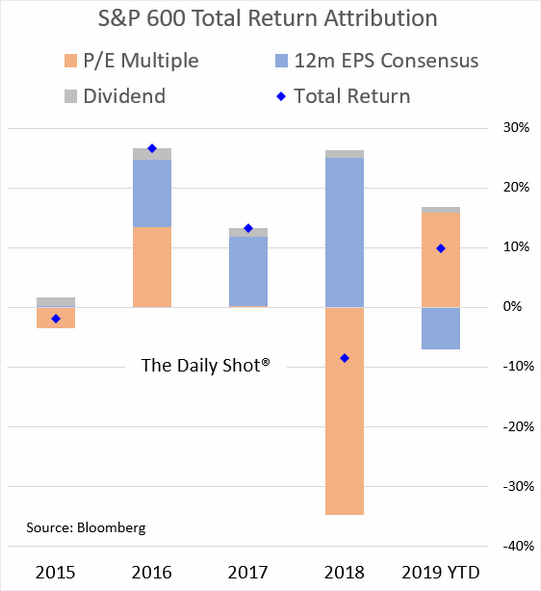
Just remember, at the end of the day, valuations do matter.
September Seasonality Increases Risk
“The month of September has a reputation for being a bad month for the stock market. After the October 1987 Crash, the month of October carried a bad rep for years, but more recently we are told that it’s really September we have to watch out for.” – Carl Swenlin
The month of September has closed higher fifty-percent of the time, but the average change was a -1.1% decline, making September the worst performing month in the 20-year period. More importantly, September tends to be weaker when it follows a negative August, which we just had.
However, these are all averages of what has happened in the past and things can, and do, turn out differently more often than we expect. This is why I prefer to just rely on the charts to suggest what may happen next.
I discussed previously that money is crowding into large-capitalization stocks for safety and liquidity. Carl Swenlin showed this same analysis in his chart below.
(Click on image to enlarge)
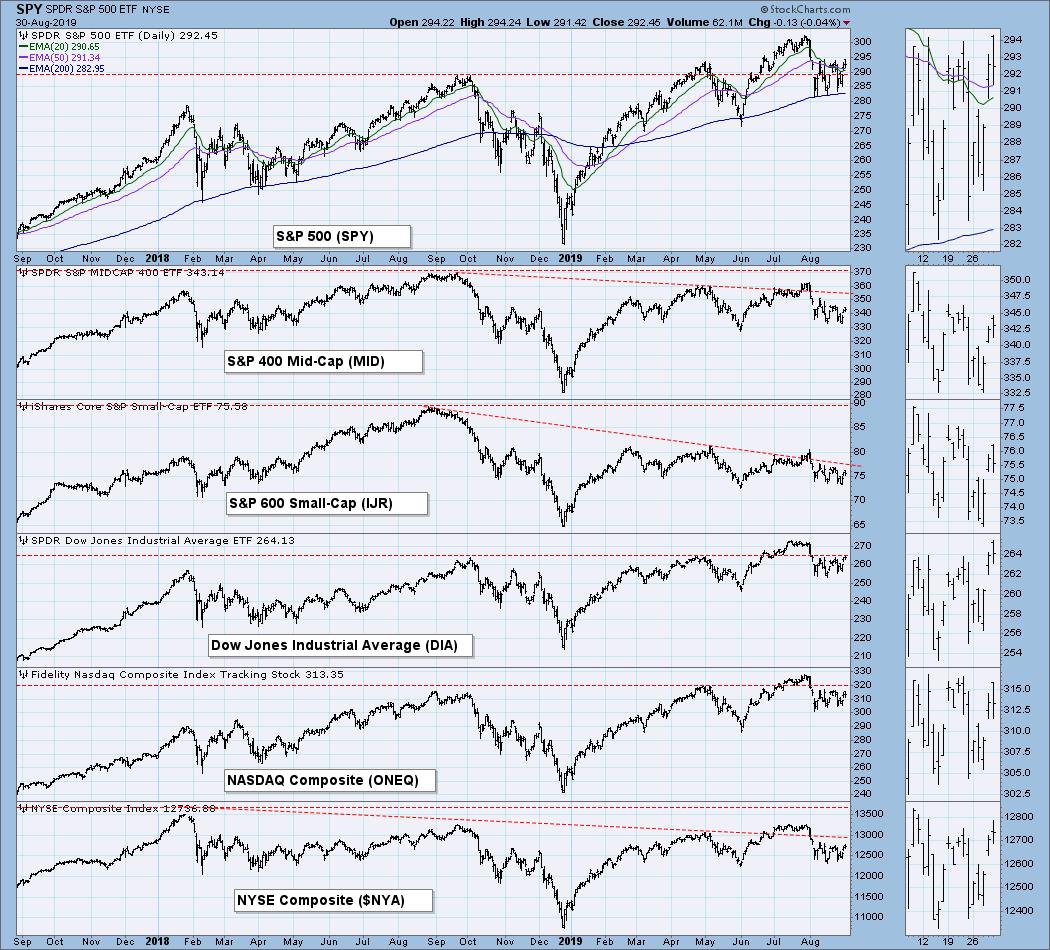
Investors should be very aware about the deviation in performances across asset markets. Historically, this is more of a sign of a late-stage market topping process rather than a “pause that refreshes the bull run.”
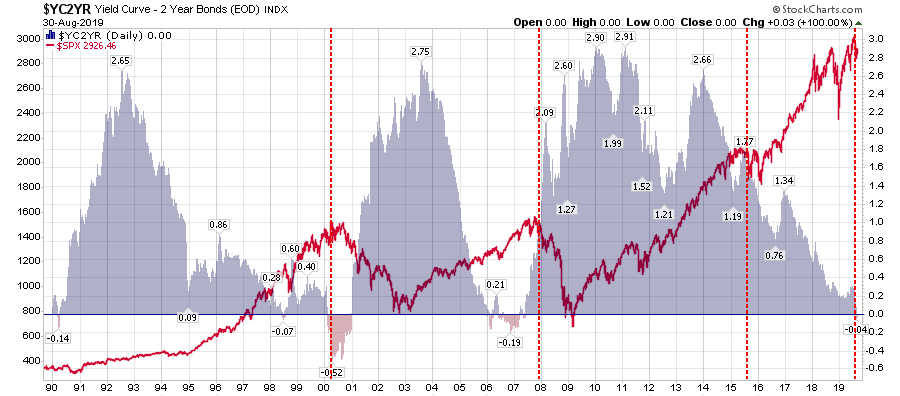
This is particularly the case when this crowding of investments is occurring simultaneously with an inverted yield curve.
(Click on image to enlarge)
On a purely technical basis, when looking at combined monthly signals, we see a picture of a market in what has previously been more important turning points for investors.
(Click on image to enlarge)
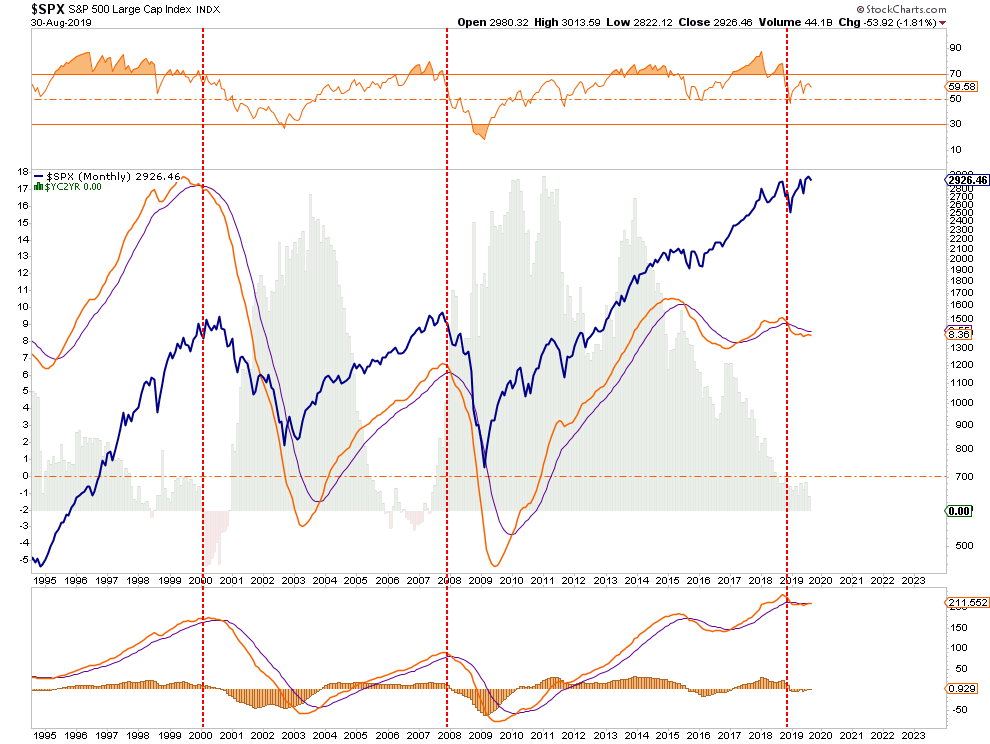
Sure, this time could turn out to be different.
Since I manage portfolios for individuals who are either close to, or in retirement, the risk of betting on “possibilities,” versus “probabilities,” is a risk neither of us are willing to take.
Let me restate from last week:
“Given that markets still hovering within striking distance of all-time highs, there is no need to immediately take action. However, the continuing erosion of underlying fundamental and technical strength keeps the risk/reward ratio out of favor. As such, we suggest continuing to take actions to rebalance risk.
- Tighten up stop-loss levels to current support levels for each position.
- Hedge portfolios against major market declines.
- Take profits in positions that have been big winners
- Sell laggards and losers
- Raise cash and rebalance portfolios to target weightings.
We are closer to the end of this cycle than not, and the reversion process back to value has historically been a painful one.”
Remember, it is always far easier to regain a lost opportunity. It is a much more difficult prospect to regain lost capital.
Disclaimer: Real Investment Advice is powered by RIA Advisors, an investment advisory firm located in Houston, Texas with more than $800 million under management. As a team of certified and ...
more

