
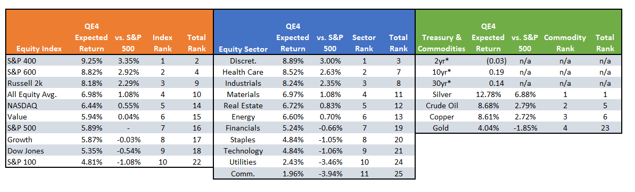
Technically Speaking: COT Positioning – Volatility, Oil, Dollar, & Rates (Q3-2019)
We have been laying out the basis for a market correction. What has been most stunning is the rapid reversion in sentiment from “bearishness” this summer, to outright excess “bullishness” in just a few short weeks.
“But it isn’t just the more extreme advance of the market over the past 5-weeks which has us a bit concerned in the short-term, but a series of other indications which typically suggest short- to intermediate-terms corrections in the market.
Historically, when all of the indicators are suggesting the market has likely encompassed the majority of its price advance, a correction to reverse those conditions is often not far away. Regardless of the timing of that correction, it is unlikely there is much upside remaining in the current advance, and taking on additional equity exposure at these levels will likely yield a poor result.”
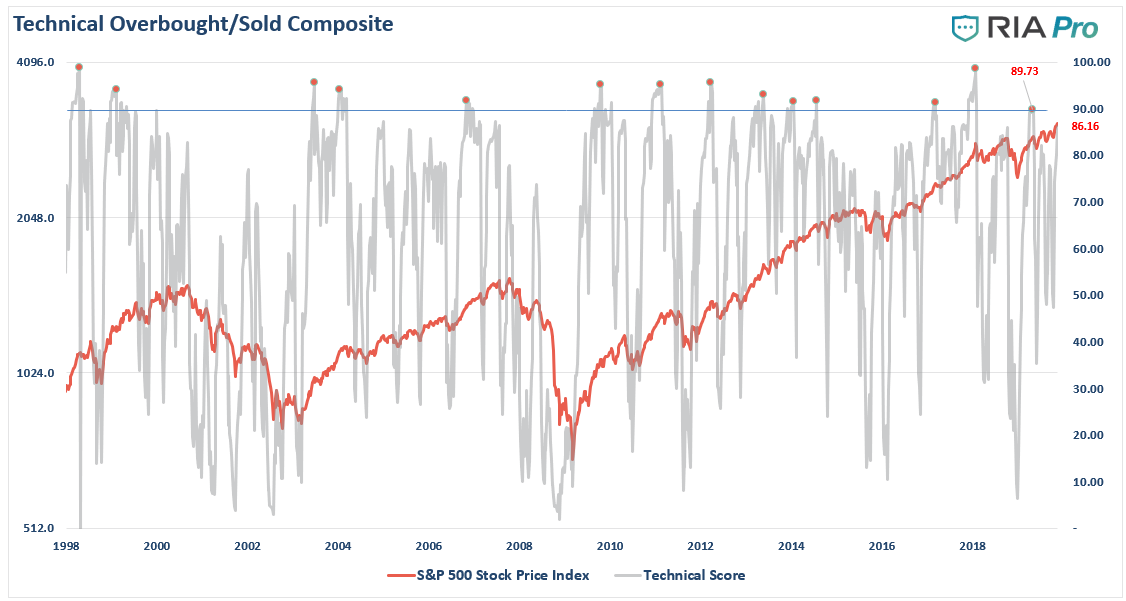
However, even if we set aside investor sentiment and positioning for a moment, the rapid reversion is price has sent our technical composite overbought/oversold gauge back towards more extreme levels of overbought conditions.
What we know is that markets move based on sentiment and positioning. This makes sense considering that prices are affected by the actions of both buyers and sellers at any given time. Most importantly, when prices, or positioning, becomes too “one-sided,” a reversion always occurs. As Bob Farrell’s Rule #9 states:
“When all experts agree, something else is bound to happen.”
So, how are traders positioning themselves currently?
Positioning Review
The COT (Commitment Of Traders) data, which is exceptionally important, is the sole source of the actual holdings of the three key commodity-trading groups, namely:
- Commercial Traders: this group consists of traders that use futures contracts for hedging purposes and whose positions exceed the reporting levels of the CFTC. These traders are usually involved with the production and/or processing of the underlying commodity.
- Non-Commercial Traders: this group consists of traders that don’t use futures contracts for hedging and whose positions exceed the CFTC reporting levels. They are typically large traders such as clearinghouses, futures commission merchants, foreign brokers, etc.
- Small Traders: the positions of these traders do not exceed the CFTC reporting levels, and as the name implies, these are usually small traders.
The data we are interested in is the second group of Non-Commercial Traders.
This is the group that speculates on where they believe the market is headed. While you would expect these individuals to be “smarter” than retail investors, we find they are just as subject to “human fallacy” and “herd mentality” as everyone else.
Therefore, as shown in the series of charts below, we can take a look at their current net positioning (long contracts minus short contracts) to gauge excessive bullishness or bearishness.
Volatility Marking A Top
The extreme net-short positioning on the volatility index in early May suggested a peak to the advance from the December lows was likely. Just a few months later, after two corrections, investor “complacency” has pushed markets back to record levels as the VIX net-short positioning has set a new record.
Given that most “tops” occur when short-VIX positioning is extreme, the current levels suggest a correction is highly likely.
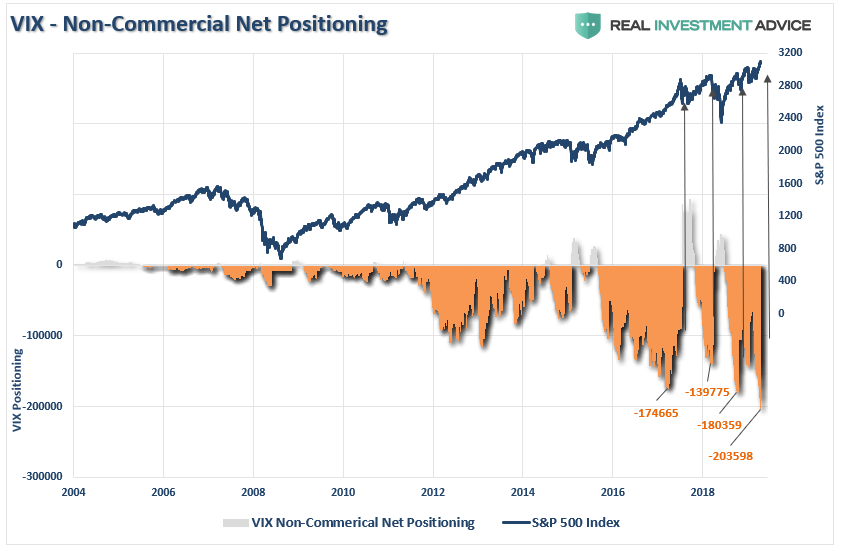
Over the next couple of months, the extreme compression of volatility will be reversed. Such a reversal will likely lead to a correction of 3-6% in the short-term. However, there is risk a bigger correction could develop if the extreme level of net-short VIX positioning begins to unwind.
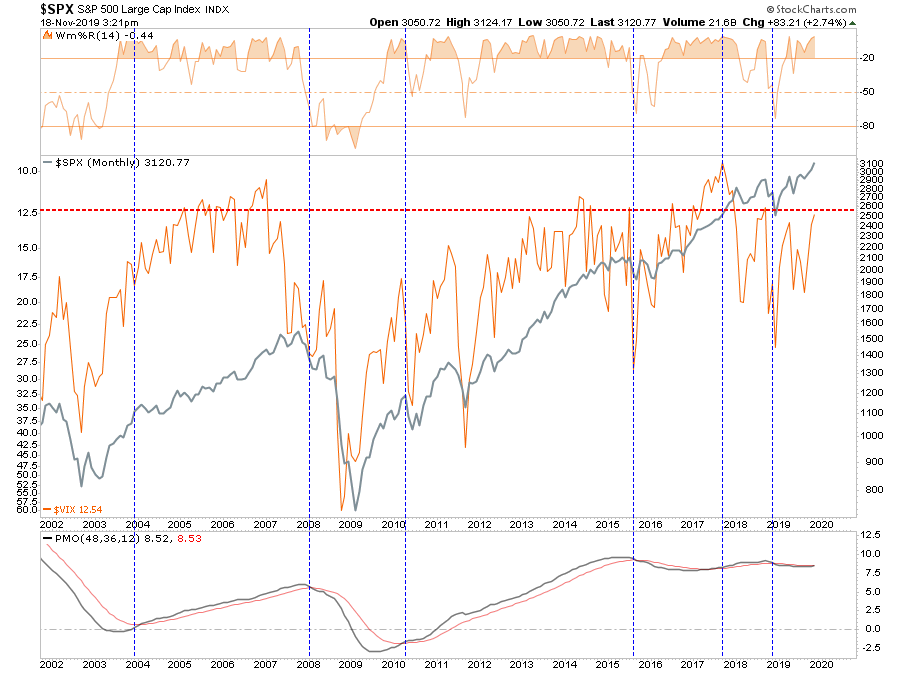
As shown in the chart below, such extremely low levels of volatility have often resulted in larger corrections than most expect. (The VIX index is inverted)
Crude Oil Extreme
The recent attempt by crude oil to get back above the 200-dma has coincided with the Fed’s initiation of QE-4. Historically, these liquidity programs tend to benefit highly speculative positions like commodities, as liquidity seeks the highest rate of return. As we noted in our recent study of QE (To Buy Or Not To Buy, A QE And Investors Guide) oil and energy are some of the biggest beneficiaries form liquidity infusions.
Each Monday, we provide an update for subscribers on oil prices and the related energy sector investments. As noted yesterday:
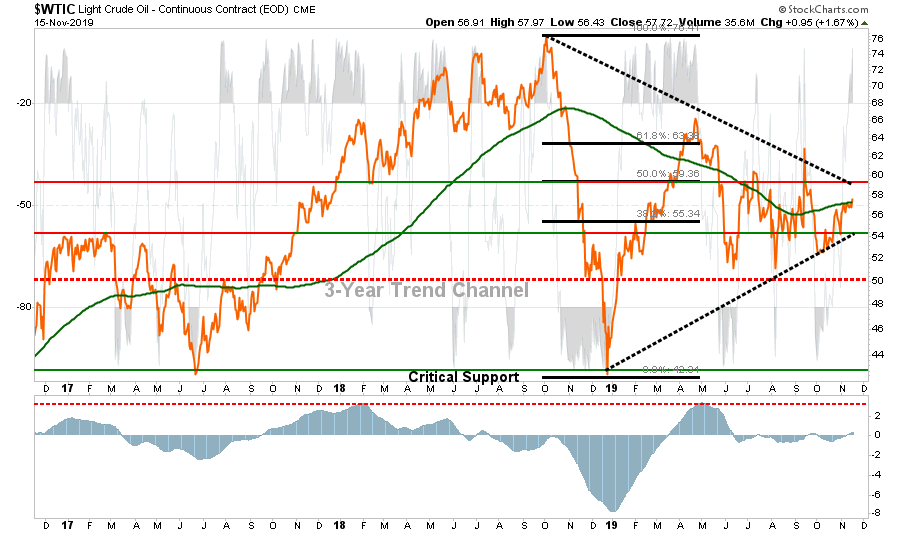
“Currently, oil remains confined to a longer-term downtrend. However, with QE in place, and the fact that oil recently registered a short-term ‘buy signal,’ higher oil prices are likely, but likely not before a short-term correction to relieve the more extreme overbought condition.”
Despite the decline in oil prices over the last year, it is worth noting that crude oil positioning is still on the bullish side. Therefore, a deeper reversal in oil prices will likely coincide with a correction in the S&P 500.
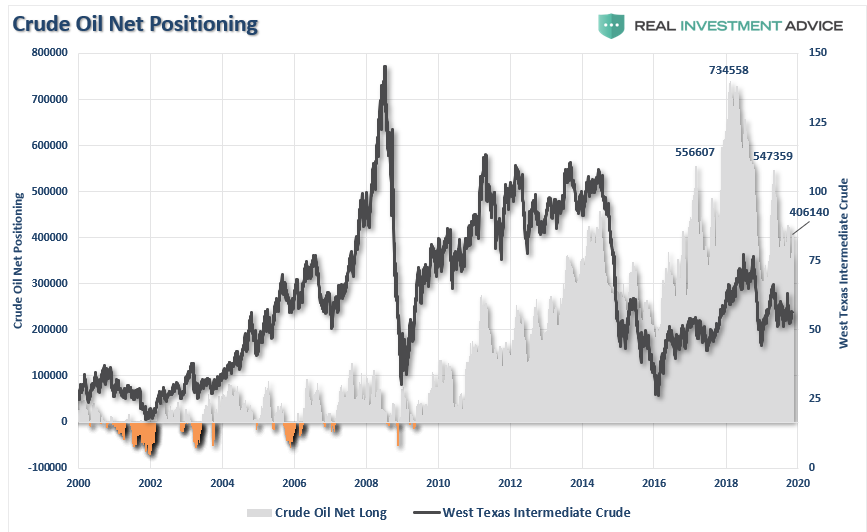
For now, oil price corrections should remain confined within the $50 range. However, the onset of a recession could very well push oil prices toward $40/bbl for a variety of reasons.
U.S. Dollar Extreme
Another index we track is the U.S. Dollar.
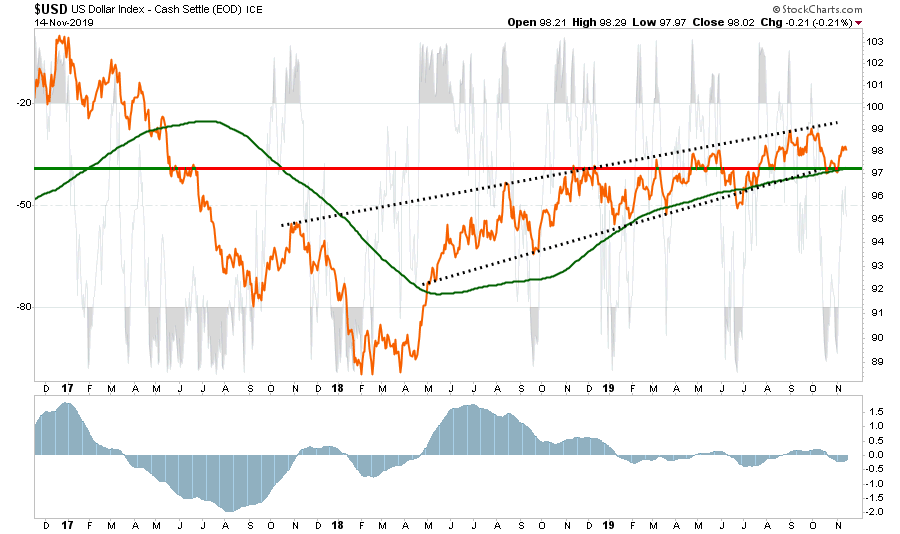
- Despite much of the rhetoric to the contrary, the dollar remains in a strongly rising uptrend. Given a “strong dollar” erodes corporate profits on exports (which makes up 40% of corporate profits overall) a strong dollar combined with tariffs isn’t great for corporate bottom lines. Watch earnings carefully during this quarter.
- Furthermore, the dollar bounced off support of the 200-dma and the bottom of the uptrend. If the dollar rallies back to the top of its trend, which is likely, this will take the wind out of the emerging market, international, and oil plays.
- The “sell” signal is also turning up. If it triggers a “buy” the dollar will likely accelerate pretty quickly.
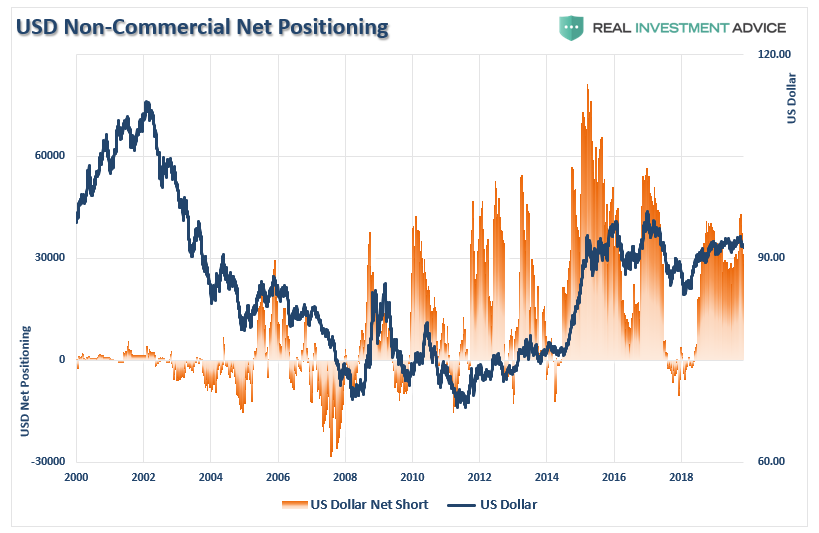
Much of the bulls rallying cry has been based on the dollar weakening with the onset of QE, but as shown above, that has yet to be the case. However, US Dollar positioning has been surging as of late as money is chasing “risk assets.” Importantly, it is worth watching positioning in the dollar as a reversal of dollar-longs are usually reflective of short- to intermediate-term market peaks.
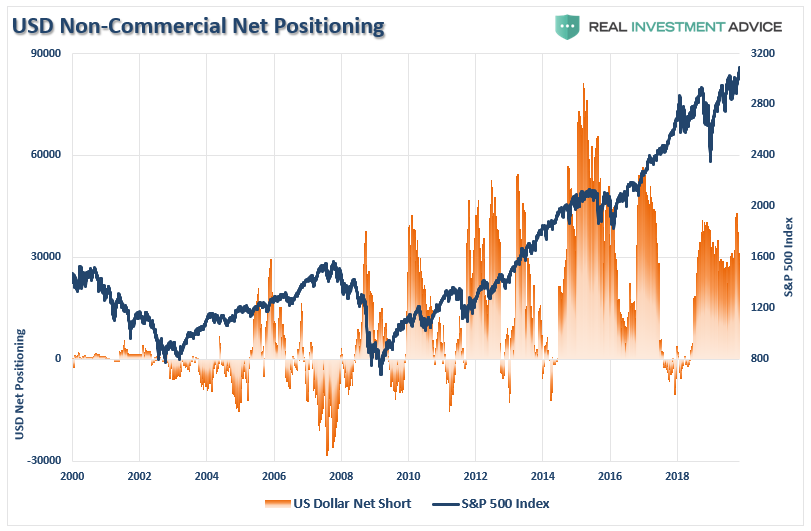
As shown above, and below, such net-long positions have generally marked both a short to intermediate-term peak in the dollar. The bad news is that a stronger dollar will trip up the bulls, and commodities, sooner rather than later.
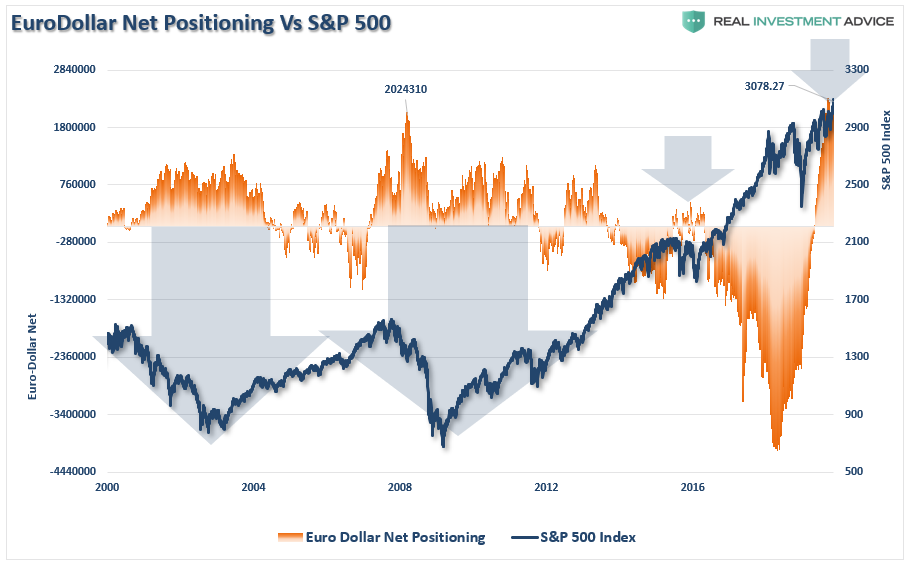
It is also worth watching the net-short positioning the Euro-dollar as well. Historically, when positioning in the Eurodollar becomes NET-LONG, as it is currently, such has been associated with short- to intermediate corrections in the markets, including outright bear markets.
Net-long Eurodollar positioning is at an all-time record as foreign banks are cramming money into dollar-denominated assets to get away from negative rates.
This. Will. Not. End. Well.
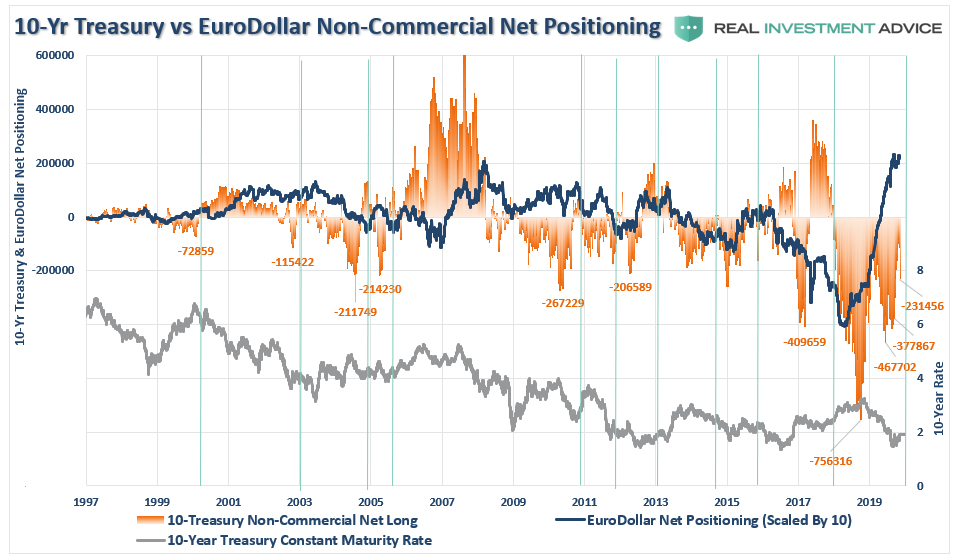
Interest Rate Extreme
One of the biggest conundrums for the financial market “experts” is why interest rates fail to rise. Earlier this year, I wrote, “The Bond Bull Market” which was a follow up to our earlier call for a sharp drop in rates as the economy slowed. That call was based on the extreme “net-short positioning” in bonds which suggested a counter-trend rally was likely.
Since then, rates bottomed and have bounced as QE pulls money out of “safe-haven” investments to chase “risk.”
With the bulk of the previous “net-short” positioning on bonds having been reversed, rates have failed to rise correspondingly. The reason for this is due to the record levels of Eurodollar positioning, as noted above.
What this suggests is a high probability rates will fall further in the months ahead, most likely in concert with the onset of a recession.
(Click on image to enlarge)
Amazingly, investors seem to be residing in a world without any perceived risks and a strong belief that financial markets can only rise further. The arguments supporting those beliefs are based on comparisons to previous peak market cycles. Unfortunately, investors tend to be wrong at market peaks and bottoms.
The inherent problem with much of the mainstream analysis is that it assumes everything remains status quo. However, such never tends to be the case for long.
The question is simply: “What can go wrong for the market?”
In a word, “much.”
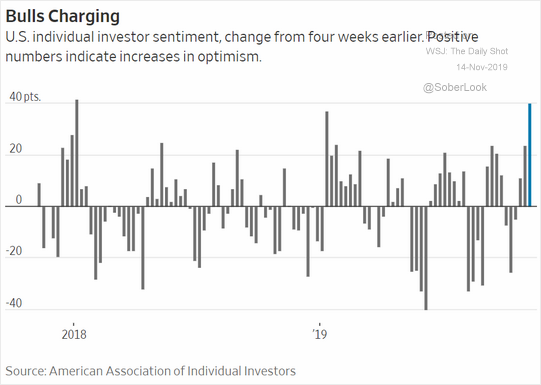
With retail positioning very long-biased, as shown in the chart below, the implementation of QE has removed all “fears” of a correction and bear market that existed only a couple of months ago. Historically, such sentiment excesses form around short-term market peaks.
(Click on image to enlarge)
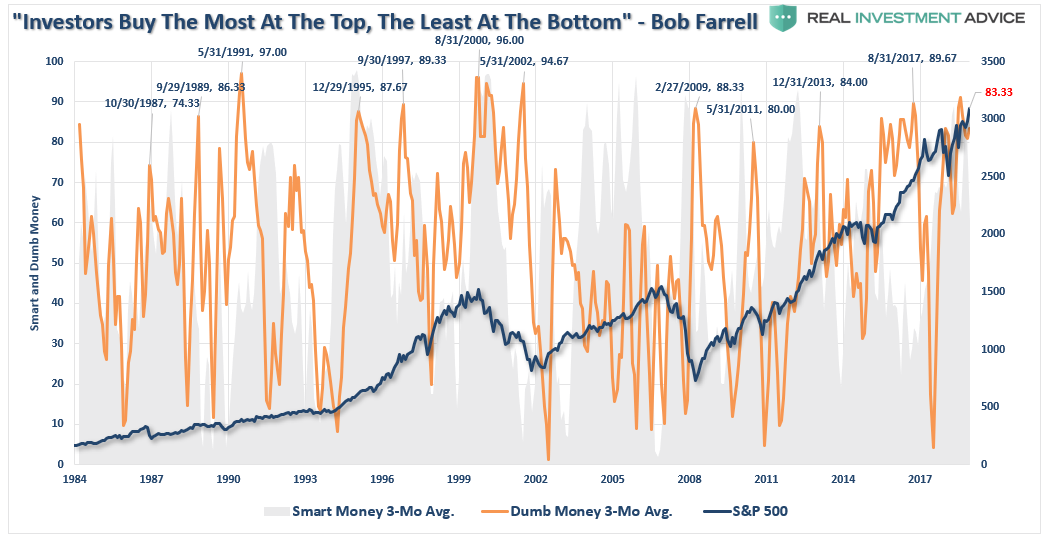
This is a excellent time to remind you of the other famous “Bob Farrell Rule” to remember:
“#5 – The public buys the most at the top and the least at the bottom.”
What investors miss is that while a warning doesn’t immediately translate into a negative consequence, such doesn’t mean you should not pay attention to it. It is akin to constantly running red lights and never getting into an accident. We begin to think we are skilled at running red lights, rather than just being lucky.
Eventually, your luck will run out.
Pay attention, have a plan, and act accordingly.
Disclaimer: Real Investment Advice is powered by RIA Advisors, an investment advisory firm located in Houston, Texas with more than $800 million under management. As a team of certified and ...
more

