
Technically Speaking: Bull Market Or Bull Trap?
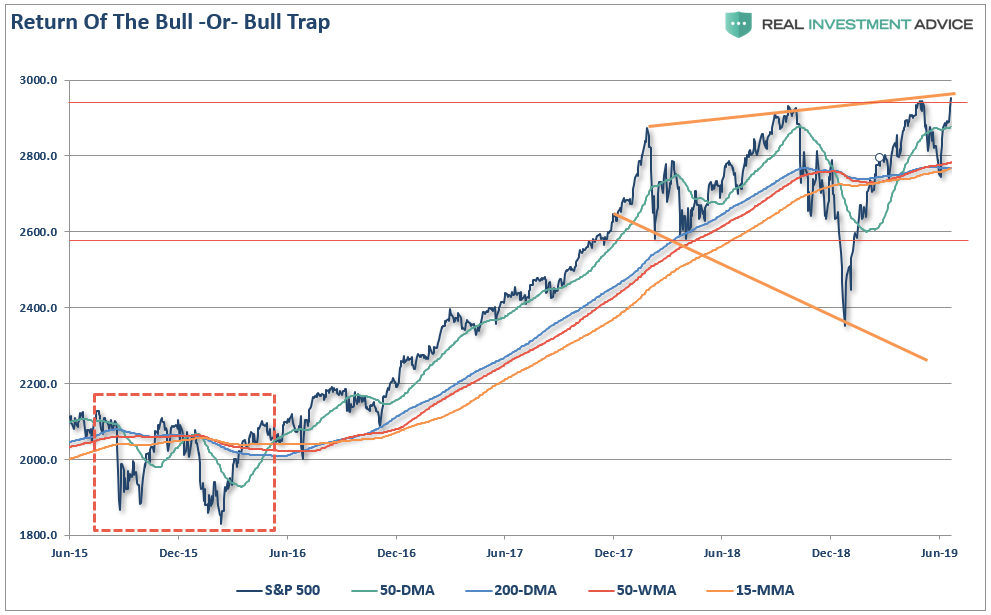
For the fourth time, since the end of 2017 the market has set an all-time high. Each previous all-time high has led an almost immediate sell-off.
Will this time be different?
Such is the belief currently which is being driven primarily by the “Pavlovian” response of a more “accommodative” Federal Reserve which is expected to cut rates sharply by the end of this year. It is also the “hope” there will be a resolution to the ongoing “trade war” with China at the G-20 Summit next week.
Nowhere was this “Pavlovian” response more evident than in Jeffry Bartash’s latest post for MarketWatch:
“A stream of negative news pointing to a slower economy has not only failed to halt the latest bull run on Wall Street, it’s actually encouraged investors to snap up more stocks.
In the sometimes wacky world of Wall Street, the reason is understandable enough. Investors expect weaker U.S. growth to force the Federal Reserve to cut interest rates and supply more stimulus to the economy. Lower rates also make stocks more attractive investments.”
After a decade of near zero interest rates, $33 Trillion in liquidity, and a seemingly unstoppable “bull market run,” which was caused by zero-rates and an endless stream of liquidity, it is not surprising investors expect the same outcome – forever.
However, assumptions are always a dangerous thing. Markets have a nasty habit of doing exactly the opposite of what the masses expect.
As I noted this past weekend:
“The critical point here is that QE and rate reductions have the MOST effect when the economy, markets, and investors have been “blown out,” deviations from the “norm” are negatively extended, confidence is hugely negative.
In other words, there is nowhere to go but up. Today, it is entirely reversed.
The extremely negative environment that existed in 2009, particularly in the asset markets, provided a fertile starting point for monetary interventions. Today, as shown in the table above, the economic and fundamental backdrop could not be more different.
Lowering interest rates and quantitative easing are ‘incentives.’ Incentives work when there is pent-up demand for a product, but are much less effective when everyone always has what you’re offering.
There is little “pent-up” demand for assets currently, which increases the risk of disappointment.
Nonetheless, the “hope” of lower interest rates, and more liquidity, certainly provided the support needed in June for the “sellable rally” we discussed at the end of May.
“In the very short-term the markets are oversold on many different measures. This is an ideal setup for a reflexive rally back to overhead resistance.”
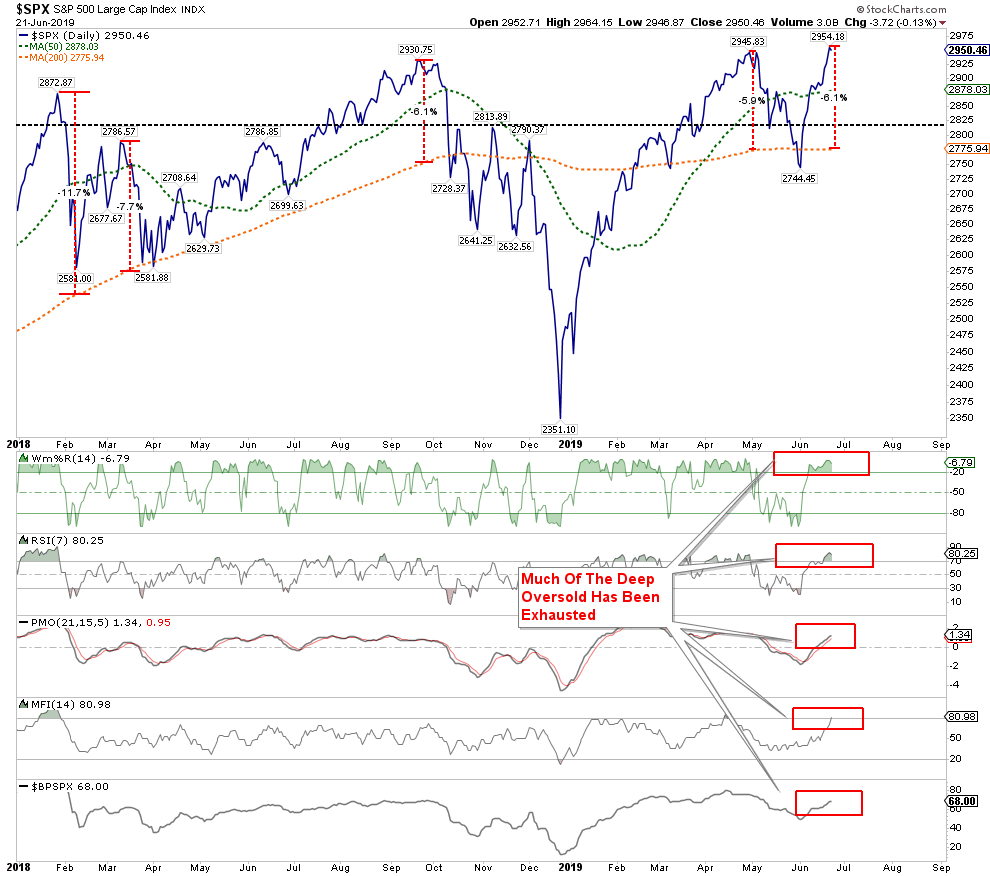
The chart below shows that previous test of multiple support levels and the rally back to overhead resistance.
While there is nothing wrong with “hoping” for rate cuts and a positive outcome from “trade talks,” the rush to “buy”equities has effectively “priced in” the best of all possible outcomes. This leaves investors vulnerable a whole host of possible disappointments:
- Trade deal isn’t reached as China refuses to give in to demands for economic reform.
- Trade deal is made but the magnitude of concessions is disappointing.
- Trade deal gets extended, again, with no real progress towards a “deal.”
- Trade deal made and tariffs are ended, but such is likely already priced into current asset prices.
- Trade negotiations collapse. (Worst possible outcome.)
- Fed doesn’t cut rates as soon, or a much, as the market is hoping for.
- The Fed cuts rates but signals that further rate cuts may not come.
- The Fed stops QT but provides no guidance towards restarting QE.
The point is that there are more than a few outcomes which could disappoint the financial markets. One of the most likely outcomes is a “buy the rumor, sell the news” type event, and if the news is bad, the resulting sell-off could be larger than currently anticipated.
Market Has Gotten Way Ahead Of Itself
While I am not suggesting the markets are about to suffer a massive correction, I am suggesting the markets have gotten a bit ahead of themselves. Short-term technical indicators also show the violent reversion from extreme oversold conditions back to extreme overbought, and prices are more than 6% above their 200-dma. Rapid deviations from the mean tend not to last long and tend to revert with some consistency. The last three all-time highs met a similar fate.
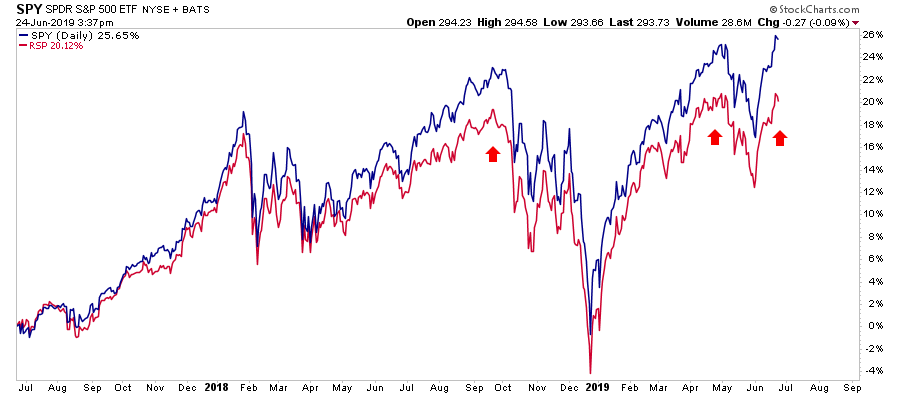
More importantly, the breadth of the breakout in the S&P 500 has been fairly narrow as shown in the chart below. When the S&P 500 market cap weighted index performs much better than the equal-weighted index, it is a sign money is crowding into the largest-capitalization weighted stocks. A reversion was generally quick to follow.
Interest Rate Cuts May Not Be Enough
While it is currently hoped that interest rate cuts will be enough to sustain the bull market rally indefinitely into the future, there is a potential argument which suggests this may not be the case.
Share buybacks.
Here is the most important point:
“What is clear is that the misuse and abuse of share buybacks to manipulate earnings and reward insiders has become problematic. As John Authers recently pointed out:
‘For much of the last decade, companies buying their own shares have accounted for all net purchases. The total amount of stock bought back by companies since the 2008 crisis even exceeds the Federal Reserve’s spending on buying bonds over the same period as part of quantitative easing. Both pushed up asset prices.’
In other words, between the Federal Reserve injecting a massive amount of liquidity into the financial markets, and corporations buying back their own shares, there have been effectively no other real buyers in the market.”
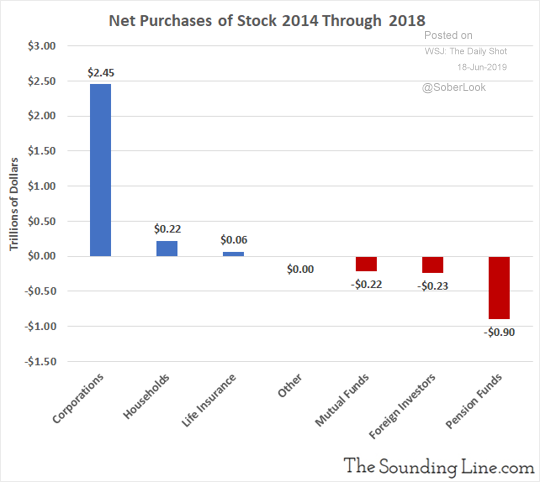
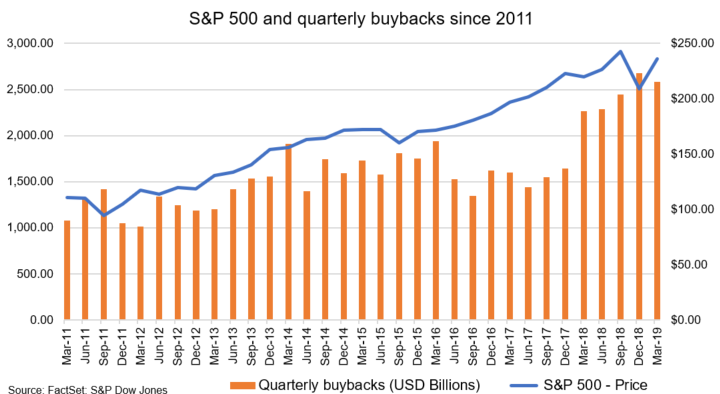
As shown in the chart below since 2014, almost 100% of net purchases belong to corporations.
But that may well now be coming to an end. As the benefit of the recent tax cut legislation fades, the amount of capital for share repurchases is declining.
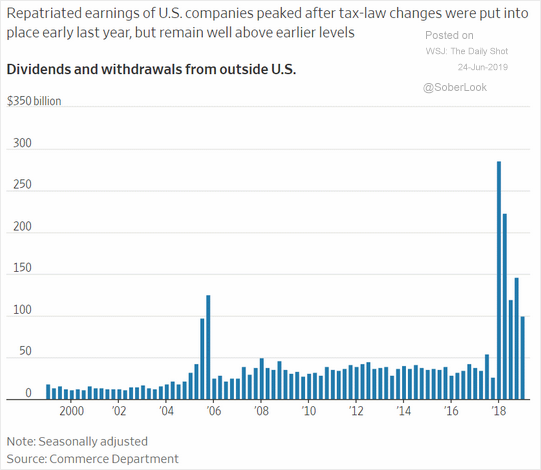
It is likely that 2018/2019 will be the potential peak of corporate share buybacks, thereby reducing the demand for equities in the market.
This “artificial buyer” explains the high degree of complacency in the markets despite recent volatility. It also suggests that the “bullish outlook” from a majority of mainstream analysts could also be a mistake.
If the economy is weakening, as it appears to be, it won’t be long until corporations redirect the cash from “share repurchases” to shoring up operations and protecting cash flows.
It may seem the markets are currently ignoring the poor economic data and weakening earnings, but such may only be a temporary issue.
The important point here is that from a contrarian standpoint, markets have gotten way ahead of the underlying fundamentals. While the market may indeed end the year on a higher note, it will most likely not do that without lower prices first.
This was supported by data recently from Ned Davis research:
“It is easy to imagine bullish paths for a second-half recovery. The self-sustaining route would be the natural rebound in the earnings cycle aided by an end to the trade war with China and a bottom in the global economy. The less graceful path would involve the Fed moving to an easing policy after economic data and/or equity markets clearly deteriorate.”
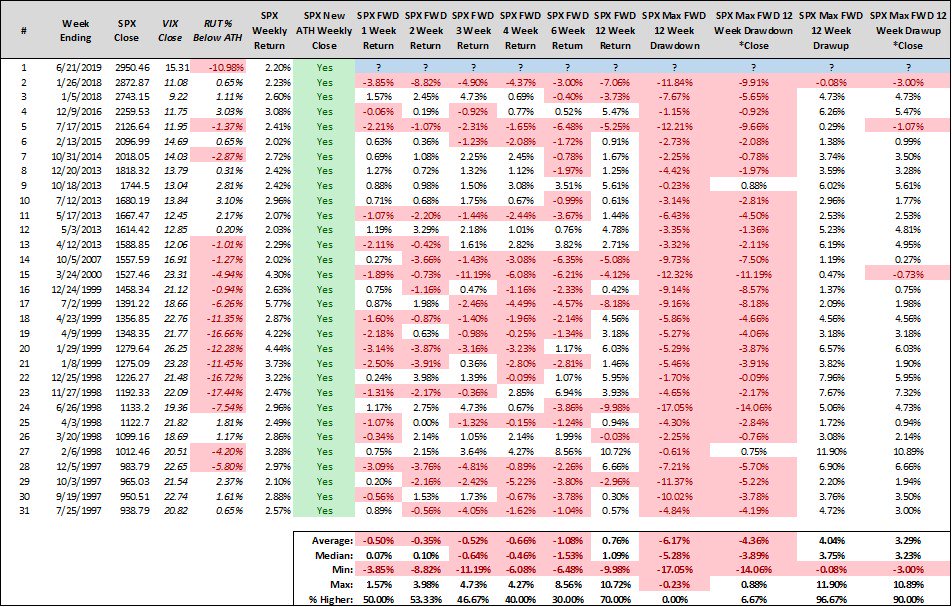
Steve Deppe also made an important observation Twitter that when the S&P 500 has gained at least 2% in a week and finished at a new weekly high — the case on Friday — the S&P was lower six weeks later 70% of the time.
This data supports much of our own analysis which suggests that investors will be better off waiting for a corrective process, at least back to the 200-dma, before taking on additional equity exposure.
The current “all-time” high appears to be a classic “bull trap” in the making. Erring to the side of caution, for now,, will likely be the right choice.
Conclusion & Suggestions
While remain primarily allocated toward equity risk, we have, as noted at the beginning of May, taken profits and shifted our bias towards more “defensive” holdings. We still carry a higher than normal slug of cash, and both lengthened duration of our bond portfolios and added gold as a hedge.
We are expecting a further correction over the next couple of months which we will use to adjust our exposures accordingly depending on how markets are developing as summer comes to its conclusion. In the meantime, we continue to suggest following a regular regime of risk management in portfolios.
Step 1) Clean Up Your Portfolio
- Tighten up stop-loss levels to current support levels for each position.
- Take profits in positions that have been big winners
- Sell laggards and losers
- Raise cash and rebalance portfolios to target weightings.
Step 2) Compare Your Portfolio Allocation To Your Model Allocation.
- Determine areas requiring new or increased exposure.
- Determine how many shares need to be purchased to fill allocation requirements.
- Determine cash requirements to make purchases.
- Re-examine portfolio to rebalance and raise sufficient cash for requirements.
- Determine entry price levels for each new position.
- Determine “stop loss” levels for each position.
- Determine “sell/profit taking” levels for each position.
Step 3) Have positions ready to execute accordingly given the proper market set up.
As noted previously in 10-Investment Wisdoms:
“The absolute best buying opportunities come when asset holders are forced to sell.” – Howard Marks
We haven’t gotten to that point just yet.


