
Technically Speaking: 5 Reasons To Be Bullish (Or Not) On Stocks
Just recently, Tom Lee, head of Fundstrat Global Advisors, published a list of 5-bullish signs for the stock investors which he says you should “ignore at your own peril.” As he notes:
“In short, these signals are saying the S&P 500 is set up for a monster 2H rally. We are not ignoring the negative signal of a plunge in interest rates, nor saying that a full-blown trade war is negative for the World. But, we believe the trifecta of strong US corporates, positive White House (towards biz) and dovish Fed, are major supports for the US equity market.”
His view is that the short-term disruption of the market over “trade” issues is an opportunity for investors to increase equity exposure.
Over the last few weeks, we had discussed the excessive deviation to the market above the 200-dma, which suggested that a reversal of that extension was probable. The question now is whether Tom’s view is correct?
Are the markets set up for “monster second-half rally,” or is this just the continuation of the topping process that began last year.
While these are certainly reasons to be “hopeful” that stocks will continue to rise into the future, “hope” has rarely been a fruitful investment strategy longer term. Therefore, let’s analyze each of the arguments from both perspectives to eliminate “confirmation bias.”
Economic Growth To Improve
No matter where you look as of late, economic growth has been pretty dismal. However, there is always hope for improvement that could support a recovery in asset prices.
“Still, many analysts remain optimistic that the U.S. economy can continue expanding even if growth slows down. The Citigroup Economic Surprise Index for the U.S., which measures broadly whether data points are meeting expectations, has risen sharply in recent weeks.” – WSJ
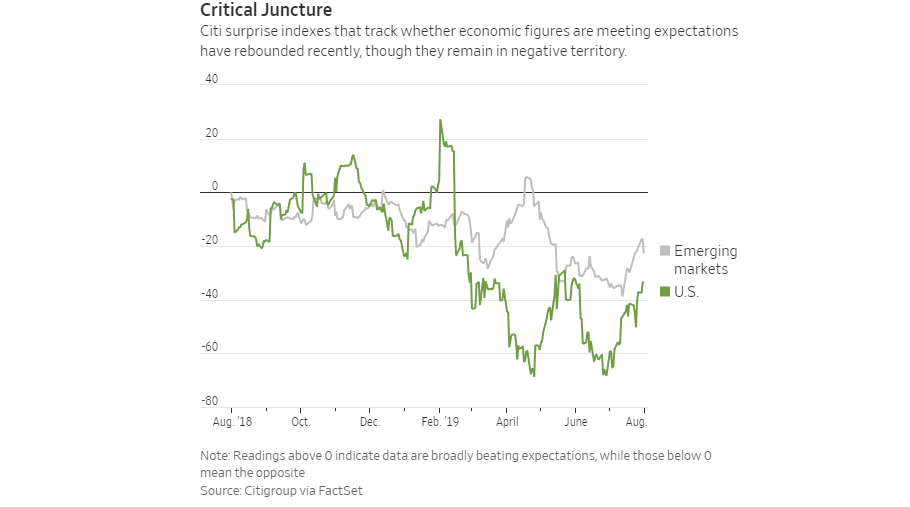
After a recent slate of feeble economic data points, the improvement should come as no real surprise. The quarterly, or annual comparisons, can certainly show some improvement. However, it should be noted the improvement is still within the context of a very negative environment, or rather, the data is just “less negative,” rather than “positive.”
This can be seen more clearly in our economic composite index, which is a broad measure of the U.S. economy including both the service and manufacturing sectors.
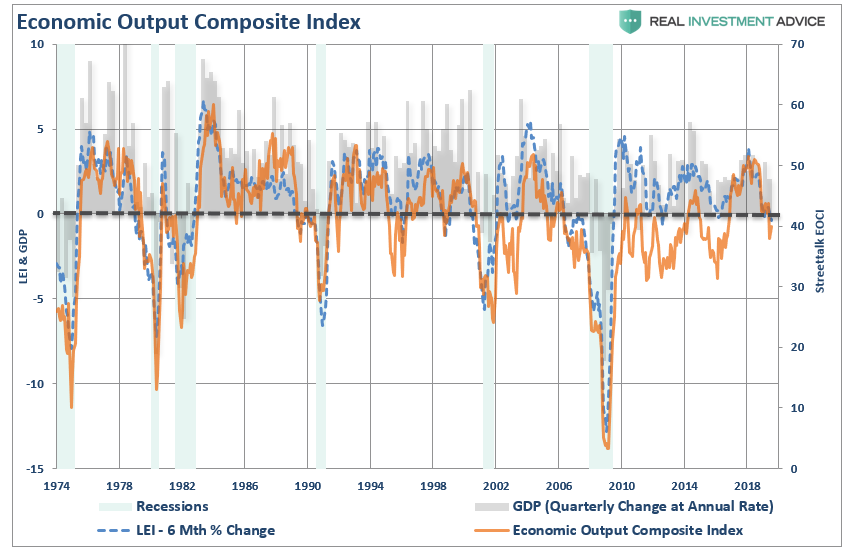
The problem for the bullish case is that 10-years into the current advance, there is little lifting power for monetary policy at this juncture. Yes, lower rates from the Fed could indeed provide a short-term bump to markets based solely on momentum. However, the ability to pull-forward accelerated rates of consumption to increase economic growth is much less likely. Most likely, the short-term increase in “less negative” data will turn lower as we move further into the year.
Volatility Signals A Bottom?
Volatility, as measured by the volatility index, spiked up recently. For the bulls, the spike in volatility has been a “siren’s song,” to “buy the f***ing dip.” This has been a winning strategy for investors over the last 10-years.
Is this time different? Take a look at the chart below. The volatility index is inverted for clarity purposes. The red vertical dashed line is when the monthly sell signal was issued, suggesting a reduction in equity risk in portfolios. The blue vertical dashed line is when the volatility index bottomed with extreme complacency and volatility begin a regime of trending higher.
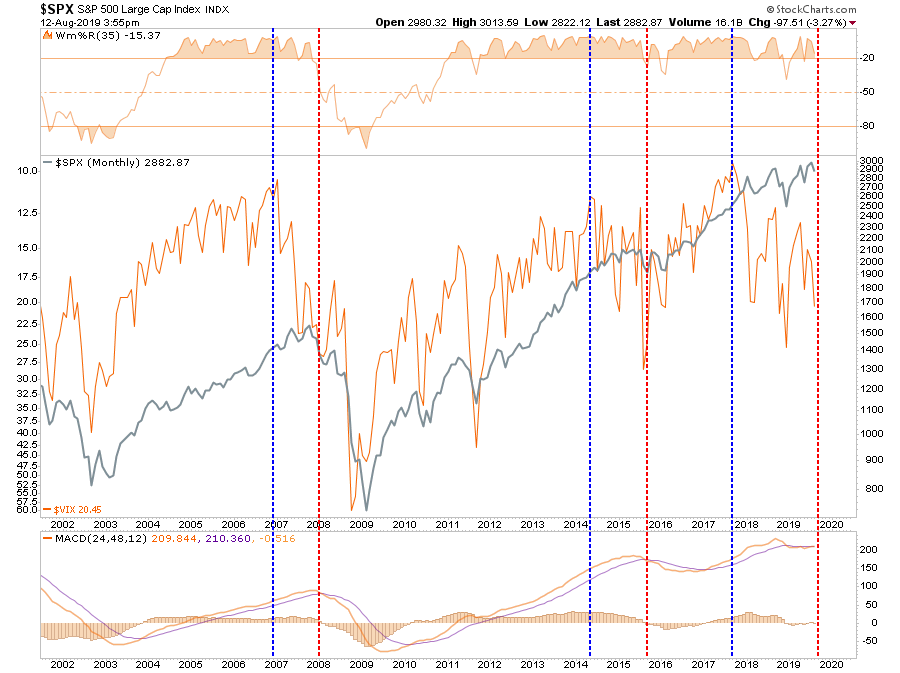
The change in the trend of the volatility, trending lower to trending higher, is a hallmark of previous bull market peaks.
While the market is short-term oversold, combined with a surge in the VIX, the market will likely bounce short-term. However, with volatility now trending higher, that rally could be short-lived if a larger corrective cycle is beginning to take hold.
Earnings Not That Bad
“For Q2 2019 (with 77% of the companies in the S&P 500 reporting actual results), 76% of S&P 500
companies have reported a positive EPS surprise and 59% of companies have reported a positive revenue surprise.” – FactSet
On an operating basis, corporate earnings are providing the bulls boost of optimism, as hopefully, the “trade war” impact is limited. Earnings are strong, so prices should be higher.
Here’s the problem with that analysis.
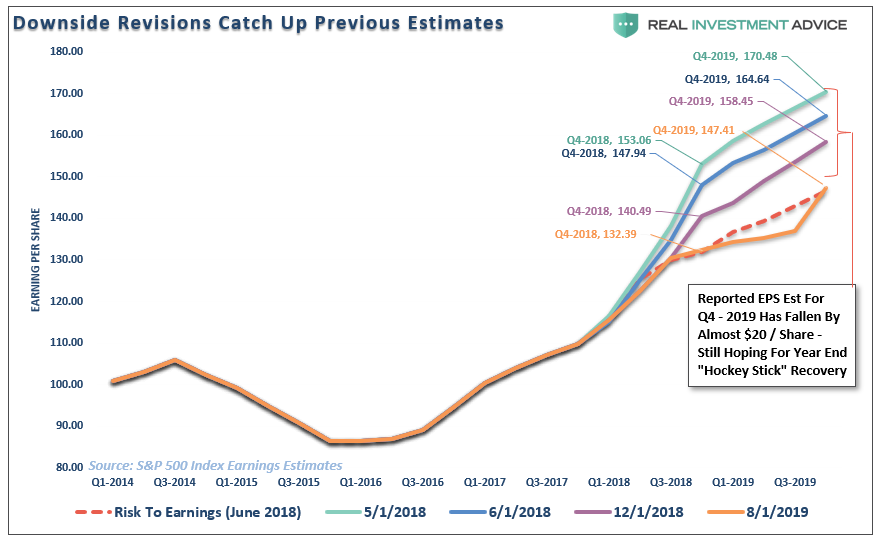
As shown, for 76% of companies to beat estimates, those estimates had to be dramatically lowered. More importantly, as shown in the chart below, if we look at corporate profits for all companies, a more dire picture emerges. (The chart below strips out the profits from the Federal Reserves balance sheet.)
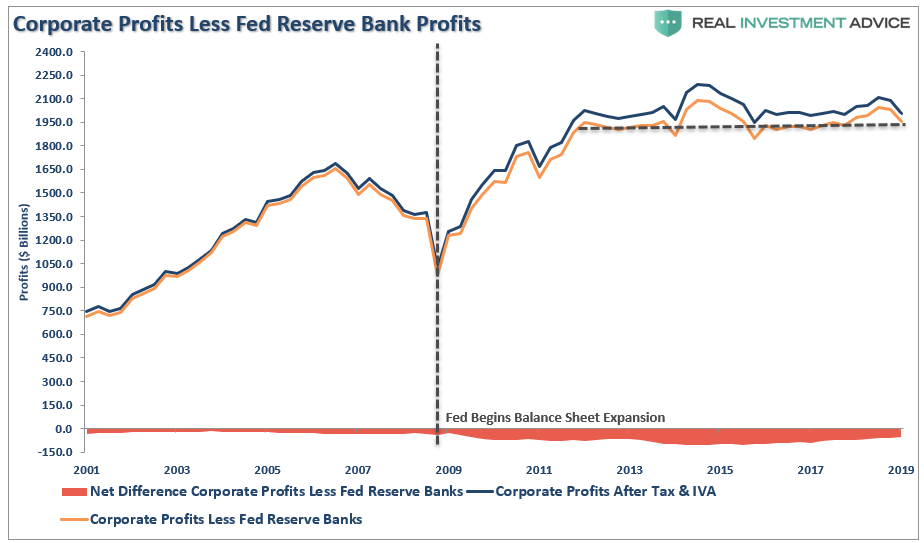
Despite a near 300% increase in the financial markets over the last decade, corporate profits haven’t grown since 2011. Importantly, corporate profits, have turned lower in the first quarter and that slide is continuing into the second. I have compared corporate profits, less Federal Reserve, to the Wilshire 5000 for a more comparative index.
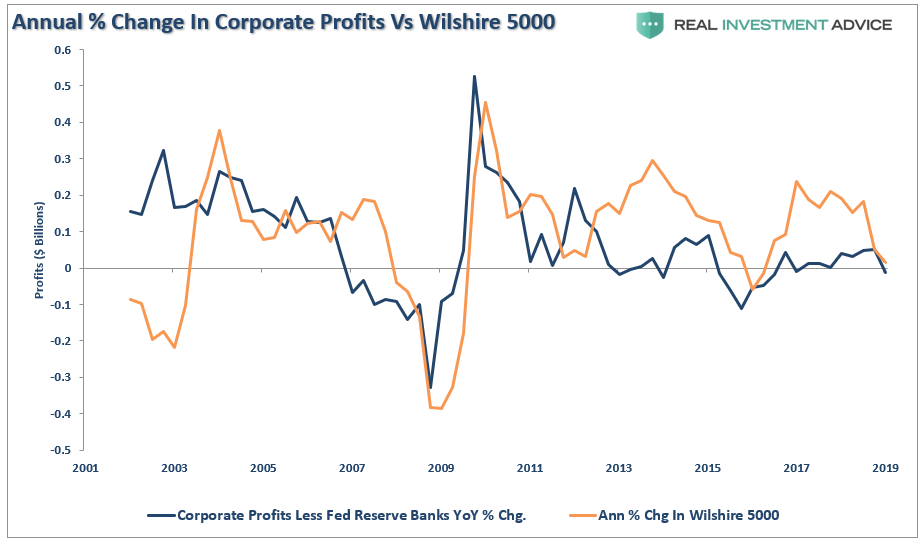
The slide in corporate profits suggests weaker asset prices in the future as the economy, and ultimately corporate profits, continue to slow.
Sentiment Is Bearish
As Tom Lee noted in his “plea” for investors to “buy equities,” investor sentiment, very short-term is indeed negative. As shown in the chart below, the spread between bullish and bearish investors (according to AAII) is currently at -26. This is indeed a pretty bearish tilt and does suggest a short-term bottom is likely.
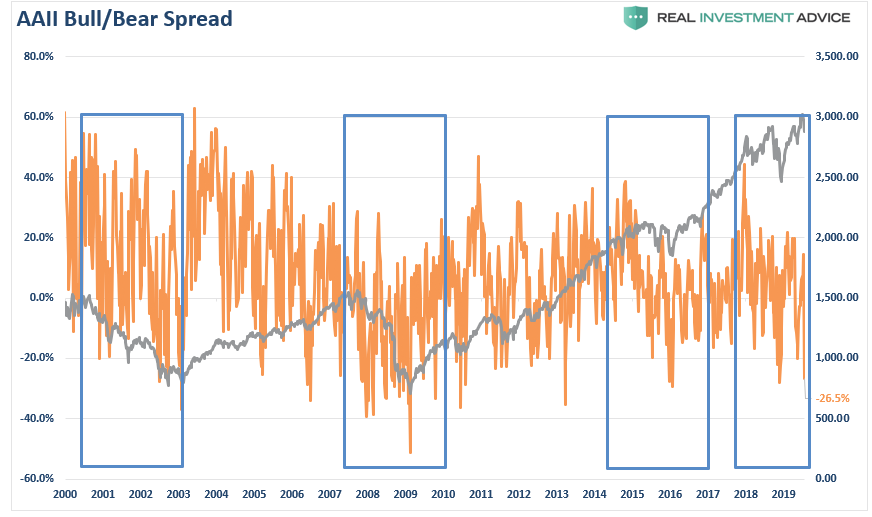
While that statement is true, it is a VERY short-term indicator more useful for trading rather than investing.
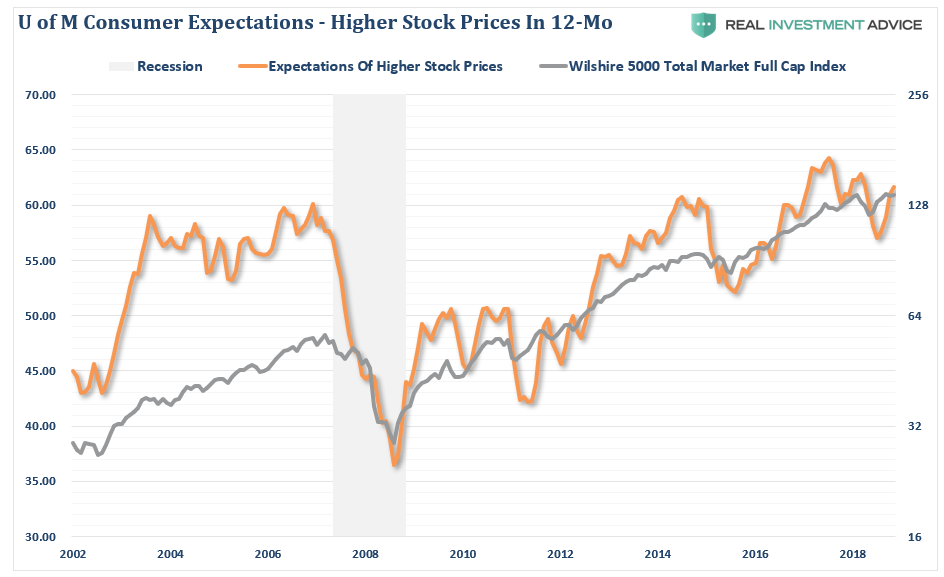
However, on a longer-term basis, we see that investor confidence is just about as bullish as it can get with investors outlook for stock price increases over the next 12-months near the highest levels on record.
The same is true when we look at the Commitment of Traders (COT) report which shows that speculators are just about as long as they can be in the markets.
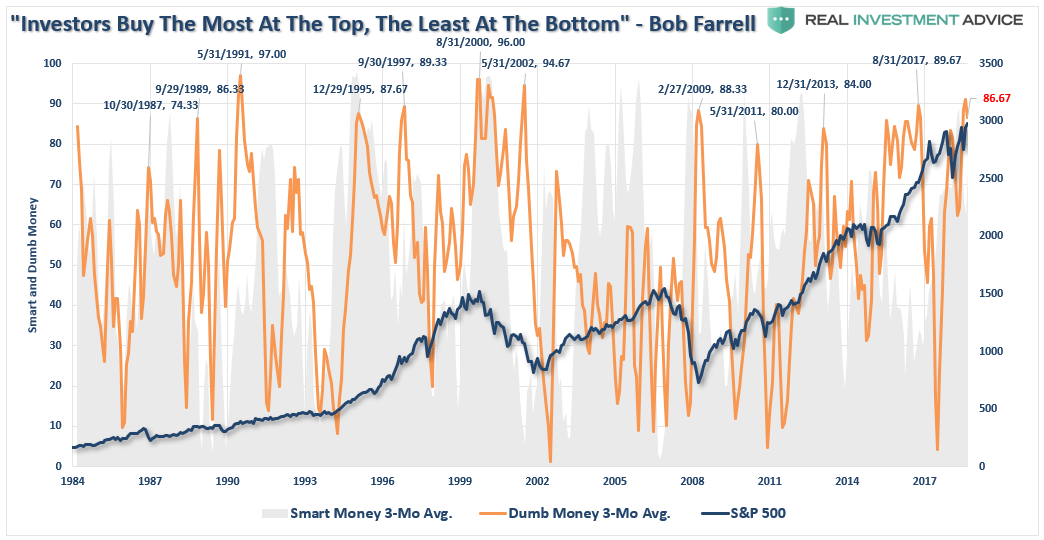
While short-term the market could indeed rally over the next couple of weeks, investor sentiment suggests that the topping process for the markets is set to continue for a while longer.
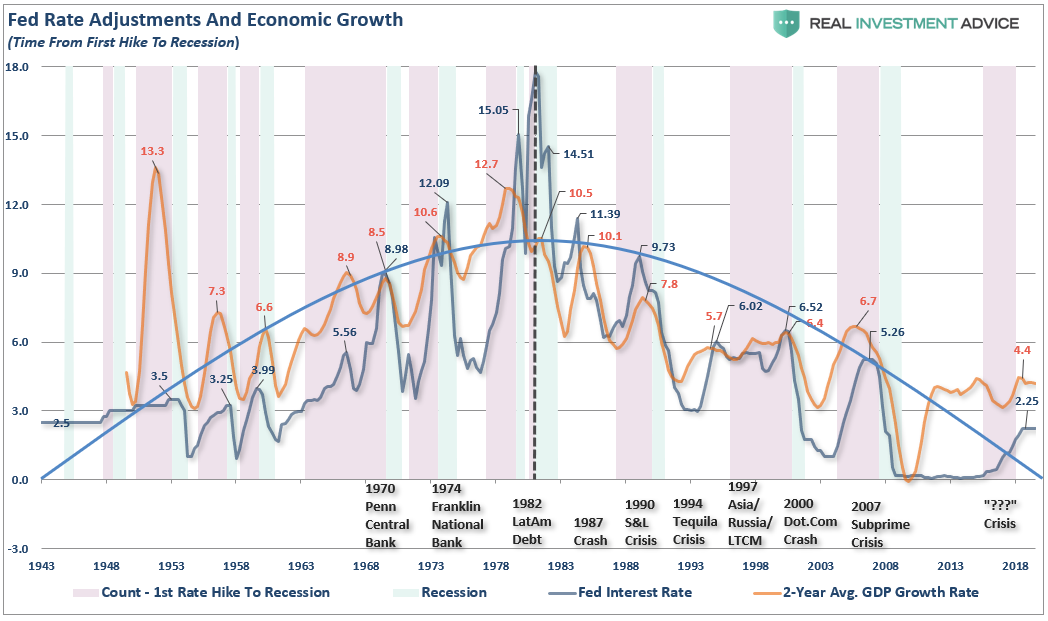
The Fed Is Cutting Rates
Another one of Tom Lee’s points is that when the Fed cuts rates, it has previously led to a positive return over the next 6-months.
That is a true statement.
The problem is that Tom Lee isn’t going to tell you to “sell” in 6-months. There will find another reason to tell you to be bullish. This is the problem with the mainstream media, the market is “always a buy” in order to keep you buying the “products” Wall Street is selling.
For investors, the outcome of the Fed cutting rates is not a function of stronger economic growth, but a response to weaker growth, declining profitability, and lower asset prices. As I wrote last week:
“This suggests that the Fed’s ability to stem the decline of the next recession, or offset a financial shock to the economy from falling asset prices, may be much more limited than the Fed, and most investors, currently believe.
The Fed has a long history of making policy mistakes which has led to negative outcomes, crisis, bear markets, and recessions.”
It is becomingly increasingly clear from a variety of inputs that deflationary pressures are mounting in the economy. Recent declines in manufacturing, and production reports, along with the collapse in commodity prices, all suggest that something is amiss in the production side of the economy.
The Fed is going to cut rates further. Unfortunately, those rate cuts are not going to lead to higher asset prices.
What Should You Do Next
With the current bull market already up more than 300% of the 2009 lows, valuations elevated, and signs of economic weakness on the rise, investors should be questioning the potential “reward” for accelerating “risk” exposure currently. \
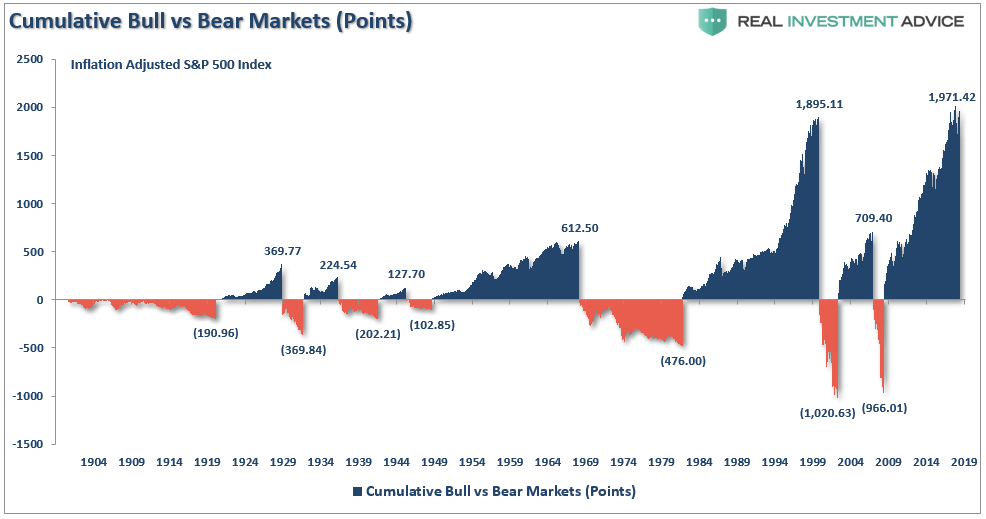
Ultimately, stocks are not magical pieces of paper that provide double-digit returns, every single year, over long-term time frames. Just five periods in history account for almost all the returns of the markets over the last 120 years. The other periods wiped out a bulk of the previous advance.
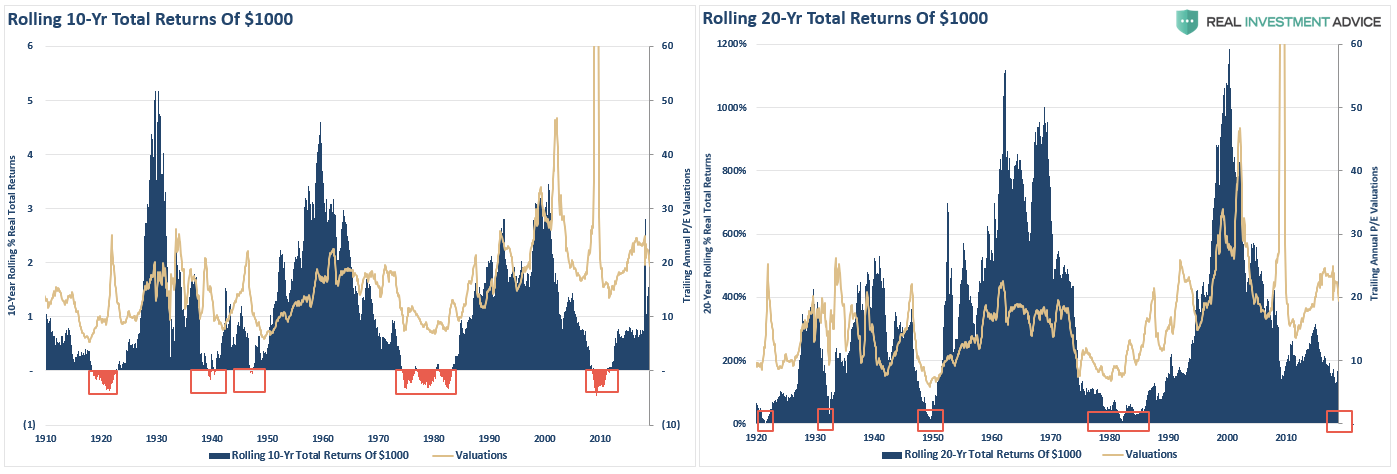
Too often it is forgotten during that “thrill of the chase” that stocks are ownership units of businesses. While that seems banal, future equity returns are simply a function of the value you pay today for a share of future profits.
The chart below shows that rolling 20-year real total returns from current valuation levels have been substantially less optimistic.
What is important for investors is to understand each argument and its relation to longer-term investment periods. In the short-term, Tom’s view may well be validated as current momentum and bullish “biases” persist in the markets.
However, for longer-term investors, it is worth considering the historical outcomes of the dynamics behind the financial markets currently. The is a huge difference between a short-term bullish prediction and longer-term bearish dynamics.
As Howard Ruff once stated:
“It wasn’t raining when Noah built the ark.”


