
Technical Market Report For Saturday, June 4
The good news is:
- The secondaries outperformed the blue chips last week.
The Negatives
- Seasonality turns negative next week.
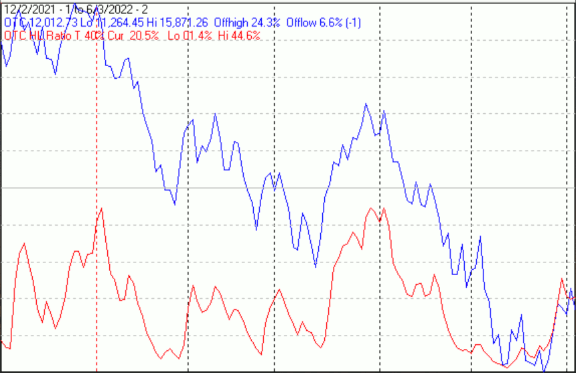
The first chart covers the past 6 months showing the Nasdaq composite (OTC) in blue and a 40% trend (4 day EMA) of Nasdaq new highs divided by new highs + new lows (OTC HL Ratio), in red. Dashed vertical lines have been drawn on the 1st trading day of each month. Dashed horizontal lines have been drawn at 10% levels for the indicator; the line is solid at the 50%, neutral level (equal numbers of new highs and new lows).
OTC HL Ratio has remained negative for over 6 months.
The Positives
The next chart is similar to the previous one except it shows the S&P 500 (SPX) in red and NY HL ratio, in blue, has been calculated with NYSE data.
NY HL Ratio remained positive finishing the week at 62%,

The next chart covers the past 6 months showing the SPX in red and a 10% trend (19 day EMA) of NYSE new lows (NY NL), in blue. NY NL has been plotted on an inverted Y axis so decreasing numbers of new lows move the indicator upward (up is good).
NY NL continued moving upward. The actual numeric level at 210 down from 300 last week is still frightfully high.

The next chart is similar to the previous one except it shows the OTC in blue and OTC NL, in brown, has been calculated with Nasdaq data.
OTC NL is also moving sharply upward. The numerical level at 378 down from 487 a week ago is still uncomfortably high.

Seasonality
Next week includes the 5 trading days prior to the 2nd Friday of June during the 2nd year of the Presidential Cycle. The tables below show the daily change, on a percentage basis, for that period.
OTC data covers the period from 1963 to 2021 while SPX data runs from 1953 to 2021. There are summaries for both the 2nd year of the Presidential Cycle and all years combined. Prior to 1953 the market traded 6 days a week so that data has been ignored.
Average returns for the coming week have been negative by all measures.
Report for the week before the 2nd Friday of June.

The number following the year is the position in the Presidential Cycle.

Daily returns from Monday to 2nd Friday.

OTC Presidential Year 2 (PY2)

 Year       Mon     Tue     Wed    Thur    Fri    Totals

 1966-2   0.25%  -0.52%  -0.63%   0.00%   0.51%  -0.39%

 1970-2  -2.19%  -0.49%   1.17%   0.13%  -1.12%  -2.50%

 1974-2   0.25%  -0.69%  -0.29%   0.17%  -0.58%  -1.14%

 1978-2   0.88%   0.61%   0.20%   0.72%   0.34%   2.76%


 1982-2  -0.56%  -0.32%  -1.35%   0.25%   1.27%  -0.71%

 1986-2  -1.38%  -0.48%   0.66%   0.28%   0.77%  -0.15%

 1990-2   0.75%  -0.21%   0.08%  -0.19%  -0.69%  -0.27%

 1994-2   0.14%  -0.56%  -1.29%  -0.12%   0.74%  -1.09%

 1998-2   0.27%   0.73%  -1.53%  -1.33%  -0.27%  -2.12%


 Avg     -0.15%  -0.17%  -0.68%  -0.22%   0.36%  -0.87%


 2002-2  -0.31%  -2.19%   1.47%  -1.47%   0.53%  -1.97%

 2006-2  -2.24%  -0.32%  -0.51%  -0.30%  -0.48%  -3.85%

 2010-2  -2.04%  -0.15%  -0.54%   2.77%   1.12%   1.16%

 2014-2   0.34%   0.04%  -0.14%  -0.79%   0.30%  -0.24%

 2018-2   0.69%   0.41%   0.67%  -0.70%   0.14%   1.21%


 Avg     -0.71%  -0.44%   0.19%  -0.10%   0.32%  -0.74%


 OTC summary for PY2 (1966 - 2018)

 Avg     -0.37%  -0.30%  -0.14%  -0.04%   0.18%  -0.66%

 Win%       57%     29%     43%     46%     64%     21%


OTC summary for all years 1963 - 2021

 Avg     -0.14%  -0.16%   0.05%  -0.02%   0.04%  -0.22%

 Win%       53%     32%     53%     64%     59%     39%

-

SPX PY2

 Year       Mon     Tue     Wed    Thur    Fri    Totals

 1954-2  -0.38%  -2.24%  -0.67%   0.67%   0.85%  -1.77%

 1958-2  -0.16%  -0.20%   0.02%   0.58%   0.60%   0.85%


 1962-2  -3.55%   0.52%   1.42%   0.02%   0.09%  -1.50%

 1966-2  -0.74%  -0.69%   0.12%   0.67%   1.10%   0.45%

 1970-2   0.16%  -0.05%  -1.01%  -1.36%  -0.32%  -2.59%

 1974-2   0.59%  -0.88%  -0.24%   0.30%  -1.13%  -1.35%

 1978-2   1.84%   0.37%  -0.20%   0.09%  -0.28%   1.83%


 Avg     -0.34%  -0.15%   0.02%  -0.06%  -0.11%  -0.63%


 1982-2   0.03%  -0.44%  -0.58%   0.57%   1.49%   1.05%

 1986-2  -2.32%  -0.16%   0.65%   0.15%   1.76%   0.07%

 1990-2   1.17%  -0.21%  -0.46%  -0.50%  -1.22%  -1.22%

 1994-2  -0.27%  -0.15%  -0.25%   0.18%   0.18%  -0.32%

 1998-2   0.16%   0.24%  -0.55%  -1.59%   0.38%  -1.35%


 Avg     -0.25%  -0.14%  -0.24%  -0.24%   0.52%  -0.35%


 2002-2   0.31%  -1.66%   0.66%  -1.05%  -0.23%  -1.97%

 2006-2  -1.78%  -0.11%  -0.61%   0.14%  -0.45%  -2.81%

 2010-2  -1.35%   1.10%  -0.59%   2.95%   0.44%   2.54%

 2014-2   0.09%  -0.02%  -0.35%  -0.71%   0.31%  -0.68%

 2018-2   0.45%   0.07%   0.86%  -0.07%   0.31%   1.62%


 Avg     -0.46%  -0.13%  -0.01%   0.25%   0.08%  -0.26%


SPX summary for PY2 (1954 - 2018)

 Avg     -0.34%  -0.27%  -0.11%   0.06%   0.23%  -0.42%

 Win%       53%     29%     35%     65%     65%     41%


SPX summary for all years 1953 - 2021

 Avg     -0.18%  -0.07%   0.04%   0.01%   0.14%  -0.05%

 Win%       46%     43%     47%     58%     59%     46%
Conclusion
The breadth indicators are mixed, improving, but not good.
Seasonality is turning negative.
The strongest sectors last week were Energy and Tech while the weakest were Biotech and Health care.
I expect the major averages to be lower on Friday June 10 than they were on Friday June 3.
Last week's positive forecast was a miss.

Comments
 No Thumbs up yet!

