
Technical Market Report For Saturday, July 24
Technical Market Report for Saturday, July 24, 2021
The good news is that the Nasdaq composite (OTC), S&P 500 (SPX), and Dow Jones Industrial Average (DJIA) all closed at all-time highs last Friday.
The Negatives
New highs continued to deteriorate while new lows rose to threatening levels on both the Nasdaq and NYSE.
The first chart covers the past six months, showing the OTC in blue and a 10% trend (19-day EMA) of Nasdaq new highs (OTC NH) in green. Dashed vertical lines have been drawn on the first trading day of each month. The OTC NH hit a new six-month low as the index hit an all-time high.

The next chart is similar to the first one, except it shows the SPX in red and the NY NH in green. The information has been calculated with NYSE data. Similar action was seen in the NY NH and the SPX.

The next chart covers the past six months, showing the OTC in blue and a 10% trend (19-day EMA) of Nasdaq new lows (OTC NL) in brown. The OTC NL has been plotted on an inverted Y axis, so decreasing numbers of new lows move the indicator upward (up is good). The OTC NL has been falling as the index has been rising. Not good.

The next chart is similar to the one above, except is shows the SPX in red and the NY NL in blue. The information has been calculated with NYSE data. Similar action was seen in the NY NL and the SPX.

The Positives
New highs increased enough last week to stay ahead of new lows.
The next chart covers the past six months, showing the OTC in blue, and a 40% trend (four-day EMA) of Nasdaq new highs divided by new highs + new lows (OTC HL Ratio) in red. Dashed horizontal lines have been drawn at 10% levels for the indicator; the line is solid at the 50% neutral level. The OTC HL Ratio managed to get into positive territory at the end of the week.

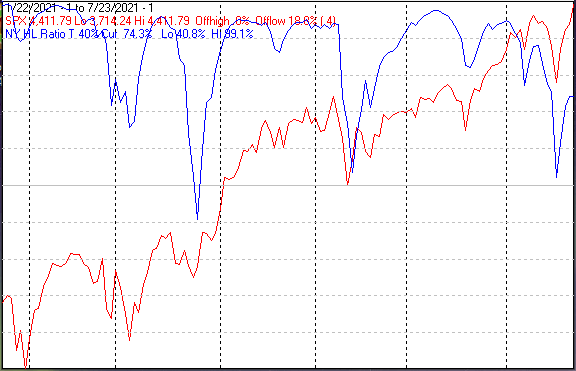
The next chart is similar to the previous one, except it shows the SPX in red and the NY HL ratio in blue. The information has been calculated with NYSE data. The NY HL Ratio finished the week at a comfortable 74%.
Seasonality
Next week includes the last five trading days of July during the first year of the Presidential Cycle. The tables below show the daily change on a percentage basis for that period.
OTC data covers the period from 1963 to 2020, while SPX data runs from 1928 to 2020. There are summaries for both the first year of the Presidential Cycle and all years combined. Average returns for the coming week have been modestly positive.
The number following the year represents its position in the Presidential Cycle. The number following the daily return represents the day of the week:
- 1 = Monday, 2 = Tuesday, etc.
OTC Presidential Year 1 (PY1)
Year Day 5 Day 4 Day 3 Day 2 Day 1 Totals
1965-1 0.66% 1 0.08% 2 -0.17% 3 0.13% 4 0.74% 5 1.43%
1969-1 -0.13% 5 -1.39% 1 -1.63% 2 -1.33% 3 -0.58% 4 -5.06%
1973-1 0.83% 3 -0.02% 4 0.17% 5 -0.44% 1 -0.22% 2 0.33%
1977-1 -0.10% 1 -0.59% 2 -1.12% 3 -0.56% 4 -0.03% 5 -2.40%
1981-1 0.68% 1 -0.24% 2 0.02% 3 0.52% 4 0.76% 5 1.74%
1985-1 0.24% 4 0.06% 5 -1.21% 1 -0.12% 2 0.23% 3 -0.79%
1989-1 0.11% 2 0.59% 3 0.75% 4 0.08% 5 0.23% 1 1.75%
1993-1 0.61% 1 -0.50% 2 0.65% 3 0.23% 4 -0.36% 5 0.64%
1997-1 0.03% 5 -0.39% 1 0.56% 2 1.00% 3 0.36% 4 1.57%
Avg: 0.34% -0.10% 0.16% 0.34% 0.24% 0.98%
2001-1 1.28% 3 1.95% 4 0.30% 5 -0.55% 1 0.46% 2 3.44%
2005-1 -0.60% 1 0.43% 2 0.47% 3 0.56% 4 -0.62% 5 0.24%
2009-1 0.10% 1 0.39% 2 -0.39% 3 0.84% 4 -0.29% 5 0.64%
2013-1 0.71% 4 0.22% 5 -0.39% 1 0.48% 2 0.27% 3 1.30%
2017-1 0.02% 2 0.16% 3 -0.63% 4 -0.12% 5 -0.41% 1 -0.98%
Avg: 0.30% 0.63% -0.13% 0.24% -0.12% 0.93%
OTC sSmmary for PY1 1965 - 2017
- Averages: 0.32% 0.05% -0.19% 0.05% 0.04% 0.27%
- % Winners: 79% 57% 50% 57% 50% 71%
- MDD: 7/31/1969: 4.97% -- 7/29/1977: 2.39% -- 7/30/1985: 1.32%
OTC Summary for All Years 1963 - 2020
- Averages: 0.04% 0.02% -0.11% -0.01% -0.03% -0.09%
- % Winners: 53% 48% 45% 60% 50% 57%
- MDD: 7/28/2000: 9.10% -- 7/31/1974: 6.22% -- 7/31/1969: 4.97%
SPX PY1
Year Day 5 Day 4 Day 3 Day 2 Day 1 Totals
1929-1 -0.38% 5 -0.38% 6 -1.30% 1 1.14% 2 1.33% 3 0.41%
1933-1 -1.71% 2 2.62% 3 0.85% 4 -2.34% 5 -4.60% 1 -5.19%
1937-1 -0.12% 2 -1.53% 3 -0.36% 4 0.30% 5 1.25% 6 -0.45%
1941-1 0.48% 6 0.77% 1 -0.19% 2 -0.48% 3 -0.10% 4 0.49%
1945-1 0.96% 3 -2.04% 4 0.49% 5 1.04% 1 0.41% 2 0.86%
1949-1 0.34% 1 0.80% 2 0.00% 3 -0.13% 4 0.00% 5 1.01%
1953-1 -0.66% 1 0.17% 2 0.62% 3 0.95% 4 1.06% 5 2.14%
1957-1 0.00% 4 -0.33% 5 -1.09% 1 0.00% 2 -0.02% 3 -1.44%
Avg: 0.22% -0.13% -0.04% 0.27% 0.27% 0.61%
1961-1 0.55% 2 0.94% 3 1.17% 4 0.15% 5 0.07% 1 2.88%
1965-1 -0.02% 1 -0.21% 2 0.19% 3 0.77% 4 0.67% 5 1.40%
1969-1 -0.91% 5 -1.90% 1 -0.81% 2 0.50% 3 2.11% 4 -1.00%
1973-1 1.39% 3 0.19% 4 -0.24% 5 -0.31% 1 -0.94% 2 0.09%
1977-1 -0.81% 1 -0.58% 2 -1.63% 3 0.15% 4 0.06% 5 -2.79%
Avg: 0.04% -0.31% -0.26% 0.25% 0.40% 0.12%
1981-1 1.12% 1 -0.59% 2 0.02% 3 0.66% 4 0.70% 5 1.91%
1985-1 0.25% 4 0.18% 5 -1.46% 1 0.17% 2 0.52% 3 -0.33%
1989-1 0.06% 2 1.25% 3 1.17% 4 0.05% 5 1.15% 1 3.67%
1993-1 0.45% 1 -0.19% 2 -0.23% 3 0.68% 4 -0.47% 5 0.23%
1997-1 -0.16% 5 -0.25% 1 0.62% 2 1.06% 3 0.21% 4 1.49%
Avg: 0.34% 0.08% 0.02% 0.52% 0.42% 1.39%
2001-1 1.61% 3 1.04% 4 0.24% 5 -0.11% 1 0.56% 2 3.34%
2005-1 -0.38% 1 0.17% 2 0.46% 3 0.56% 4 -0.77% 5 0.05%
2009-1 0.30% 1 -0.26% 2 -0.46% 3 1.19% 4 0.07% 5 0.84%
2013-1 0.26% 4 0.08% 5 -0.37% 1 0.04% 2 -0.01% 3 -0.01%
2017-1 0.29% 2 0.03% 3 -0.10% 4 -0.13% 5 -0.07% 1 0.02%
Avg: 0.42% 0.21% -0.05% 0.31% -0.04% 0.85%
SPX Summary for PY1 1929 - 2017
- Averages: 0.13% 0.00% -0.10% 0.26% 0.14% 0.42%
- % Winners: 57% 52% 43% 70% 61% 70%
- MDD: 7/31/1933: 6.84% -- 7/29/1969: 3.58% -- 7/27/1977: 2.98%
SPX Summary for All Years 1928 - 2020
- Averages: -0.03% 0.03% 0.09% 0.12% 0.05% 0.25%
- % Winners: 55% 58% 51% 60% 60% 56%
- MDD: 7/26/1934: 7.83% -- 7/31/1933: 6.84% -- 7/31/1974: 6.68%
Conclusion
Last week was the opposite of the week before. The blue chip indices finished the week at all-time highs and were a bit overbought. Every measure of breadth failed to confirm the new index highs.
The strongest sectors last week were technology and healthcare, while the weakest were precious metals and energy services. I expect the major averages to be lower on Friday, July 30 than they were on Friday, July 23. Last week's negative forecast was a miss.


