
Technical Market Report For Saturday, July 10
Technical Market Report for Saturday, July 10, 2021
The good news is that the Nasdaq composite (OTC), S&P 500 (SPX), and Dow Jones Industrial Average (DJIA) all closed at all-time highs last Friday.
The Negatives
New highs continued to deteriorate, indicating narrowing leadership, while blue chip index prices hit new highs. The secondaries, represented by the Russell 2000 (R2K), fell for the second week in a row.
The first chart covers the past six months, showing the OTC in blue and a 10% trend (19-day EMA) of Nasdaq new highs (OTC NH) in green. Dashed vertical lines have been drawn on the first trading day of each month. Not only did the OTC NH fail to confirm the all-time index high by a wide margin, it declined while the index was rising.

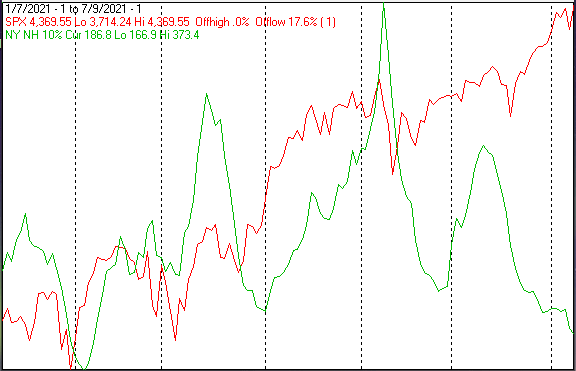
The next chart is similar to the first one, except it shows the SPX in red and the NY NH in green. The information has been calculated with NYSE data. Similar action was seen for the NY NH and the SPX.
The Positives
The number of new lows remained non-threatening.
The next chart covers the past six months, showing the OTC in blue and a 40% trend (four-day EMA) of Nasdaq new highs divided by new highs + new lows (OTC HL Ratio) in red. Dashed horizontal lines have been drawn at 10% levels for the indicator; the line is solid at the 50%, neutral level. The OTC HL Ratio declined sharply, but it finished the week at a positive 62%.

The next chart is similar to the one above, except it shows the SPX in red and the NY HL ratio in blue. The information has been calculated with NYSE data. The NY HL Ratio finished the week at a comfortable 84%.

Seasonality
Next week includes the five trading days prior to the third Friday of July during the first year of the Presidential Cycle. The tables below show the daily change on a percentage basis for that period.
OTC data covers the period from 1963 to 2020, while SPX data runs from 1953 to 2020. There are summaries for both the first year of the Presidential Cycle and all years combined. Prior to 1953 the market traded six days a week, so that data has been ignored.
Average returns for the coming week have been positive during the first year of the Presidential Cycle and negative during the other years. The number following the year is the position in the Presidential Cycle.
OTC Presidential Year 1 (PY1)
Year Mon Tue Wed Thur Fri Totals
1965-1 0.47% 0.27% -0.04% 0.99% 2.06% 3.75%
1969-1 0.00% -0.35% -0.99% -0.56% -0.13% -2.04%
1973-1 0.91% 0.64% 1.08% 0.71% 1.09% 4.43%
1977-1 0.04% -0.10% 0.18% 0.00% 0.48% 0.59%
1981-1 -1.64% -1.00% -0.49% 0.12% 0.77% -2.24%
1985-1 0.21% 0.70% 0.85% -0.29% 0.29% 1.77%
1989-1 0.22% -0.45% 0.75% -0.44% 0.01% 0.09%
1993-1 0.26% 0.11% 0.57% -0.53% -1.26% -0.85%
1997-1 -0.76% 1.80% 0.24% 0.09% 0.03% 1.41%
Avg: -0.34% 0.23% 0.39% -0.21% -0.03% 0.03%
2001-1 -2.67% 1.88% -2.47% 1.51% -0.84% -2.59%
2005-1 1.07% 0.36% 0.04% 0.41% 0.18% 2.06%
2009-1 1.20% 0.36% 0.53% 2.45% -0.39% 4.16%
2013-1 0.21% -0.25% 0.32% 0.04% -0.66% -0.34%
2017-1 0.03% 0.47% 0.64% 0.08% -0.04% 1.18%
Avg: -0.03% 0.57% -0.19% 0.90% -0.35% 0.89%
OTC Summary for PY1 1965 - 2017
- Avg: -0.03% 0.32% 0.09% 0.35% 0.11% 0.81%
- Win%: 77% 64% 71% 69% 57% 64%
OTC Summary for All Years 1963 - 2020
- Avg: -0.05% -0.10% 0.03% 0.00% -0.21% -0.33%
- Win%: 58% 40% 51% 56% 41% 43%
SPX PY1
Year Mon Tue Wed Thur Fri Totals
1953-1 -0.98% -0.37% 0.29% 0.12% 0.70% -0.24%
1957-1 0.10% -0.51% -0.61% -0.10% 0.10% -1.02%
1961-1 -0.75% -0.59% 0.45% 0.02% 0.23% -0.64%
1965-1 -0.02% -0.12% 0.33% -0.17% -0.03% -0.02%
1969-1 0.00% -1.51% -0.43% -0.34% -0.91% -3.18%
1973-1 1.52% 0.05% 0.60% 0.19% 0.55% 2.90%
1977-1 -0.24% -0.10% 0.14% 0.00% 0.59% 0.39%
Avg: 0.13% -0.45% 0.22% -0.08% 0.09% -0.11%
1981-1 -1.56% -0.30% -0.94% 0.21% 0.83% -1.75%
1985-1 -0.29% 1.04% 0.48% -0.65% 0.39% 0.96%
1989-1 0.18% -0.33% 1.32% -0.66% 0.72% 1.23%
1993-1 0.19% -0.20% 0.44% -0.19% -0.77% -0.53%
1997-1 -0.26% 2.30% 0.28% 0.40% -0.16% 2.56%
Avg: -0.35% 0.50% 0.32% -0.18% 0.20% 0.49%
2001-1 -1.09% 1.00% -0.55% 0.61% -0.34% -0.38%
2005-1 0.63% 0.23% 0.09% 0.26% 0.12% 1.32%
2009-1 1.14% 0.36% -0.05% 2.33% 0.30% 4.09%
2013-1 0.14% -0.37% 0.28% 0.50% 0.16% 0.71%
2017-1 -0.01% 0.06% 0.54% -0.02% -0.04% 0.54%
Avg: 0.16% 0.26% 0.06% 0.74% 0.04% 1.25%
SPX Summary for PY1 1953 - 2017
- Avg: -0.08% 0.04% 0.16% 0.16% 0.14% 0.41%
- Win%: 44% 41% 71% 56% 65% 53%
SPX Summary for All Years 1953 - 2020
- Avg: -0.09% -0.18% 0.04% -0.02% -0.14% -0.38%
- Win%: 48% 36% 54% 57% 46% 41%
Conclusion
Breadth continues to deteriorate, but as long as new lows remain minimal, the blue chip rally can continue. The strongest sectors last week were utilities and healthcare, while the weakest were energy services and banks.
I expect the major averages to be lower on Friday, July 16 than they were on Friday, July 9. The SPX, OTC, and DJIA all closed at all-time highs last Friday, but the Russell 2000 was down for the week. Thus I am calling last week's positive forecast a tie (same as last week).


