
Technical Market Report For Saturday, April 16
The good news is:
- The secondaries outperformed the blue chips last week.
The Negatives
In addition to the ongoing bear market, Seasonality for the coming week is awful.
The first chart covers the past 6 months showing the S&P 500 (SPX) in red and a 10% trend (19 day EMA) of NYSE new highs (NY NH) in green. Dashed vertical lines have been drawn on the 1st trading day of each month.
There were a couple positive days at the beginning of last week which turned NY NH upward, too little too late.

The next chart is similar to the one above except it shows the Nasdaq composite (OTC) in blue and OTC NH, in green, has been calculated with Nasdaq data.
OTC NH has been drifting slowly upward for the past month, but remains at a low level.

The next chart covers the past 6 months showing the OTC in blue and a 40% trend (4 day EMA) of Nasdaq new highs divided by new highs + new lows (OTC HL Ratio), in red. Dashed horizontal lines have been drawn at 10% levels for the indicator; the line is solid at the 50%, neutral level (equal numbers of new highs and new lows).
OTC HL Ratio has remained in negative territory for nearly 5 months.

The next chart is similar to the previous one except it shows the SPX in red and NY HL ratio, in blue, has been calculated with NYSE data.
NY HL Ratio remained in negative territory,

The next chart covers the past 6 months showing the SPX in red and a 10% trend (19 day EMA) of NYSE new lows (NY NL), in blue. NY NL has been plotted on an inverted Y axis so decreasing numbers of new lows move the indicator upward (up is good).
NY NL continued moving downward.
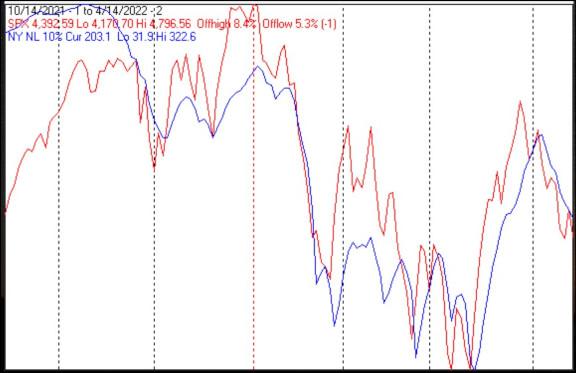
The next chart is similar to the previous one except it shows the OTC in blue and OTC NL, in brown, has been calculated with Nasdaq data.
OTC NL leveled off at a value of about 250 which is seriously weak high.

The Positives
Nothing to say here.
Seasonality
Next week includes the 5 trading days prior to the 4th Friday of April during the 2nd year of the Presidential Cycle. The tables below show the daily change, on a percentage basis, for that period.
OTC data covers the period from 1963 to 2020 while SPX data runs from 1953 to 2020. There are summaries for both the 2nd year of the Presidential Cycle and all years combined. Prior to 1953 the market traded 6 days a week so that data has been ignored.
Average returns for the coming week have been weak by all measures.
Report for the week before the 4th Friday of April.

The number following the year is the position in the Presidential Cycle.

Daily returns from Monday through the 4th Friday.


OTC Presidential Year 2 (PY2)

 Year       Mon     Tue     Wed    Thur    Fri    Totals

 1966-2   0.25%   1.10%   0.03%  -0.81%  -0.07%   0.50%

 1970-2  -1.37%  -1.70%  -1.37%  -1.55%  -2.78%  -8.77%

 1974-2   0.00%   0.00%   0.00%   0.00%   0.00%   0.00%

 1978-2   0.25%   0.60%   0.37%  -0.10%   0.51%   1.63%


 1982-2   0.47%  -0.58%   0.09%  -0.40%   0.30%  -0.12%

 1986-2   0.20%  -0.24%  -0.25%   0.52%   0.21%   0.45%

 1990-2   0.00%   0.00%   0.00%   0.00%   0.00%   0.00%

 1994-2   1.14%   0.47%   0.00%  -0.34%   0.29%   1.56%

 1998-2   0.00%   0.00%   0.00%   0.00%   0.00%   0.00%


 Avg      0.61%  -0.12%  -0.08%  -0.07%   0.27%   0.63%


 2002-2  -2.12%  -1.61%  -0.98%   0.02%  -2.91%  -7.60%

 2006-2   0.00%   0.00%   0.00%   0.00%   0.00%   0.00%

 2010-2  -0.28%  -2.04%   0.01%   1.63%  -2.02%  -2.71%

 2014-2   0.00%   0.00%   0.00%   0.00%   0.00%   0.00%

 2018-2  -0.24%  -1.69%  -0.05%   1.22%   0.02%  -0.76%


 Avg     -0.88%  -1.78%  -0.34%   0.95%  -1.64%  -3.69%


OTC summary for PY2 1966 - 2018

 Avg     -0.19%  -0.63%  -0.27%   0.02%  -0.72%  -1.76%

 Win%       56%     33%     50%     44%     56%     44%


OTC summary for all years 1963 - 2021

 Avg     -0.03%  -0.16%  -0.01%   0.15%  -0.34%  -0.40%

 Win%       58%     45%     70%     67%     48%     58%


SPX PY2

 Year       Mon     Tue     Wed    Thur    Fri    Totals

 1954-2   0.36%  -0.43%   0.00%   1.51%   0.28%   1.73%

 1958-2   0.00%   0.00%   0.00%   0.00%   0.00%   0.00%


 1962-2   0.00%   0.00%   0.00%   0.00%   0.00%   0.00%

 1966-2  -0.21%  -0.10%  -0.25%  -0.69%  -0.08%  -1.32%

 1970-2   0.19%  -0.52%  -1.30%  -1.46%  -0.33%  -3.42%

 1974-2   0.00%   0.00%   0.00%   0.00%   0.00%   0.00%

 1978-2   1.52%   0.91%   0.19%  -0.99%   1.01%   2.63%


 Avg      0.50%   0.10%  -0.45%  -1.05%   0.20%  -0.70%


 1982-2   0.52%  -1.06%  -0.63%  -0.96%   0.27%  -1.86%

 1986-2   0.97%  -0.95%  -0.28%   0.11%   0.11%  -0.03%

 1990-2   0.00%   0.00%   0.00%   0.00%   0.00%   0.00%

 1994-2   1.13%  -0.19%   0.00%  -0.61%   0.40%   0.74%

 1998-2   0.00%   0.00%   0.00%   0.00%   0.00%   0.00%


 Avg      0.88%  -0.73%  -0.45%  -0.49%   0.26%  -0.38%


 2002-2   0.00%  -2.15%  -0.71%  -0.15%  -1.39%  -4.40%

 2006-2   0.00%   0.00%   0.00%   0.00%   0.00%   0.00%

 2010-2  -0.43%  -2.34%   0.65%   1.29%  -1.66%  -2.49%

 2014-2   0.00%   0.00%   0.00%   0.00%   0.00%   0.00%

 2018-2   0.01%  -1.34%   0.18%   1.03%   0.11%  -0.01%


 Avg     -0.21%  -1.94%   0.04%   0.72%  -0.98%  -2.30%


SPX summary for PY2 1954 - 2018

 Avg      0.45%  -0.82%  -0.27%  -0.09%  -0.13%  -0.84%

 Win%       78%     10%     38%     40%     60%     30%


SPX summary for all years 1953 - 2021

 Avg     -0.02%   0.00%  -0.18%   0.03%  -0.04%  -0.20%

 Win%       53%     51%     41%     44%     54%     51%
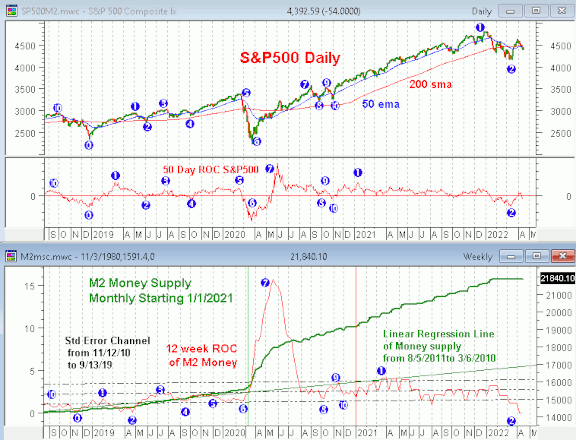
Money supply (M2) and Interest Rates
The following charts were supplied by Gordon Harms.
M2 growth continued to level off. Perhaps the Fed has quit calculating M2.
Treasury rates at their close last Friday and their changes from last month:
2yr yield 1.451% down from 1.944%
5yr yield 2.790% up from 2.144%
10yr yield 2.830% up from 2.153%
30yr yield 2.920% up from 2.427%
I did not receive the charts that usually come with the bond report.
Conclusion
The periods around holidays tend to be strong. Last week did not support that pattern.
The strongest sectors last week were Energy and Precious metals (for the 3rd. week in a row) while the weakest were Electronics and Banks (both for the 3rd. week in a row).
I expect the major averages to be lower on Friday April 22 than they were on Friday April 15.
Last week the Russell 2000 was up while everything else was down so I am calling last week's negative forecast a tie.


