
Technical Market Report For November 20, 2021
The good news is:
- Last Thursday the S&P 500 (SPX) closed at an all time high and last Friday the NASDAQ composite (OTC) closed at an all time high.
The Negatives
There were no confirmations of last week’s all time highs by any of the breadth indicators.
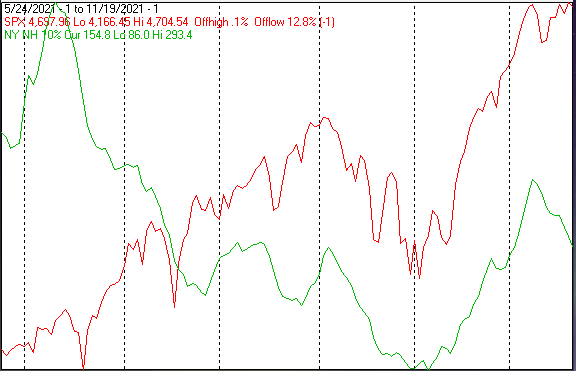
The first chart covers the past 6 months showing the SPX in red and a 10% trend (19 day EMA) of NYSE new highs (NY NH) in green. Dashed vertical lines have been drawn on the 1st trading day of each month.
NY NH was falling from a relatively low level as the SPX hit its all time high.
The next chart is similar to the first one except it shows the OTC in blue and OTC NH, in green, has been calculated with NASDAQ data.
OTC NH declined while the index was rising last week.

The chart above showing the last 6 months does not look to bad; however, looking at the past year gives you a less positive perspective.

The next chart covers the past 6 months showing the OTC in blue and a 10% trend (19 day EMA) of NASDAQ new lows (OTC NL), in brown. OTC NL has been plotted on an inverted Y axis so decreasing numbers of new lows move the indicator upward (up is good).
OTC NL was falling sharply (new lows increasing) as the index rose to a new high.

The next chart is similar to the one above except is shows the SPX in red and NY NL has been calculated with NYSE data.
Ditto NY NL.

Advance decline lines are a running total of the number of declining issues subtracted from the number of advancing issues. I do not show them very often because since around the turn of the century about half of the issues on the NYSE have been fixed income which go up daily until the day they go ex dividend monthly or quarterly. This has given the NYSE ADL an extremely positive bias whereas in earlier decades the NYSE ADL had a modestly negative bias.
The chart below covers the past 6 months showing the SPX in red and the NYSE ADL in blue.
This chart is remarkable because it shows the normally positively biased NYSE ADL falling sharply as the SPX is hitting new all time highs.

The next chart is similar to the one above except it shows the OTC in blue and OTC ADL has been calculated with NASDAQ data.
The OTC ADL does not contain many fixed income issues so it has not had a problem with a positive bias. The OTC ADL is useful for identifying very strong markets. If the OTC ADL is strong you have a very strong market.
The OTC ADL fell sharply last week as the index hit new all time highs.

The next chart covers the past 6 months showing the OTC in blue and a 40% trend (4 day EMA) of NASDAQ new highs divided by new highs + new lows (OTC HL Ratio), in red. Dashed horizontal lines have been drawn at 10% levels for the indicator; the line is solid at the 50%, neutral level.
OTC HL Ratio fell into negative territory as the index hit its all time high.

The Positives
Aside from index record highs, positives are hard to find.
The next chart is similar to the previous one except it shows the SPX in red and NY HL ratio, in blue, has been calculated with NYSE data.
NY HL Ratio fell sharply last week, but managed to finish the week in modestly positive territory.

Seasonality
Next week includes the 3 trading days prior to Thanksgiving and the Friday after Thanksgiving during the 1st year of the Presidential Cycle. The tables below show the daily change, on a percentage basis, for that period.
OTC data covers the period from 1963 to 2020 while SPX data runs from 1953 to 2020. There are summaries for both the 1st year of the Presidential Cycle and all years combined. Prior to 1953 the market traded 6 days a week so that data has been ignored.
Average returns for the coming week have been positive by all measures,
Report for 3 days before Thanksgiving and 1 day after.

Day1 = the day after

The number following the year represents its position in the Presidential Cycle.

The number following the daily return represents the day of the week;

1 = Monday, 2 = Tuesday etc.


OTC Presidential Year 1 (PY1)

               Day4       Day3       Day2       Day1       Totals

 1965-1      -0.09% 1    0.04% 2   -0.02% 3    0.47% 5     0.40%

 1969-1      -0.55% 1   -1.24% 2    0.05% 3   -0.11% 5    -1.86%

 1973-1      -2.35% 1    0.00% 2   -2.44% 3    0.77% 5    -4.03%

 1977-1       0.13% 1    0.57% 2    0.79% 3    0.57% 5     2.05%


 1981-1      -0.30% 1    0.52% 2    0.49% 3    0.50% 5     1.22%

 1985-1      -0.33% 1    0.24% 2    0.81% 3    0.30% 5     1.01%

 1989-1      -0.22% 1   -0.34% 2    0.22% 3    0.33% 5    -0.02%

 1993-1      -1.79% 1    1.18% 2    0.85% 3    0.22% 5     0.47%

 1997-1      -2.09% 1    0.13% 2    0.35% 3    0.38% 5    -1.23%


 Avg         -0.94%      0.34%      0.54%      0.35%       0.29%


 2001-1       1.89% 1   -2.79% 2   -0.29% 3    1.50% 5     0.31%

 2005-1       0.66% 1    0.53% 2    0.28% 3    0.13% 5     1.60%

 2009-1       1.40% 1   -0.31% 2    0.32% 3   -1.73% 5    -0.33%

 2013-1       0.07% 1    0.58% 2    0.67% 3    0.37% 5     1.70%

 2017-1       0.12% 1    1.05% 2    0.07% 3    0.32% 5     1.56%


 Avg          0.83%     -0.19%      0.21%      0.12%       0.97%


OTC summary for PY1 1965 - 2017

Averages     -0.25%      0.01%      0.15%      0.29%       0.20%

%Winners        43%        64%        79%        86%         64%

MDD  11/21/1973  4.73% --  11/21/2001  3.07% --  11/24/1997  2.09%


OTC summary for all years 1965 - 2020

Averages     -0.03%     -0.16%      0.36%      0.43%       0.59%

% Winners      52%        56%        77%        79%         67%


SPX PY1

               Day4       Day3       Day2       Day1       Totals

 1953-1      -0.33% 1    0.57% 2    0.08% 3    0.57% 5     0.90%

 1957-1       0.76% 1   -2.65% 2    2.89% 3    1.14% 5     2.14%


 1961-1       0.14% 1    0.08% 2   -0.11% 3    0.20% 5     0.31%

 1965-1      -0.65% 1    0.15% 2    0.17% 3    0.10% 5    -0.23%

 1969-1      -1.15% 1   -0.32% 2    0.36% 3    0.58% 5    -0.53%

 1973-1      -3.05% 1   -2.04% 2    1.11% 3   -0.32% 5    -4.29%

 1977-1      -0.08% 1    0.88% 2    0.42% 3    0.21% 5     1.42%


 Avg         -0.96%     -0.25%      0.39%      0.15%      -0.66%


 1981-1      -0.09% 1    1.57% 2    0.44% 3    0.84% 5     2.76%

 1985-1      -0.58% 1    0.16% 2    0.93% 3   -0.18% 5     0.33%

 1989-1      -0.66% 1    0.07% 2    0.68% 3    0.60% 5     0.69%

 1993-1      -0.75% 1    0.41% 2    0.29% 3    0.15% 5     0.10%

 1997-1      -1.70% 1    0.44% 2    0.09% 3    0.40% 5    -0.78%


 Avg         -0.76%      0.53%      0.49%      0.36%       0.62%


 2001-1       1.09% 1   -0.73% 2   -0.49% 3    1.17% 5     1.04%

 2005-1       0.53% 1    0.51% 2    0.35% 3    0.21% 5     1.59%

 2009-1       1.36% 1   -0.05% 2    0.45% 3   -1.72% 5     0.04%

 2013-1      -0.13% 1    0.01% 2    0.25% 3   -0.08% 5     0.06%

 2017-1       0.13% 1    0.65% 2   -0.08% 3    0.21% 5     0.91%


 Avg          0.60%      0.08%      0.10%     -0.04%       0.73%


SPX summary for PY1 1953 - 2017

Averages     -0.30%     -0.02%      0.46%      0.24%       0.38%

%Winners        35%        71%        82%        76%         76%

MDD  11/20/1973  5.03% --  11/26/1957  2.65% --  11/27/2009  1.72%


SPX summary for all years 1953 - 2020

Averages     -0.08%      0.07%      0.34%      0.33%       0.65%

% Winners      46%        59%        78%        72%         70%
Conclusion
Last week's new all time highs could easily be the high point for this cycle.
The strongest sectors last week were Electronics and Utilities while the weakest were Energy (same as last week) and Banks.
I expect the major averages to be lower on Friday November 26 than they were on Friday November 19.
Last week the SPX and OTC were up while the Dow Jones Industrial Average and Russell 2000 were down so I am calling last weeks positive forecast a tie.


