
Tech Bull Trend Could Change, If A Double Top Is Forming
(Click on image to enlarge)
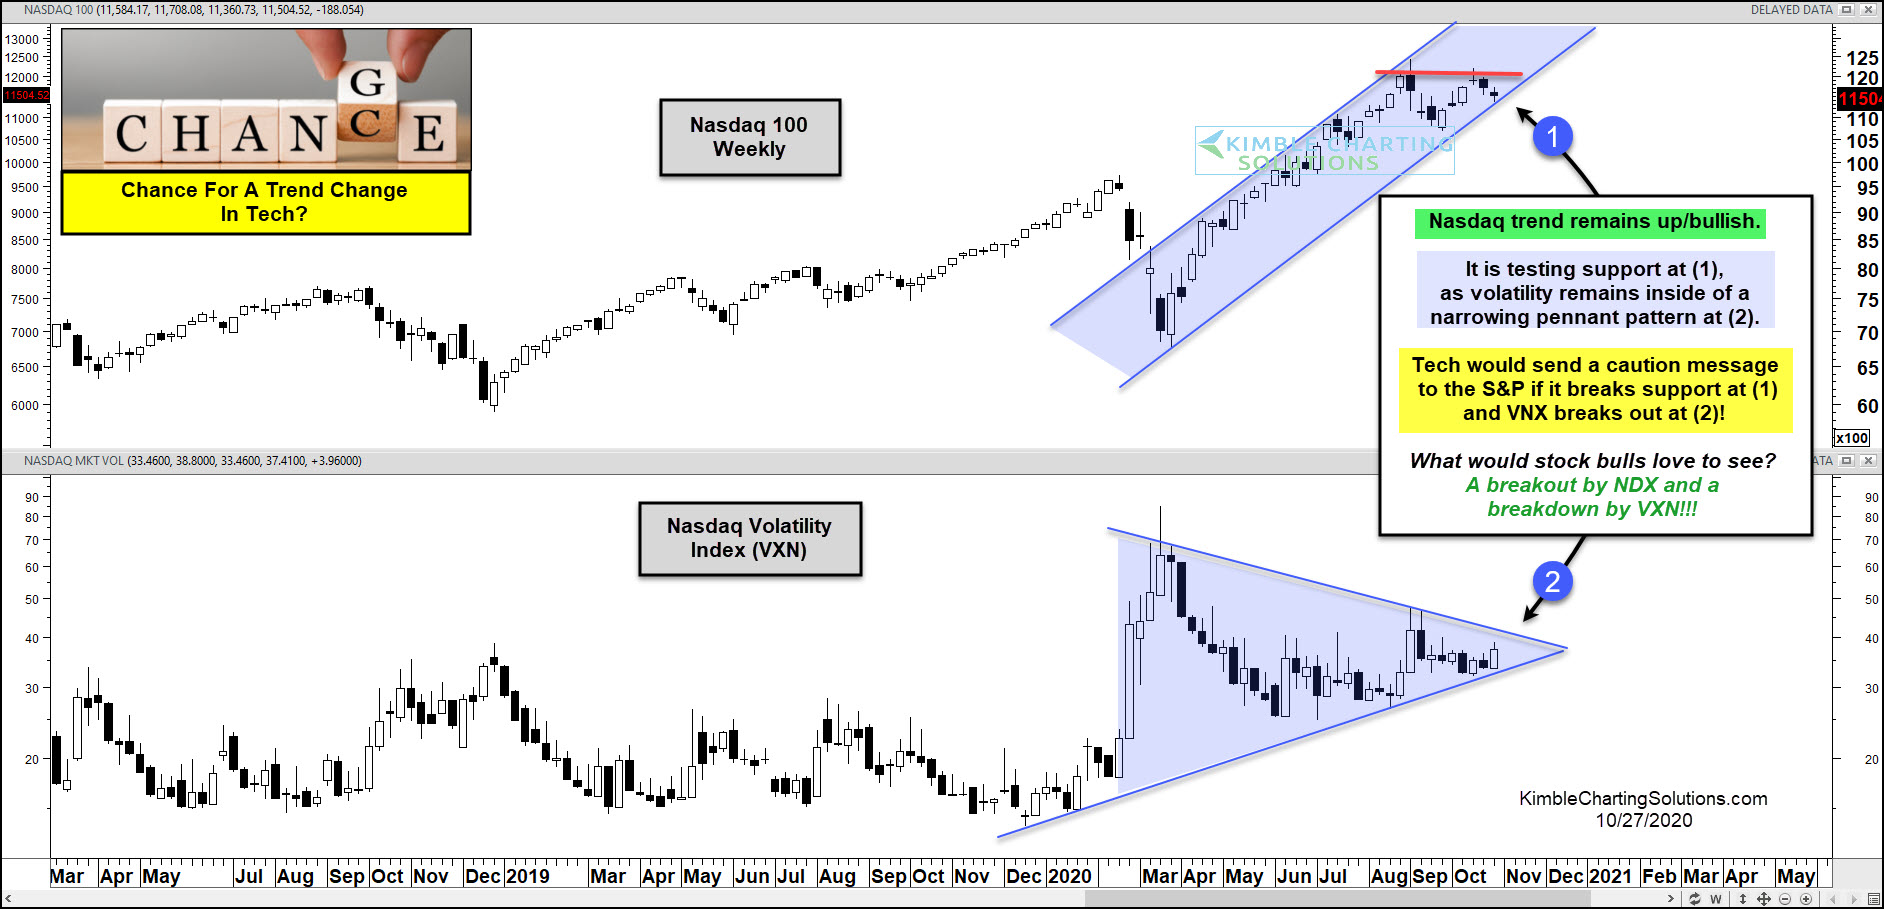
Is the bull trend in tech about to end? What Tech and its volatility index does in the next few weeks will go a long way to answer this question.
This chart looks at the NDX 100 and its Volatility Index (VXN) on a weekly basis over the past couple of years.
The trend for the NDX remains up/bullish. No price action of late has changed this trend! It tested its September highs two weeks ago, and so far those highs look to have held, forming a potential double top.
VXN movement has been shallow the past few months, as it remains inside of a narrowing pennant pattern.
What would stock bulls love to see? A breakout above the September highs and a break of support by VXN.
What would send a concerning message to stock bulls? A break of support at (1) and a breakout of the pennant pattern at (2).
Disclosure: Sign up for Chris's Kimble Charting Solutions' email alerts--click here.


