
T2108 Update – A Toppy Feeling In The Market Even As Individual Stocks Shine
(T2108 measures the percentage of stocks trading above their respective 40-day moving averages [DMAs]. It helps to identify extremes in market sentiment that are likely to reverse. To learn more about it, see my T2108 Resource Page. You can follow real-time T2108 commentary on twitter using the #T2108 hashtag. T2108-related trades and other trades are occasionally posted on twitter using the #120trade hashtag. T2107 measures the percentage of stocks trading above their respective 200DMAs)
T2108 Status: 61.7%
T2107 Status: 34.6%
VIX Status: 14.3
General (Short-term) Trading Call: slightly bearish
Active T2108 periods: Day #26 over 20%, Day #25 over 30%, Day #25 over 40%, Day #23 over 50%, Day #8 over 60% (overperiod), Day #340 under 70% (underperiod)
Reference Charts (click for view of last 6 months from Stockcharts.com):
S&P 500 or SPY
SDS (ProShares UltraShort S&P500)
U.S. Dollar Index (volatility index)
EEM (iShares MSCI Emerging Markets)
VIX (volatility index)
VXX (iPath S&P 500 VIX Short-Term Futures ETN)
EWG (iShares MSCI Germany Index Fund)
CAT (Caterpillar).
IBB (iShares Nasdaq Biotechnology).
Commentary
T2108’s struggle to advance continues. On Friday, November 6, my favorite technical indicator extended its latest pullback from the overbought threshold.
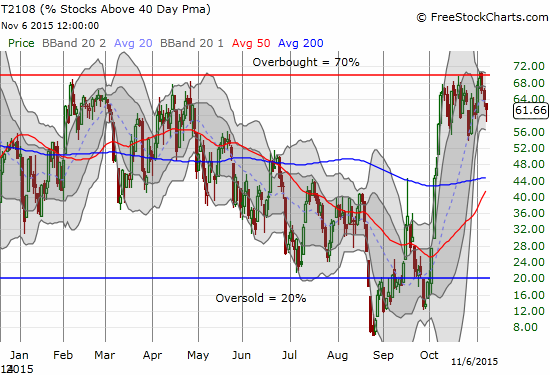
How much longer can T2108 continue to churn just under overbought levels?
I am now ready to conclude that T2108 will NOT broach overbought levels anytime soon. The churn for the past month means that despite the impressive advance of the S&P 500 (SPY), buyers are having trouble pushing additional stocks over the hump. The advancing tide has failed to lift more boats for at least a month.
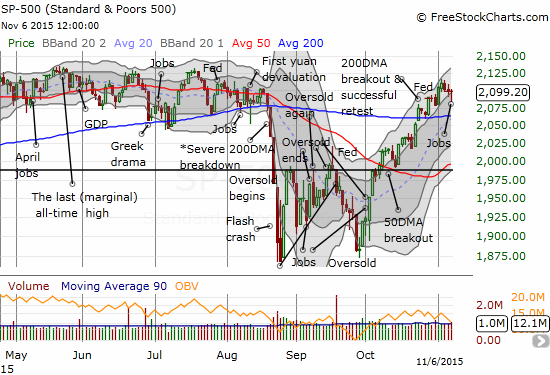
The S&P 500 has marched nearly straight up for a month in stairstep fashion. Even the current mild pullback is well within the uptrending channel defined by the upper Bollinger Bands.
The sharpening divergence between T2108 and the S&P 500 is very surprising to me. With the market finally gearing up for an imminent rate hike, I am now inclined to interpret this divergence as bearish. I flipped the trading call from neutral to bearish. My major caveat is that I still do not think it is worth getting aggressive on any shorts until the S&P 500 closes below 200DMA support. At this market juncture, it will take such a breakdown to confirm my bearish trading call.
Earnings season winds down leaving some impressive charts in its wake. I hope to spend this week covering the majority of the ones of most interest to me. They are an interesting mix of breakouts, breakdowns, and confirmed moves.
First of all, honors go to Amazon.com (AMZN) and Alphabet (GOOG). These big cap tech stocks are clear market leaders that are pushing the narrow charge higher. I was not aggressive enough trading these stocks after stellar post-earnings up-gaps. AMZN in particular quickly went to work invalidating the same kind of bearish “gap and crap” that stalled the stock out after July earnings. Alphabet (GOOG) has also refused to submit to its bearish gap and crap.
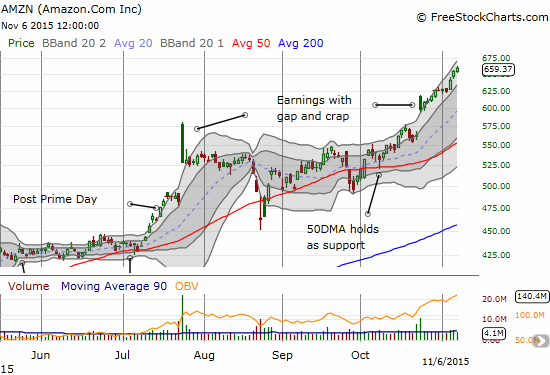
Amazon.com (AMZN) quickly resumed post-earnings momentum after a bearish gap and crap reminiscent of previous earnings.
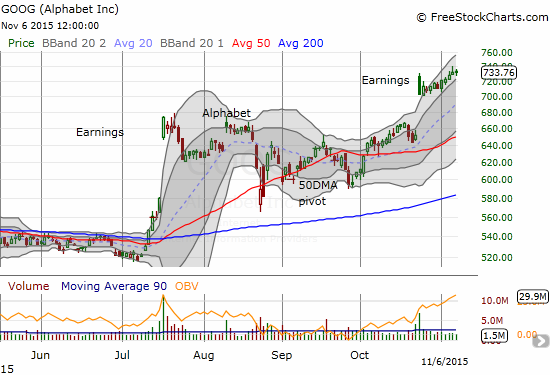
Alphabet (GOOG) is melting up in a continuation of post-earnings momentum.
Even Netflix has reversed its post-earnings losses and is on the edge of a major breakout.
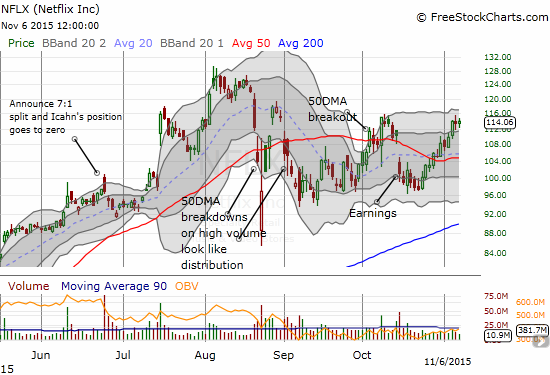
Netflix (NFLX) is doing its best to return to bullish shape and rejoin the rest of the market leaders.
Outside of tech, Goldman Sachs (GS) has printed a major 200DMA breakout. I got caught napping in my small short position. With GS presumably about to benefit from higher rates, it might be time to get bullish on GS despite what I see as more bearish tidings in the general market.
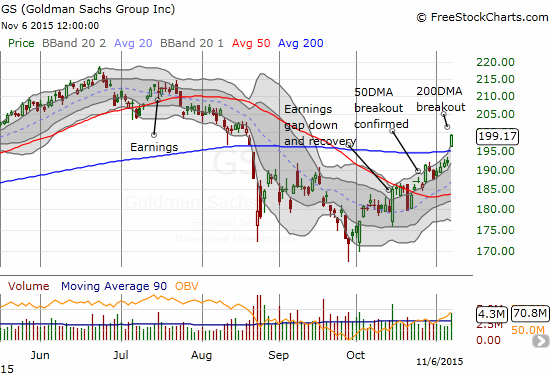
Goldman Sachs (GS) continues n impressive post-earnings reversal with a very bullish 200DMA breakout
I sold my position in Disney (DIS). I am not bearish; I even want to get back in to buy dips. I just did not like the way the stock stopped cold at resistance from the sell-off earlier in sympathy with poor earnings resuls from Time Warner (TWX).
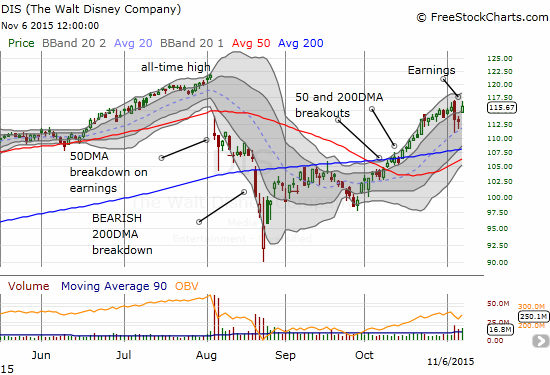
Disney (DIS) may struggle to make further progress after a pre-earnings plunge interrupted impressive momentum.
Finally, for a breakdown, I have Teradata Corporation (TDC). Amazingly, the stock busted a sharp 180 the very next day and almost closed its entire post-earnings gap down. I m guessing the on-going bleeding in this stock may finally abate for a while.
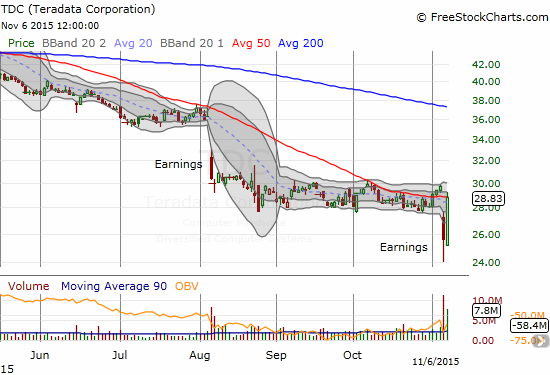
Blink and you missed it: Teradata stages its own quick post-earnings reversal.
Daily T2108 vs the S&P 500

Black line: T2108 (measured on the right); Green line: S&P 500 (for comparative purposes)
Red line: T2108 Overbought (70%); Blue line: T2108 Oversold (20%)
Weekly T2108

Disclosure: Net long the U.S. dollar.


