
T2108 Update – A Challenging Setup For The Santa Claus Rally
(T2108 measures the percentage of stocks trading above their respective 40-day moving averages [DMAs]. It helps to identify extremes in market sentiment that are likely to reverse. To learn more about it, see my T2108 Resource Page. You can follow real-time T2108 commentary on twitter using the #T2108 hashtag. T2108-related trades and other trades are occasionally posted on twitter using the #120trade hashtag. T2107 measures the percentage of stocks trading above their respective 200DMAs)
T2108 Status: 20.0% (right on the edge of oversold!)
T2107 Status: 23.2%
VIX Status: 20.7 (“elevated”)
General (Short-term) Trading Call: bullish – see below for caveats
Active T2108 periods: Day #4 over 20%, Day #7 under 30%, Day #8 under 40%, Day #12 below 50%, Day #27 under 60%, Day #368 under 70%
Reference Charts (click for view of last 6 months from Stockcharts.com):
S&P 500 or SPY
SDS (ProShares UltraShort S&P500)
U.S. Dollar Index (volatility index)
EEM (iShares MSCI Emerging Markets)
VIX (volatility index)
VXX (iPath S&P 500 VIX Short-Term Futures ETN)
EWG (iShares MSCI Germany Index Fund)
CAT (Caterpillar).
IBB (iShares Nasdaq Biotechnology).
Commentary
The week closed with a continuation of the post-Fed fade. The traditional year-end Santa Rally is now in doubt with the S&P 500 finishing at a fresh 2-month closing low.
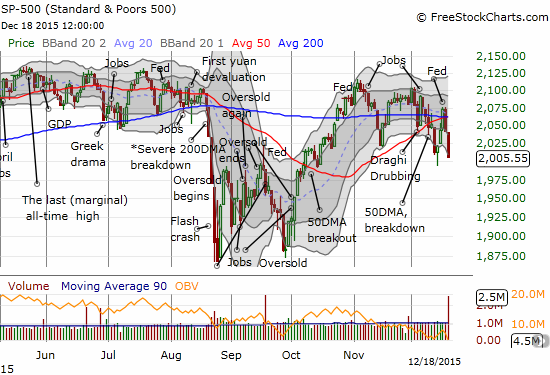
S&P 500 is limping into the end of the month and the year.
My assumption that the December intraday low would hold is also in doubt in the wake of all this selling. However, T2108, the percentage of stocks trading above their respective 40-day moving averages (DMAs), is teetering right on oversold trading conditions. T2108 closed at 20.05%; it has to close below 20% to hit oversold. This next visit to oversold trading conditions makes the potential of A Santa Rally even more interesting than usual. As a reminder, the numbers very clearly show a tendency for the second half of December to deliver gains – see “The Numbers And Setup Behind This Year’s Potential Santa Claus Rally.”
Moreover, oversold conditions in December are very rare. In previous posts I have emphasized how December is one of the mildest months of the year relative to average maximum drawdowns. The mildness translates into a scarcity of oversold conditions. Since 1986, there are only FOUR years where T2108 went oversold in December. One of those years was 1987 in the wake of the historic October crash of 1987. Two of those years, 1994 and 2007, featured 1-day oversold periods. The last of those years was 2008 in the middle of the financial crisis. In other words, oversold in December is a time to buy for at least a short-term bounce.
As T2108 descended toward oversold on Friday, I set lowball offers on call options for ProShares Ultra S&P500 (SSO) with December 31st expirations (go Santa!) and shares of ProShares Short VIX Short-Term Futures (SVXY). I did not want to miss some oversold trades in case the opportunity came in the form of a quick plunge and recovery. Only the call options triggered. I will be pouncing on SVXY at the next opportunity – presumably with T2108 dropping into oversold territory. Near Friday’s close, I went ahead and bought a single put option on ProShares Ultra VIX Short-Term Futures (UVXY) just in case the market gaps up first thing Monday morning. On Friday, the VIX closed at an “elevated” level of 20.7, but it faded from a high of 23.3. SVXY still managed to close at its low. So if the VIX read is correct, SVXY (and UVXY) seem oddly mispriced.
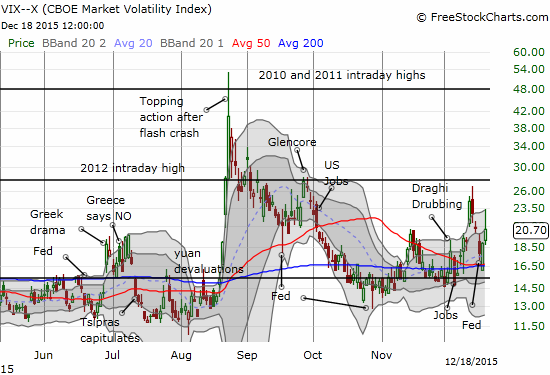
The volatility index broke through to an elevated level but faded from its high.
At an individual level for stocks, I have Goldman Sachs (GS), Apple (AAPL), and Disney (DIS) at the top of my list. Note all three stocks, and so many others, experienced a surge of selling on Friday. Combined with “quadruple witching” of the expiration of multiple derivative products and near oversold trading conditions, I will not be surprised to see a quick snapback before Christmas, perhaps as early as Monday’s open.
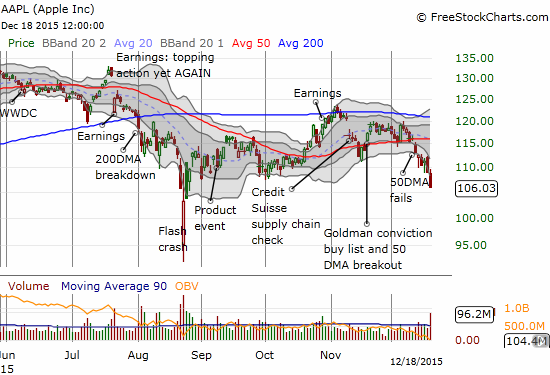
The bearish breakdown on Apple continues. The persistent selling has gotten over-extended well below the lower-Bollinger Band (BB). AAPL has a solid history of sharp bounces from such conditions.
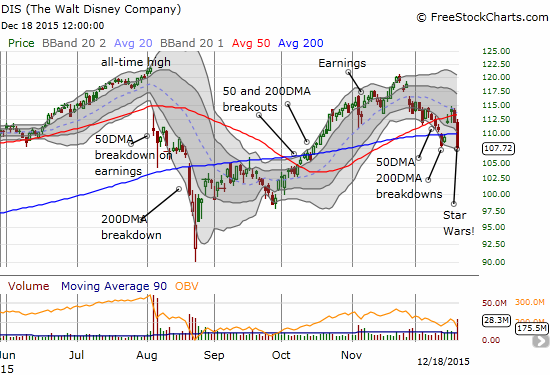
The contrarian sell-the-news crowd may have gotten ahead of themselves on Disney. The buying opportunity comes on an extension of selling given the 50 and 200DMA breakdowns are still very fresh.
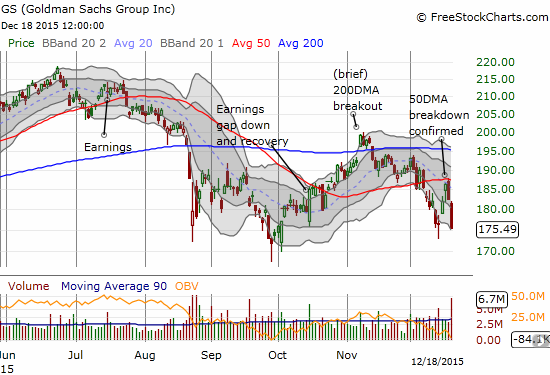
Goldman Sachs was a good hedge against bullishness, but I failed to go short again when GS recently failed at 50DMA resistance. I am now on alert for a sharp snapback from this heavy bout of selling.
I recently wrote a piece to describe a technically sound method for bottom-fishing on stocks. I forgot one spectacular example: FXCM, Inc (FXCM). On Monday, December 14th, buyers showed up in force to send FXCM up 52%. The next day, FXCM fell 16%, and I put myself on alert for a buying opportunity: FXCM closed just above its 20DMA which just then started to turn upward. On Wednesday, FXCM gapped up, and I immediately bought shares to add to an existing holding. After a 19% gain, I decided to count my chickens and go home. Of course, I wish I still had those shares in hand. FXCM lept again on Friday by 42%. Short interest is only 10.7% of float, so a short squeeze is not catapulting FXCM this high, this fast.
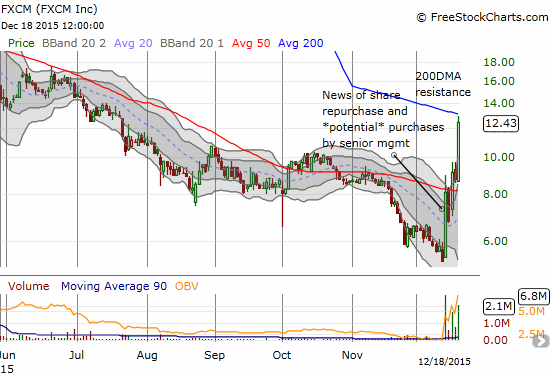
FXCM, Inc. suddenly comes to life in a BIG way.
Daily T2108 vs the S&P 500

Black line: T2108 (measured on the right); Green line: S&P 500 (for comparative purposes)
Red line: T2108 Overbought (70%); Blue line: T2108 Oversold (20%)
Weekly T2108

*All charts created using freestockcharts.com unless otherwise stated
The charts above are the my LATEST updates independent of the date of this given T2108 post. For my latest T2108 post click here.
Related links:
The T2108 Resource Page
Expanded daily chart of T2108 versus the S&P 500
Expanded weekly chart of T2108
Be careful out there!
Full disclosure: long FXCM, long AAPL call options, long UVXY put option, long SSO call options


