
Strong July Gives Way To Volatile August As Trade War Escalates
July was yet another solid month for stocks, as the major market indexes eclipsed and held above psychological barriers, like the S&P 500 at 3,000, and the technical consolidation at these levels continued with hardly any give back at all. But of course, the last day of July brought a hint of volatility to come, and indeed August has followed through on that with a vengeance. As the old adage goes, “Stocks take the stairs up but ride the elevator down,” and we just saw a perfect example of it. The technical conditions were severely overbought, with price stretched way above its 20-day simple moving average, and now suddenly the broad all-cap indexes (S&P 500, Dow, Nasdaq) are challenging support at the 200-day moving average, while the small cap Russell 2000 index has plummeted well below its 200-day and is now testing its May low.
For the past 18 months (essentially starting with the February 2018 correction), investor caution has been driven by escalating trade wars and tariffs, rising global protectionism, a “race to the bottom” in currency wars, and our highly dysfunctional political climate. However, this cautious sentiment has been coupled with an apparent fear of missing out (aka FOMO) on a major market melt-up that together have kept global capital in US stocks but pushed up valuations in low-volatility and defensive market segments to historically high valuations relative to GARP (growth at a reasonable price), value, and cyclical market segments. Until the past few days, rather than selling their stocks, investor have preferred to simply rotate into defensive names when the news was distressing (which has been most of the time) and then going a little more risk-on when the news was more encouraging (which has been less of the time). I share some new insights on this phenomenon in today’s article.
The market’s gains this year have not been based on excesses (aka “irrational exuberance”) but instead stocks have climbed a proverbial Wall of Worry – largely on the backs of defensive sectors and mega-caps and fueled by persistently low interest rates, and mostly through multiple expansion rather than earnings growth. In addition, the recent BAML Global Fund Manager Survey indicated the largest jump in cash balances since the debt ceiling crisis in 2011 and the lowest allocation ratio of equities to bonds since May 2009, which tells me that deployment of this idle cash and some rotation out of bonds could really juice this market. It just needs that elusive catalyst to ignite a resurgence in business capital spending and manufacturing activity, raised guidance, and upward revisions to estimates from the analyst community, leading to a sustained risk-on rotation.
As a reminder, I am always happy to take time for conversations with financial advisors about market conditions, outlook, and Sabrient’s portfolios.
In this periodic update, I provide a detailed market commentary, offer my technical analysis of the S&P 500, review Sabrient’s latest fundamentals based SectorCast rankings of the ten US business sectors, and serve up some actionable ETF trading ideas. In summary, our sector rankings look neutral to me (i.e., neither bullish nor defensive), while the sector rotation model retains a bullish posture. Read on…
Market Commentary:
The S&P 500 posted its largest weekly loss of the year last week (down 3%). And with the worsening trade war with China devolving into a fledgling currency war, it should come as little surprise to see that the weakness continued into Monday (down another 3% in one day!), despite an impressively resilient US economy bolstered by strong consumer confidence. Moreover, entering August, trading volumes were at one-year lows in what had been a “low participation” rally, so more volatility was to be expected. The CBOE Volatility Index (VIX) closed Monday at 24.59 (note: it closed last Wednesday at 13.94), which is above the “panic threshold” of 20, and even after Tuesday’s strength, VIX remained slightly above 20.
An increasingly intractable and protracted trade war:
If you think Monday’s selloff was ugly, I hope you didn’t notice the afterhours futures action in which the S&P 500 futures were down another 120 points (!), setting up Tuesday for an even worse day. But instead, futures recovered as China moved to stabilize the yuan, and so Tuesday delivered a nice little bounce (some might say a dreaded “dead cat bounce,” but time will tell). It all demonstrates how awful a major escalation in trade and currency wars – beyond just tariffs – could become. Notably, the recent surge in bitcoin may have foreshadowed the abrupt fall in the yuan and Chinese capital flight.
I observed in my article last month that cyclical sectors were finally showing signs of life this year, and they continued to do so in July, getting a boost from a combination of an imminent Federal Reserve rate cut and a US trade delegation headed to Shanghai to resume talks – the first high-level meetings since mid-May when talks came to a screeching halt and all previous progress was thrown out. But although the Fed came through with a 25-bps rate cut, the trade talks collapsed after a half day, before they barely had a chance to get started. President Trump waited until after the FOMC decision before unleashing angry tweets, which included announcing 10% tariffs on $300 billion in additional China-made imports. These additional tariffs were originally planned for the end of June but were postponed ahead of his meeting with President Xi at the G20 summit – and in fact, Trump had indicated at that time they would be reinstated if he was unhappy with the progress of negotiations.
In response, not surprisingly, China decided it would prefer to save face and step away from further talks, even if it means risking further damage to its economy. But China’s situation is likely much more tenuous than we are led to believe, and its posturing means it must further increase monetary stimulus for a “house of cards” leveraged economy that was already showing cracks (including major bank failures). And although the yuan has been falling against the dollar, which has helped offset the impacts on US tariffs internally, the downside is that a weaker yuan reduces its consumers’ purchasing power, encourages capital outflows into stronger currencies, and raises borrowing costs, which can be disastrous for China’s highly leveraged economy.
Then on Monday, as the yuan came under intense selling pressure, China threw in the towel on supporting the yuan at the politically sensitive (“red line”) level of 7.0, so it closed the day at 7.05 – its weakest since 2008 – which sent stocks globally into a tailspin. Later in the afternoon, the US Treasury Department officially labeled China a “currency manipulator” (the first time since 1994), paving the way for further sanctions. Although China stands accused of “weaponizing” its currency, it was not so much an overt devaluation as it was acquiescing to the global forex market’s pressure on the exchange rate – given escalating tariffs, falling manufacturing and growth slowdown, coupled with its escalating problems with Hong Kong (and don’t forget the Taiwan Issue). Forex experts are now discussing the possibility of the US Treasury tapping into the Exchange Stabilization Fund (ESF) to intervene in any further decline in the yuan.
China may actually welcome such outside intervention. With its slowing economy, rising debt load, weakening currency, lost supply chains, domestic capital outflows, and need to attract global capital, not to mention its difficulty handling the escalating Hong Kong protests and its lack of control of Taiwan, its leaders really need to shore up its currency and resolve the trade war soon. Otherwise, as hedge fund manager and expert speculator Kyle Bass has opined on Twitter, “Mass Exodus of capital out of CNH and HKD. This collapse has just begun.” Separately, Bass has stated, “Tensions between the two countries are broadening out to include economic, military and ideological dimensions…. We see these tensions as structural and long-lasting…. I think it's important to note that this is about intellectual property theft. It's about industrial espionage. It's about resetting our relationship with a China who has been taking advantage of the U.S. for a long time…. We can't get lost in the bigger picture here, and it is the incompatibility of two economies butting heads with one another in their cultural differences….”
A persistent preference for defensives over cyclicals:
Before the market’s recent turn of events, stocks had been buoyed by those powerful market forces FOMO and TINA – i.e., ”fear of missing out” and “there is no alternative.” And right on script, last week brought the Fed’s widely expected 25-bps rate cut and the US trade delegation’s visit to Shanghai. However, although stocks have managed to scale a proverbial wall of worry from all the unsettling macro and political news and unresolved trade wars, it seems clear that investors have not overlooked those issues at all, as the market segments that would normally lead the charge to new highs (e.g., cyclical sectors and small caps) have been lagging. Moreover, through last Friday, nearly 20% of the S&P 500’s stellar YTD performance was attributable to its four largest holdings: Microsoft (MSFT), Apple (AAPL), Amazon (AMZN), and Facebook (FB), so narrow mega-cap Tech leadership has been a key aspect of the market strength, as well.
My regular readers know that I have been writing and speaking about this unsettling market divergence since last summer, as have other valuation-driven quants (like Cliff Asness of AQR Capital, among many others). The sudden and dramatic defensive rotation last summer out of cyclical sectors and smaller caps – driven by a stark escalation in the trade war with China and an “autopilot” Federal Reserve – was painful for fundamentals-driven portfolios that favored cyclical sectors and small-mid caps. Over the past 14 months, there were really only about 3 months in which cyclicals have been the leaders, as all eyes await a resolution to the trade war. This has led to the unlikely result that defensive sectors like Utilities and Staples have been the leaders (due primarily to their reliable dividends in a low interest-rate environment). And even as the S&P 500 just recently hit yet another new high, the Russell 2000 small cap index (IWM) was still about 10% below its 8/31/2018 high.
None of this describes the type of behavior you expect to see in a solid economy and rising stock market. Typically, the broad market indexes rise to new highs in a risk-on climate led by cyclicals and with strong market breadth that includes mid and small cap stocks. Well, to lend further support to these observations, JP Morgan recently discussed the historically large relative valuation gap between Value/Cyclicals and Low Volatility/Defensives that has characterized the market since at least June 2018. It essentially reinforces everything I have been talking about regarding market conditions over the past 15 months. The charts below says it all:
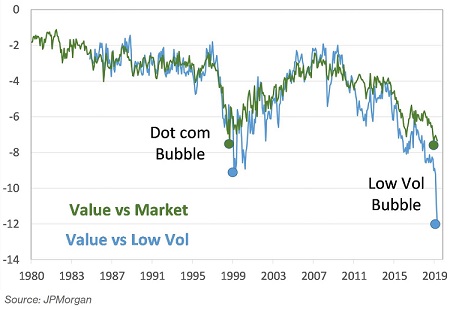
JP Morgan’s quant strategist Marko Kolanovic sees this as "…a once in a decade opportunity to position for convergence…[of the] record divergence between value/cyclical stocks on one side and low volatility/defensive stocks on the other side....The bubble of low volatility stocks vs. value stocks is now more significant than any relative valuation bubble the equity market experienced in modern history.” He sees the biggest beneficiaries of a re-convergence to be, “…small caps, oil and gas, materials, and more broadly stocks with low P/E and P/B ratios.” Those market segments happen to be some of the biggest components of most of Sabrient’s GARP portfolios over the past year – as you would expect to see in a valuation-driven GARP portfolio in a growing economy.
This reinforces our optimism that we may see significant outperformance once investor preferences re-rationalize. And ever since the Fed reverted to a dovish stance and optimism rose about trade negotiations, investors have shown periodic signs of readiness for a risk-on rotation. Of course, the recent turn of events with China may have halted that sentiment, but it may well be only temporary, given China’s increasingly tenuous situation.
As for relative valuations among ETFs representing various market segments, after Monday’s selloff, the SPDR S&P 500 (SPY) displays a forward P/E of 16.2x, the SPDR S&P 400 mid cap (MDY) is at 16.2x, the SPDR S&P 600 small cap (SLY) is at 15.6x, and the iShares Russell 2000 (IWM) is at 15.0x. The SPDR S&P 500 Value (SPYV) is at 13.5x, while the SPDR S&P 500 Growth (SPYG) is at 20.1x. The iShares Edge MSCI Min Volatility USA (USMV) is at a lofty 19.5x, the Consumer Staples Sector SPDR (XLP) is at 19.2x, and Utilities Select Sector SPDR (XLU) is at 18.1x, while Energy (XLE) is at 15.2x, Materials (XLB) is at 15.9x, Industrials (XLI) is at 15.4x, and Financial (XLF) is at only 11.7x. Notably, the Direxion All-Cap Insider Sentiment (KNOW), which tracks a Sabrient index of companies that have recently seen either analyst upgrades or insider buying (perhaps reflecting a value tilt) has a forward P/E of only 11.2x, while VanEck Vectors Pharmaceuticals (PPH) is at only 9.2x and VanEck Vectors Steel (SLX) sports a paltry forward P/E of 8.0x.
S&P Global recently observed that the S&P 500’s performance in Q2 appeared to be a “low conviction rally” led by Minimum Volatility and Low Volatility (i.e., risk-off) factors, and with Momentum and High Beta (i.e., risk-on) factors lagging. Low Volatility’s performance over the past year is particularly remarkable in light of its trailing beta to the market return. Over the past 12 months through 6/30, the firm observed that the S&P 500 Low Volatility Index has gained +19.0% versus +10.4% for the S&P 500 Index, which SPG says is “unusually strong performance for a defensive index in a rising market.” To be sure, much of this divergence is due to the relative strength of our consumer economy versus our moribund manufacturing economy, which we would hope and expect to see converge once a trade deal is reached.
Furthermore, First Trust recently reported that for the 12-month period ended 6/30/19, 4 of the 11 sector categories reported positive estimated net inflows – they were Communication Services, Utilities, Consumer Staples, and Healthcare, as investors favored defensive sectors over cyclicals. So far this year, the only difference is the move toward lower interest rates has led to some outflows from Healthcare and inflows into Real Estate (likely due to their higher yields). Not surprisingly, over the same 12-month timeframe, the top-performing S&P 500 sectors were Utilities, Real Estate, Consumer Staples, Information Technology, Communication Services, and Health Care.
As for stock markets outside the US, investors have shown a lot less enthusiasm, which has driven even more global capital into US equities and bonds. According to the Financial Times, commodity prices remain stagnant due to slowing global trade and disrupted supply chains, which has strained emerging market countries, while their governments remain unapologetically corrupt. On the other hand, gold has been on fire, especially over the past few months. According to the World Gold Council, $5.5 billion flowed into gold-backed ETFs during June, in anticipation of further easing from central banks, given that gold typically attracts attention when interest rates fall and the dollar weakens. Notably, gold miners are doing even better than the metal, as the VanEck Vectors Gold Miners ETF (GDX) boasts a 35% YTD return. Moreover, dovish talk from both the Federal Reserve and the ECB has pushed investors into the high-yield space in search of higher returns, and European and US junk-bond funds are attracting record inflows.
According to SSGA, “High yield ETFs had inflows once again, making June and July the highest back-to-back inflow months ever. High yield fund flows have turned around after a disastrous 2018, taking in nearly 30% of their assets [during this year alone, mostly coming in June and July].” Also, “Gold funds posted their best back-to-back months of inflows since Brexit, as the amount of negative yielding debt reached all-time highs.”
It seems that gold bugs were expecting that the start of a new rate-cutting cycle by the Fed would weaken the dollar, which would support a rising gold price. But the Fed’s rate cut last week has instead resulted in a stronger dollar, and yet gold continues to rise. Likewise, a narrowing interest rate differential between the US and other countries would be expected to weaken the dollar, and yet the dollar remains unfettered. Of course, other central banks are also easing, and given the dollar’s position as the world’s reserve currency, whenever there is some concern about the global economy, capital flows into the US dollar, as well as US Treasuries and equities.
The Fed acquiesces to market pressures:
As fed funds futures had given a 100% probability, the Fed came through and cut rates by 25 bps for the first time since Dec 2008 (albeit with two dissents, which is unusual), and announced an end to the normalization of the balance sheet two months ahead of schedule. Federal Reserve Chairman Jerome Powell praised the US economy but raised concerns over slower global growth and trade tensions, which have led to weaker demand and manufacturing activity. The most recent Global Manufacturing Purchasing Manager’s Index (PMI) showed contraction while business investment has fallen. In addition, he cited low inflation, a desire for stronger GDP growth, and a lower neutral rate implied by the bond market. But in his comments, Powell described what he was doing as simply a “mid-cycle adjustment,” i.e., apparently one-off rather than the beginning of a whole new rate-cutting cycle, which investors didn’t quite like.
I think Powell is simply acknowledging that he may have overshot what the market had been trying to tell him about the elusive “neutral rate.” It could end up being a “one and done,” or there could be another one or two cuts in store. But again, rates are low enough that we are not talking about either choking off an overheated economy or jumpstarting a recessionary economy, instead the Fed is simply trying to get out of the economy’s way at this point.
Also, it is notable that the dollar broke out to a 2-year high after the Fed announcement, which is the opposite of what normally happens when the Fed does something that is theoretically inflationary like cutting rates, but these days, given all the global concerns, global investors see caution at the Federal Reserve as a red flag for the rest of the world, driving global capital into the dollar. As First Trust pointed out, the dollar rose about 8% from 3/8/2018 when Trump first authorized tariffs on imported steel and aluminum, which is the reverse of how it performed initially following his election until 3/8/2018 when it declined by about 8%.
Looking ahead to the September FOMC meeting, CME Group fed funds futures are showing 100% probability of another 25-bps rate cut, which would bring the rate down to the 1.75-2.00% range. By the December meeting, there’s an 88% chance of another cut, plus a 44% chance of two more cuts.
The 10-year Treasury yield late on Tuesday sat at 1.72%, which is down 17% from its 2.08% level when the S&P 500 hit a new high on July 26 (ahead of last week’s FOMC meeting), and down 47% from its October 2018 high of 3.25%. In fact, it’s the lowest since October 2016. The 2-year T-note is at 1.60%, and the 3-month T-bill is at 2.05%. Suddenly, the 3-month/10-year spread is inverted once again at -33 bps, while the 2-10 spread is not, sitting at +12 bps. Despite this extreme pullback, the US 10-year yield still looks quite attractive compared with other developed market 10-year yields. In fact, that’s what’s been keeping it so low, as global investors seek higher “risk-free” yields. And other 10-year yields in Italy sit at 1.50%, Canada 1.24%, Australia 1.03%, UK 0.52%, Japan -0.18%, France at -0.26%, and Germany at -0.54%. Notably, Germany’s entire yield curve is now negative. Jim Bianco of Bianco Research observed, “Negative debt expanded by a record $650 billion on Friday (Aug 2). Total negative debt is a new record at $14.52 trillion. Negative debt is now 26.3% of all sovereign bonds, also a new record.”
As for the inverted 3-month/10-year yield curve, I think that at such low interest rate levels, and given that the more-often watched 2-year/10-year has not inverted, it really doesn’t mean much. Many market participants see the persistent inversion in the US 3-month/10-year as a clear recession signal, despite economic data that continues to hold up pretty well, and despite the fact that the 3-month is driven by the Fed while the 10-year is driven by the market. Instead, as I have often stated, I think this inversion is a false signal. Low or negative rates overseas are pushing capital into our bond market, distorting our bond market dynamics, so the inversion is not the signal of impending recession that history would normally suggest, in my view. My regular readers know that I have long predicted that US rates would continue to find a bid given the ultra-soft rates elsewhere and the global demand for safe yield, driven by the carry trade, aging demographics, and automatic strategic allocations to fixed income funds from a world awash in liquidity. Just look at this 1-year comparison of the SPDR S&P 500 ETF (SPY) versus the iShares 20+ Year Treasury Bond ETF (TLT):
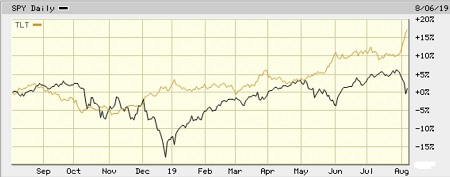
There has been strong demand for US bonds, as the TLT has greatly outperformed SPY over the past year (including a big divergence over the past few days, of course). For some time now, I have felt that the bond market was trying to tell the Fed that it was already at the elusive neutral rate, given the heavy global indebtedness. According to JP Morgan, global sovereign debt has jumped by 26 percentage points of GDP since 2007. They go on to say, “The bulk of the rise is found in developed markets (DM) where debt-to-GDP has surged roughly 41 percentage points — compared to a 12-percentage-point rise in emerging markets.” You often hear pundits lamenting the high debt-to-GDP ratio here in the US, but that’s not the whole story. If you also consider debt-to-assets and debt carrying cost-to-GDP at today’s ultra-low interest rates, these ratios remain in the normal range. This is yet another reason why I have long predicted that the Fed would have to reverse its previous tightening path. Unfortunately, central banks trying to prop up their economies through low or negative rates leads to increased leverage by design, and so ultra-low rates – in the absence of extreme inflationary pressure – becomes the new normal, as raising rates would overburden the indebted economy they created.
As for US GDP, following a Q1 growth estimate of +3.1%, the BEA’s advance estimate of Q2 growth (as of 7/26/19) is +2.1% (compared to the consensus estimate of 1.9%). First Trust concluded that the 65-bps decline in net exports was just statistical noise, while the 60-bps decline in real business fixed investment was almost entirely due to a drop in brick-and-mortar investment (aka "structures"), which is to be expected given the rapid transition to Internet-based delivery of goods and services. So, unsurprisingly, investment in structures has given way to investments in technology and equipment, and in fact, real business investment ex-structures rose at a +1.9% annual rate.
Moreover, core GDP, which includes personal consumption, business investment, and home building, grew at +3.2% annual rate. And as ZeroHedge pointed out, US household spending increased 2.85% and reflects a 4.3% annualized rate, which is the strongest since 2014. Interestingly, spending increased across every consumer goods & services category, led by recreational vehicles, and followed by motor vehicles, other nondurables, and healthcare. (So, it’s no wonder a company like Winnebago (WGO) is up about +60% YTD.)
On related notes, Consumer Confidence soared to 135.7 from prior month's 121.5 and expectations for 125.0, Michigan Consumer Sentiment put in a strong 98.4, while unemployment remains at only 3.7%, wages were up 3.2% YOY, and the JOLTS (job openings) report came in quite strong. And looking ahead to 3Q2019, the Atlanta Fed’s GDPNow model issued an updated estimate (as of August 2) of 1.9% GDP growth, while the NY Fed’s NowCast sees 1.6% for Q3 (as of August 2). For its part, the IMF has raised its US GDP forecast from 2.3% to 2.6%.
Earnings and price targets:
As for Q2 earnings, FactSet recently observed that 76% of S&P 500 companies reported actual EPS above estimates, which is above the 5-year average. In aggregate, those companies have reported earnings that are 6.0% above the estimates, which is also above the 5-year average. So far, the earnings decline for Q2 is -1.0%, which is smaller than anticipated, but if it holds up, it will be the first time the index has endured two consecutive quarters of YOY earnings declines since H1 2016. Positive earnings surprises were led by the Energy and Health Care sectors, and four sectors have reported YOY growth in earnings, led by Healthcare (+8.0%) and Financials (5.2%), along with Real Estate and Communication Services. On the downside, the worst have been Materials (-17.8%), Industrials (-10.3%), and Information Technology (-7.6%), primarily due to the trade war.
DataTrek recently pointed out that this year’s market was looking a lot like the period from 2014 to 2016 when S&P 500 earnings was stuck right around $119/share and yet the index still rose 28% thanks primarily to falling interest rates, as the 10-year yield fell from 3.04% to as low as 1.40%, which supported a higher valuation multiple. In addition, the firm points out that the TED spread and corporate bond spreads remain tight today, which lends further support to risk assets.
Before the recent market turmoil, street analysts had raised their aggregate 2019 price target on the S&P 500 to over 3,200 as well as revenue/earnings expectations for 2020 to +5.5%/+11.2%. For its part, Goldman Sachs just raised its year-end forecast for the index to 3,100. Although Goldman thinks that stocks are currently trading at fair valuations, with low interest rates continuing to support above-average valuations, including another 10% rise in 2020. Likewise, I saw Muhammad El-Arian of Allianz on CNBC last week recommending that investors should not fade the equity rally, nor the US versus other global markets, nor strength in the dollar, as he thinks all are sustainably strong.
In summary, US economic and employment data remains solid, consumer confidence is near record highs, the Fed has followed through on its dovish stance, Q2 corporate profits have been coming in better than expected, and it appears China is destined to absorb the brunt of the trade war fallout as it resists any pressure to renounce its longstanding but wholly unethical business practices. As for valuations, the S&P 500 forward P/E has suddenly fallen from around 17.3x last Wednesday to an attractive 16.2x after Monday’s close, and there remains an expectation for stronger economic growth in 2H2019 and 2020. Moreover, the dividend yield on the S&P 500 is 1.82%, which exceeds the 10-year Treasury yield, and share buyback programs may approach $1 trillion again this year. Finally, let me reiterate that a disinflationary and highly indebted global economy suggests that low interest rates are indeed here to stay for the foreseeable future, which supports a higher forward valuation multiple.
SPY Chart Review:
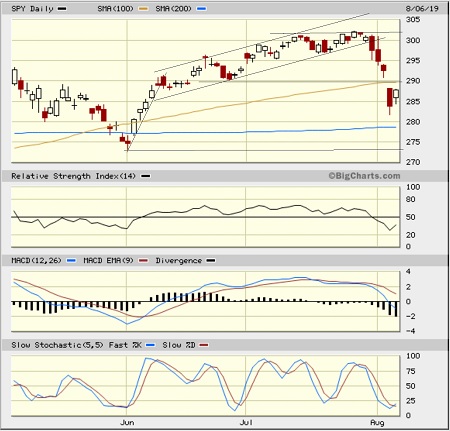
Up until this recent bout of volatility and the accompanying price correction, there seemed to be a solid underlying bid in the US stock market that was preventing any sort of healthy technical pullback from taking shape. In fact, the 20-day simple moving average offered reliable support on numerous tests throughout the month of July for the Dow Jones, S&P 500, and Nasdaq market averages. Even the Russell 2000 small cap index, despite a brief period mid-month in which it closed slightly below the 20-day, was quickly regained. But the past few days created a different technical picture. The SPDR S&P 500 ETF (SPY) had exceeded psychological resistance at 300, but the selloff saw it crash through the 20-day, 50-day, and 100-day, and almost challenged the 200-day SMA, while the iShares Russell 2000 small cap ETF (IWM) has fallen well below its 200-day SMA. These things can happen quick. As the saying goes, “stocks take the stairs up but ride the elevator down,” i.e., things move much quicker to the downside. In my article last month, I talked about overbought technical conditions (and indeed, I started accumulating puts for a short-term trade, despite my longer-term bullish view), but now the technicals are distinctly oversold. After Tuesday’s trading, the three oscillators I follow (RSI, MACD, and Slow Stochastics) are all bouncing from deep oversold territory and seem to have plenty of room to run to the upside, and there is a bearish gap from about 291 that will likely get filled (and 151.5 on the IWM). Tuesday’s daily candlestick doesn’t quite qualify as a bullish hammer pattern, but it does on the IWM chart, so we will have to see what happens next. But for the SPY to go a lot higher, I think it will need some more encouraging news on the trade and currency fronts.
Latest Sector Rankings:
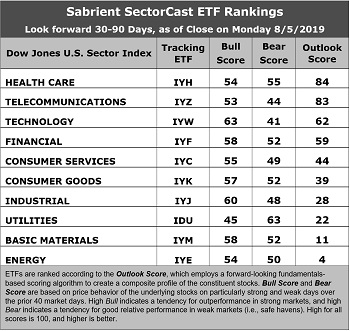
Relative sector rankings are based on our proprietary SectorCast model, which builds a composite profile of each of nearly 500 equity ETFs based on bottom-up aggregate scoring of the constituent stocks. The Outlook Score employs a forward-looking, fundamentals-based multifactor algorithm considering forward valuation, historical and projected earnings growth, the dynamics of Wall Street analysts’ consensus earnings estimates and recent revisions (up or down), quality and sustainability of reported earnings, and various return ratios. It helps us predict relative performance over the next 2-6 months.
In addition, SectorCast computes a Bull Score and Bear Score for each ETF based on recent price behavior of the constituent stocks on particularly strong and weak market days. A high Bull score indicates that stocks within the ETF recently have tended toward relative outperformance when the market is strong, while a high Bear score indicates that stocks within the ETF have tended to hold up relatively well (i.e., safe havens) when the market is weak.
Outlook score is forward-looking while Bull and Bear are backward-looking. As a group, these three scores can be helpful for positioning a portfolio for a given set of anticipated market conditions. Of course, each ETF holds a unique portfolio of stocks and position weights, so the sectors represented will score differently depending upon which set of ETFs is used. We use the iShares that represent the ten major U.S. business sectors: Financial (IYF), Technology (IYW), Industrial (IYJ), Healthcare (IYH), Consumer Goods (IYK), Consumer Services (IYC), Energy (IYE), Basic Materials (IYM), Telecommunications (IYZ), and Utilities (IDU). Whereas the Select Sector SPDRs only contain stocks from the S&P 500 large cap index, I prefer the iShares for their larger universe and broader diversity.
Here are some of my observations on this week’s scores:
1.Healthcare move into the top spot with an Outlook score of 84, driven primarily by a trove of analyst upward revisions to EPS estimates. It also displays strong insider sentiment (open market buying activity), and moderate long-term projected EPS growth and return ratios. Taking second is Telecom with a score of 83. (It is worth noting that nearly 50% of the IYZ ETF is made up of just two stocks: CSCO and VZ.) Telecom displays the lowest forward P/E of 13.7x and good return ratios. However, its pure GARP metrics are only average, with projected year-over-year EPS growth rate of 7.0% and a forward PEG ratio (forward P/E divided by projected EPS growth rate) of 1.95, which ranks it 6th out of 10 sectors on PEG, ahead of only fellow defensive sectors Utilities and Consumer Goods (Staples/Noncyclical) as well as Basic Materials, which is why we don’t see many Telecoms as candidates for Sabrient’s GARP portfolios (which have a 12-24 month outlook rather than 2-6 months used in SectorCast). Technology remains in third with an Outlook score of 62, as it displays good sell-side analyst sentiment, a strong projected EPS growth rate of 12.9%, solid return ratios, and a moderate forward PEG of 1.51. Rounding out the top seven are Financial, Consumer Services (Discretionary/Cyclical), Consumer Goods (Staples/Noncyclical), and Industrial.
2.At the bottom of the rankings we find three cyclical sectors: Energy, Basic Materials, and Utilities, primarily because these sectors have seen significant net reductions to their earnings estimates from the sell-side analyst community. Notably, Energy still displays the best projected year-over-year EPS growth rate of 13.3%, and the lowest forward PEG of 1.16, but it displays by far the most negative net revisions to EPS estimates.
3.Looking at the Bull scores, Technology enjoys the top score of 63, followed by Industrial at 60, as stocks within these sectors have displayed relative strength on strong market days. Defensive sector Utilities scores the lowest at 45. The top-bottom spread is a healthy 18 points, which reflects low sector correlations on strong market days. It is desirable in a healthy market to see low correlations reflected in a top-bottom spread of at least 20 points, which indicates that investors have clear preferences in the market segments and stocks they want to hold (rather than broad risk-on behavior).
4.Looking at the Bear scores, as usual we find defensive sector Utilities alone in the top spot with a score of 63, followed by Healthcare at 55, which means that stocks within these sectors have been the preferred safe havens lately on weak market days. Technology has the lowest score of 41, as investors have fled during recent market weakness. The top-bottom spread is 22 points, which reflects low sector correlations on weak market days. Ideally, certain sectors will hold up relatively well while others are selling off (rather than broad risk-off behavior), so it is desirable in a healthy market to see low correlations reflected in a top-bottom spread of at least 20 points.
5. Healthcare displays the best all-around combination of Outlook/Bull/Bear scores, followed by Telecom, while Energy is the worst. Looking at just the Bull/Bear combination, Basic Materials and Financial are tied for the best, followed by Healthcare and Consumer Goods (Staples/Noncyclical). All show a good balance between Bull and Bear scores, indicating superior relative performance (on average) in extreme market conditions (whether bullish or bearish). Telecom scores the worst.
6.I would say this week’s fundamentals-based Outlook rankings continue to reflect a neutral bias, given that the bottom of the rankings is populated by cyclical sectors Energy, Materials, and Industrials, but defensive sectors like Utilities and Consumer Goods don’t score high enough to make it look overly defensive. Also, Healthcare and Telecom sit at the top, which is less than bullish. We’ll continue to monitor how this trend develops. Keep in mind, the Outlook Rank does not include timing, momentum, or relative strength factors, but rather reflects the consensus fundamental expectations at a given point in time for individual stocks, aggregated by sector.
ETF Trading Ideas:
Our Sector Rotation model, which appropriately weights Outlook, Bull, and Bear scores in accordance with the overall market’s prevailing trend (bullish, neutral, or defensive), moved to a neutral bias during the recent selloff and suggests holding Healthcare (IYH), Telecom (IYZ), and Technology (IYW), in that order. (Note: In this model, we consider the bias to be neutral from a rules-based trend-following standpoint when SPY is between its 50-day and 200-day simple moving averages.)
Besides iShares’ IYH, IYZ, and IYW, other highly-ranked ETFs in our SectorCast model (which scores nearly 500 US-listed equity ETFs) from the Healthcare, Telecom, and Technology sectors include VanEck Vectors Biotech (BBH), Vanguard Communication Services (VOX), and First Trust NASDAQ Technology Dividend Fund (TDIV).
If you prefer a bullish bias, the Sector Rotation model suggests holding Technology, Financial, and Healthcare, in that order. On the other hand, if you are more comfortable with a defensive stance on the market, the model suggests holding Healthcare, Utilities, and Financial, in that order.
An assortment of other interesting ETFs that are scoring well in our latest rankings include VanEck Vectors Pharmaceuticals (PPH), Virtus LifeSci Biotech Products (BBP), SPDR S&P Capital Markets (KCE), VanEck Vectors BDC Income (BIZD), WBI BullBear Value 2000 (WBIB), US Global Jets (JETS), iShares Latin America 40 (ILF), First Trust Health Care AlphaDEX (FXH), Alps Alerian MLP (AMLP), iShares Global Healthcare (IXJ), Arrow QVM Equity Factor (QVM), SPDR MFS Systematic Core Equity (SYE), and iShares Edge MSCI Multifactor USA Small-Cap (SMLF).
I continue to see longer-term upside in this market, although I have been personally holding put options on the major indexes over the past month as a swing trade, given the negative short-term technical set up. However, I closed them out on Monday, and now hold only long options.
Disclaimer: This newsletter is published solely for informational purposes and is not to be construed as advice or a recommendation to specific individuals. Individuals should take into account ...
more

