
Strength In The Tick
(Click on image to enlarge)
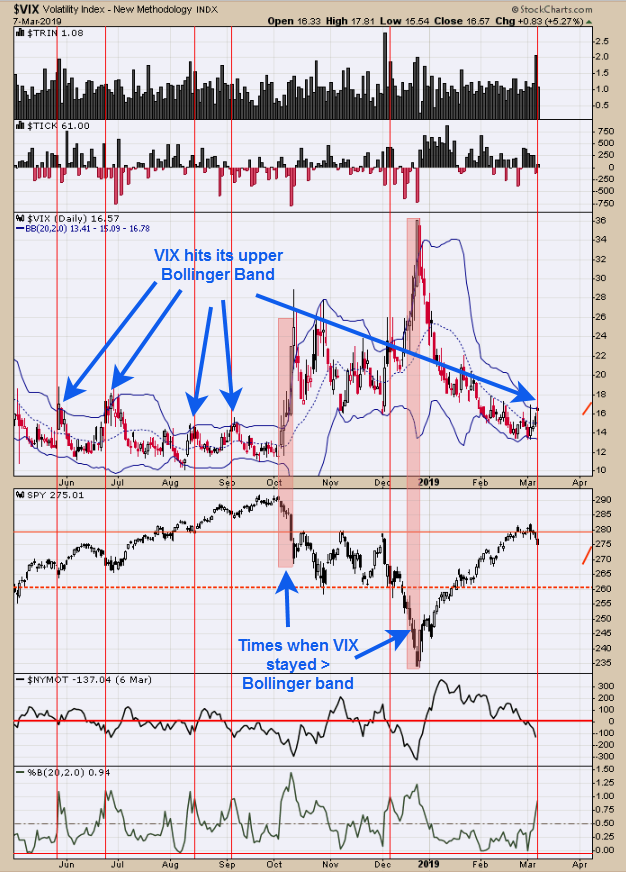
SPY ran into the November and December highs near 280 and a resistance area and market back off. How deep will this retracement go? probably not far. Today the VIX hit its upper Bollinger band and then closed below it. We have marked times that have happened with red vertical lines going back to last May. The times VIX stayed above its Upper Bollinger band (marked with tan bars) were the times the SPY head lower. Also, the SPY has been down four days in a roll (Down 4 days, closed higher within 5 days 95% of the time with an average gain of 1.2%). Had panic in the TRIN yesterday with a reading of 2.07 bring the “3 day average of the TRIN” to 1.45 and in bullish levels. A bullish setup could be triggered in the coming days.
(Click on image to enlarge)
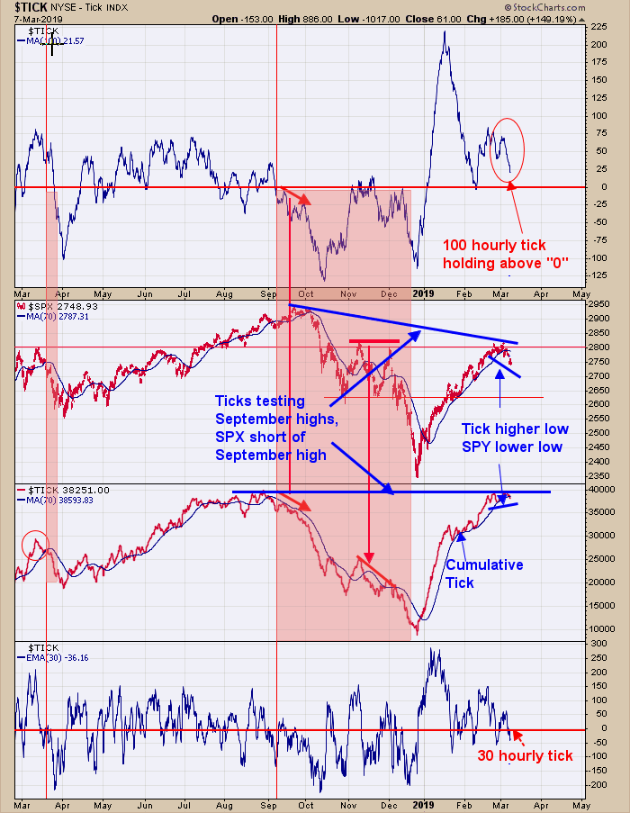
It's common for the ticks to lead SPX. Take the SPX September highs; notice that the 100 hourly and Cumulative tick turned down in early September, where SPX rallied into September 20. Notice now that cumulative tick is testing its September highs and SPX is below its September highs suggesting SPX will re-test its September highs and we think that is where the market is heading next. As far as the current consolidation is considered, 100 MA of the hourly Tick remains above “0” and bullish. The Cumulative tick has trended sideways and has not broken its previous low where SPY did break its previous minor low, showing strength in the tick. Next week is Option Expiration week which normally has a bullish bias and it appears it will be an up week. Most signals develop from Friday to Monday and Tuesday.
(Click on image to enlarge)
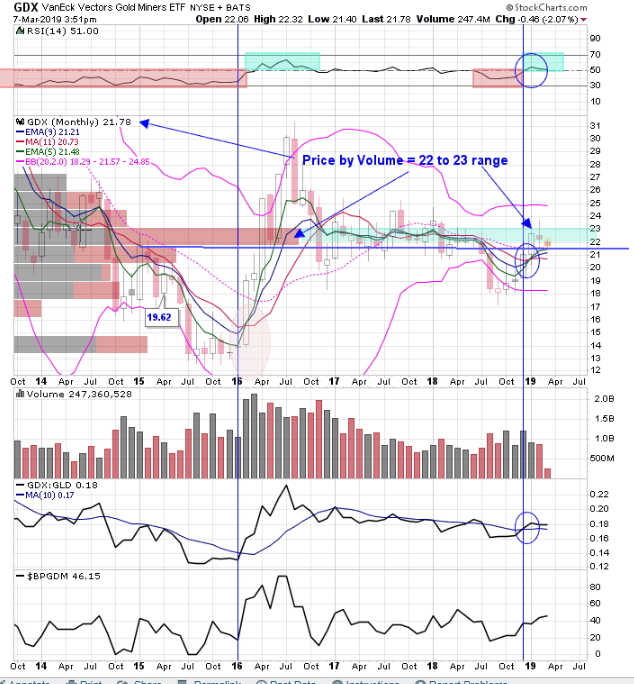
The monthly “Price by Volume indicator” (Left side of chart) shows the biggest bar at the 22.00 to 23.00 range and GDX is presently eating through this range. Once (or if) GDX closes above 23.00 on the monthly timeframe, then the 23.00 range should be strong support. The monthly RSI is holding above 50 and the monthly moving average of 5, 9, 13 remain in an uptrend and the Bullish Percent index increased from 44.44% to 46.15% showing the market is getting stronger. The monthly Chart remains on a buy signal and we are expecting the market to move higher in the coming weeks. Long GDX on 1/29/19 at 21.97.
Disclaimer: Signals are provided as general information only and are not investment recommendations. You are responsible for your own investment decisions. Past performance does not guarantee future ...
more

