
Strategies For Trading Inverse Volatility
In this article, I present five different strategies you can use to trade inverse volatility. Why trade inverse volatility you ask?
Because since 2011, trading inverse volatility was probably the most rewarding investment an investor could make in the markets. Annual returns of between 40% - 100% have been possible which crushes any other strategy I know.
In modern markets, the best way to protect capital would be to rotate out of falling assets, like we do in our rotation strategies. This is relatively easy, if you are invested only in a few ETFs, but it is much more difficult if you are invested in a lot of different shares. In such a situation an easy way to protect capital is to hedge it, going long VIX Futures, VIX call options or VIX ETF VXX.
If you trade inverse volatility, which means going short VIX, you play the role of an insurer who sells worried investors an insurance policy to protect them from falling stock markets. To hedge a portfolio by 100% an investor needs to buy VXX ETFs for about 20% of the portfolio value. The VXX ETF loses up to 10% of its value per month, because of the VIX Futures contango, so this means that scared investors are willing to pay 1.5-2% of the portfolio value per month or around 25% per year for this insurance. Investing in inverse volatility means nothing more than taking over the risk and collecting this insurance premium from worried investors and you can capitalize on this with a few simple strategies, which I will show you below.
Something seems afoot. Why do investors pay 25% per year to hedge 100% of an S&P 500 portfolio which traditionally has only achieved a return on average of around 8% in the last 10 years? I am sure many investors must have lost more money paying for this insurance than they would have lost from falling stock markets. But I guess they are paying for their own peace of mind.
Traditionally, it has always been better to hedge a portfolio with US Treasury bonds. These normally have, like VIX products, a negative correlation of about -0.5 to -0.75 with the US stock market, but unlike VIX volatility products, they can achieve long term positive returns.
However, since June 2013, US Treasuries have lost their negative correlation to the stock market, and at the moment there is no other choice to hedge a portfolio than to buy these very expensive VIX products or inverse index ETFs.
This is good news for people like me, who like to trade inverse volatility. However, there is something you need to know. You should never ever trade inverse volatility without being 100% clear on your exit strategy!
Here, I want to present some strategies which may be new to you and will allow you to participate in these high return volatility markets.
The Basic "Contango Rule" Strategy for VIX
For this strategy, all you have to do a daily check of the VIX term curve.
(Click on image to enlarge)
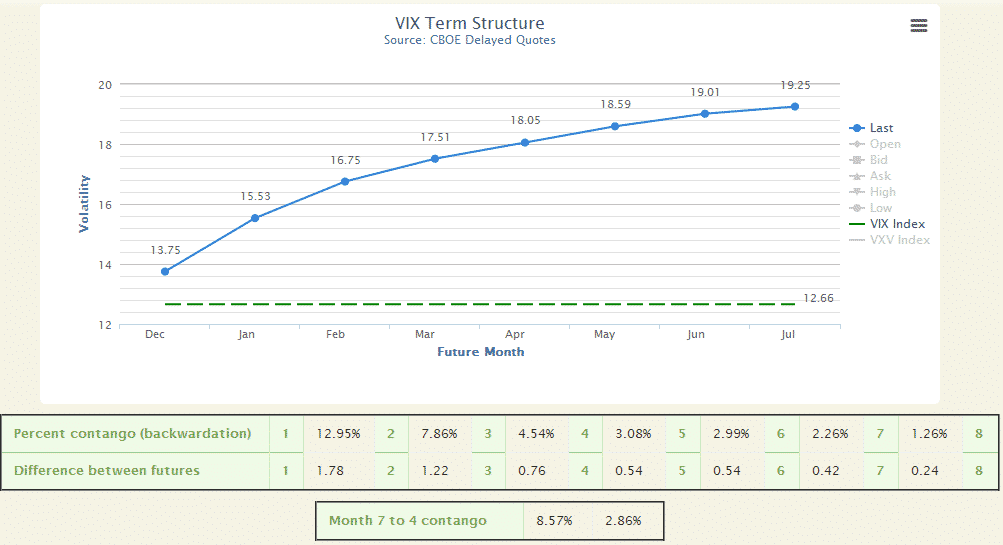
As long as the front month is in contango (curve goes up from left to right), such as in the chart above, you can go short VXX or long XIV. Sometimes you will see the front part of the curve go up until the front month goes to backwardation.
Here in this graph, you see the days of the last fiscal cliff fear spike.
(Click on image to enlarge)
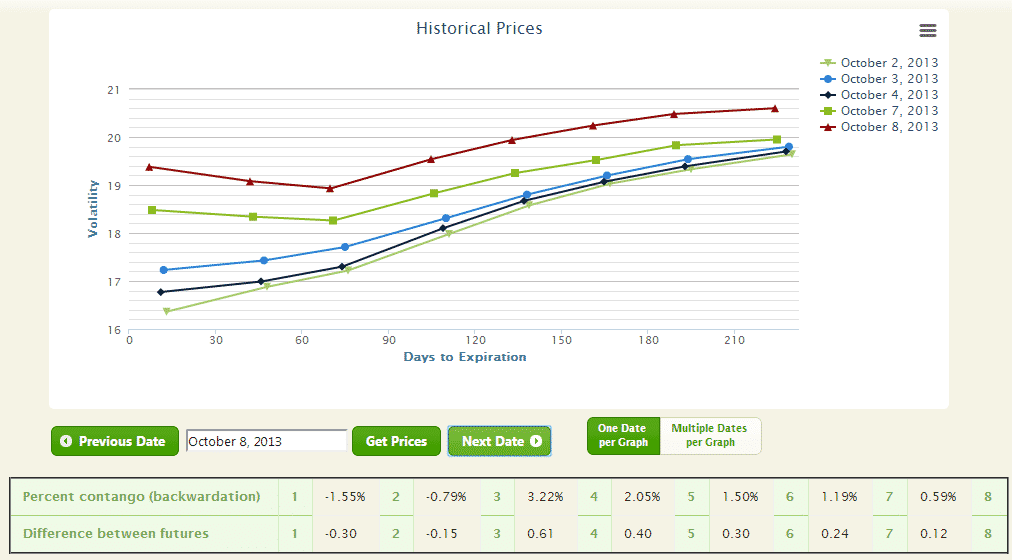
If the two front months of the VIX term curve are in backwardation and the curve drops downwards, such as in the chart above on October 7-8, this is a clear sign to exit VXX or XIV. From October 10, the curve returned to contango and you could have again shorted VXX or gone long XIV.
It is clear that most of the time when you have to exit it is because of a short VIX fear spike (such as above) which is over after a few days. You will have to realize a loss, but, this is inconsequential. Normally, you need only a few days to cover these losses again as the normal VIX contango situation is restored. In the example above, the front month future was below 20, which is not that worrying, but in 2008, this value spiked to 70. This means that going short VXX would have meant the possibility of realizing 300% losses if you didn't strictly follow any exit rules.
This "contango rule" strategy is not really a strategy, because it doesn't give you a clear exit signal, however, if you invest in inverse volatility, you MUST know the VIX Futures term structure.
The Bollinger Band or Simple Moving Average Strategy
These are strategies which work well and which have the advantage that you can backtest the strategies, or you can even automate these strategies. I used to trade the Bollinger band strategy for quite some time automatically with Tradestation.
Here is the backtest of this strategy since Feb. 1, 2009, which was when the VXX started. The performance has delivered a 96.41% annualized return or 2370% in total if you reinvested all profits. If you invest always the same amount which is what I did, then you get 5.8% per month which is a very nice monthly income.
The SPY ETF has delivered only a 20% annualized return or 137% total return during the same period. This is also very good but pales in comparison to the VXX strategy return.
(Click on image to enlarge)
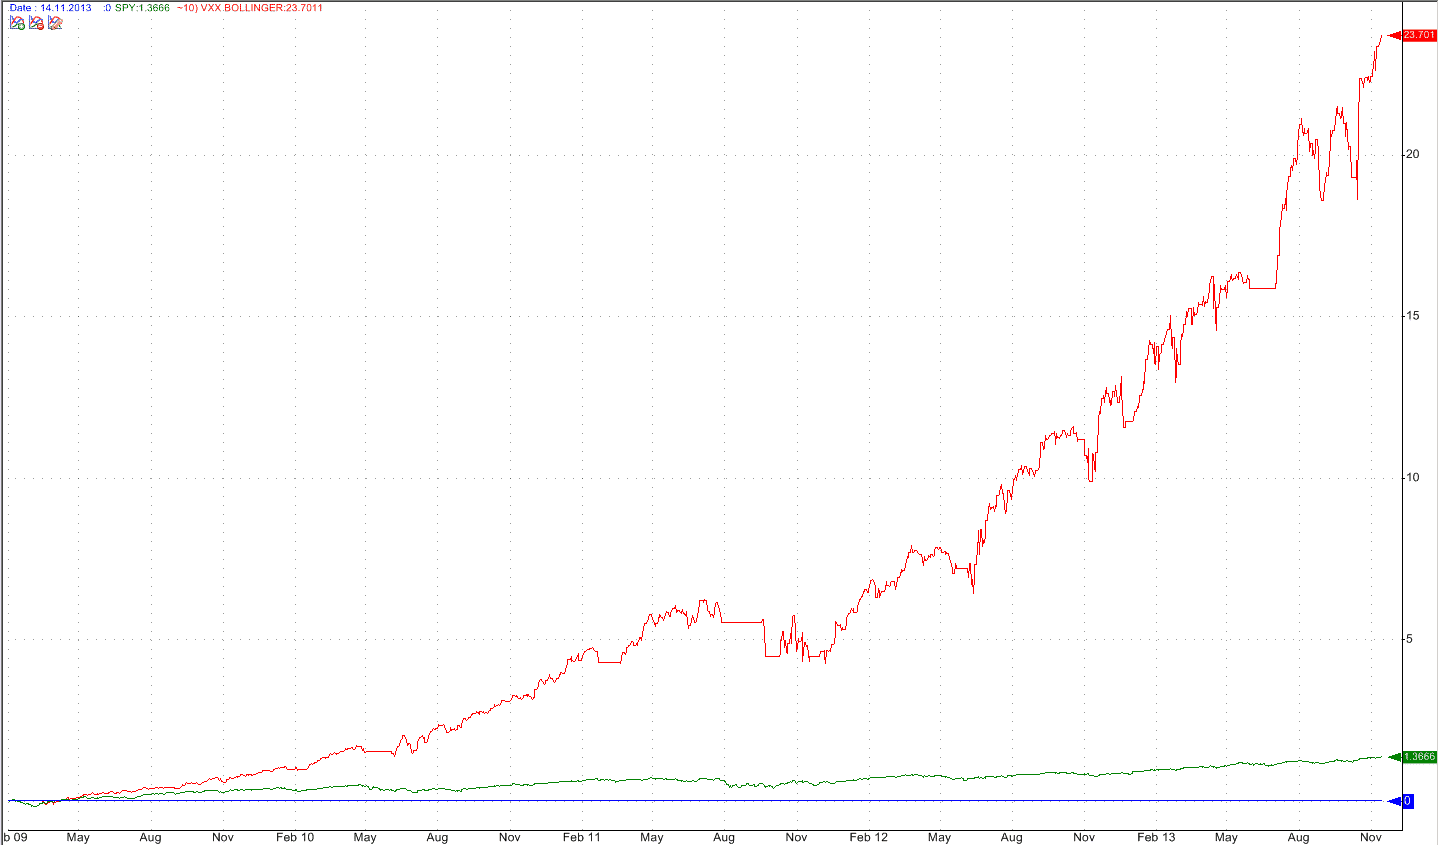
The maximum drawdown of this strategy was 27.7% compared to 20% for the SPY ETF. The risk to return ratio of such a strategy is 3.27 compared to 0.99 for the SPY ETF. So, even if trading VXX is considered risky, with the right strategy you could have had a 3x better risk to return ratio than for the US equity investment (SPY).
The parameters for this strategy have been optimized in QuantShare. The Bollinger band period is 20 days and the upper line is at 1.4. If VXX crosses the upper line I will exit (cover) VXX the next day at open. If VXX goes below the middle line, then I go short VXX the next day at open.
You can also use two SMA lines with 15 and 5 days and sell or cover at the crossings. The return is more or less the same as for the Bollinger strategy.
You can also do such strategies with XIV which is the inverse of VXX. However, the maximum annual return which I could achieve is 84% per year, which is 12% less than with VXX. This lower performance is mainly due to time decay losses which are quite strong for such volatile ETFs.
So, this is quite a simple strategy. You can even set a stop at the level of the upper Bollinger band line + 1%, so that the exit is automatic in case something very bad happens.
The Cautious Investor Medium Term Inverse Volatility Strategy
The two strategies above are for traders willing to check their investments on a daily basis. If you do not want to do this because you like to go on long holidays or you just don't like to look every day at your PC screen then it is better to invest in the medium term inverse volatility. You can do this by going long ZIV or going short VXZ. VXZ has higher volume than ZIV but the results are similar.
VXZ and ZIV have less than half the volatility (vola=25) than VXX or XIV (vola=55). Also, the contango structure is more stable than for the front month. Also, during the fiscal cliff crisis last month, the midterm futures never went into backwardation.
You can also use a Bollinger or SMA trading system for these ETFs. You will achieve about 44% annual return trading VXZ and you can do so with less than half of the volatility. This way you have about the same return to risk ratio as if you had traded the VXX.
However, because the volatility and behavior of ZIV or VXZ is very similar to the stock market, you can also include for example ZIV in a rotation strategy. In such a strategy it is a ranking mechanism which will tell you when to exit ZIV. This is normally better than using moving averages because the switching points are much smoother.
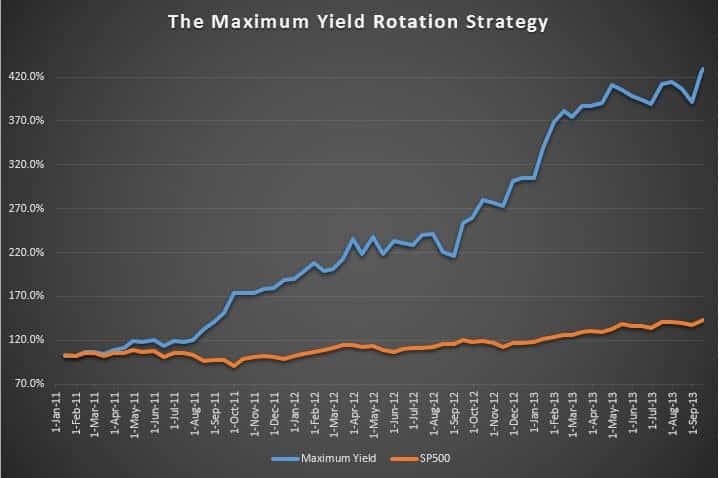
Investing in Medium Term Inverse Volatility with the "Maximum Yield Rotation Strategy"
A strategy I employ which gets most of its return from inverse volatility is the Maximum Yield Rotation Strategy which I presented in Seeking Alpha around two months ago. With such a strategy you can outperform a simple ZIV or VXZ SMA strategy by up to 20% per year. The advantage is that you only need to check the ranking of the ETFs every two weeks. No need to check daily the VIX term structure or the ZIV charts. Rotation strategies are very sensitive to changing market environments.
In case of upcoming market troubles, US Treasuries will quite early outperform ZIV and the strategy will rotate out of ZIV into treasuries. The main advantage of such a strategy is that it not only exits ZIV during market corrections, but the strategy will then rotate into Treasuries which can produce very nice additional returns during market corrections.
The High Probability VIX Future Trade Strategy
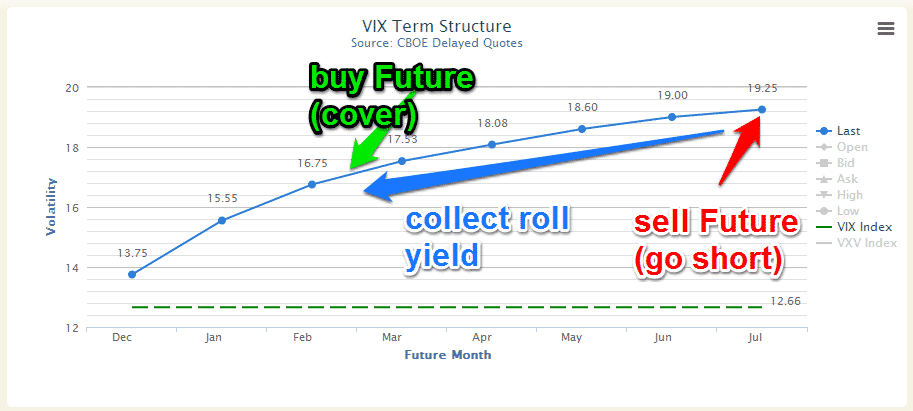
Instead of investing in VIX ETFs, I prefer to sell the VIX Futures directly. Normally, somewhere during the third week of the month, the front VIX future expires and is removed from the VIX term structure chart (see chart below). Now the second month will move to the front month position and on the curve end, a new Future will appear. I always go short a few of these Futures (red arrow) and then just let them slowly move down the curve until they arrive about at the green arrow position. At this point, I cover my short position and collect the roll yield for the about 4.5 months. On this chart, this would mean going short at about 19.25$ and covering (buy) at around 17$. That means a profit of 2.25$. Sometimes I have to wait a little bit longer to sell, for example, if there would be a VIX spike of some nature. But, for more than two years, I have never seen a loss.
So, this is a high probability trade. Once per month you go short the last or second last future and at the same time you enter a stop limit and a cover limit. For the July Future in the chart below, I for example, go short at 19.25. I activate a stop loss limit at 21.50 (=+2.25) and I activate a take profit limit at 17.00 (=-2.25). Now I just wait about 4 months until one of these limits is executed. As long as the contango of the VIX futures is there, this will be a trade with a profit probability of 90%-100%.
(Click on image to enlarge)
The volatility of these back end futures is quite low and there is no big risk, however, even here there would be moments where you have to exit. The main reason to stop such trades is when the back end of the future curve gets completely flat or even goes into backwardation.


thanks for sharing