
Stocks Rapidly Pricing In Growth/Profit Tailwind From Inventory Cycle, Among Others
After the sharp contraction in economic activity in the early months this year, inventories are running low. Growth gets a tailwind as they get rebuilt. There is tight correlation between economic growth and corporate profits. Stocks are anticipating this.
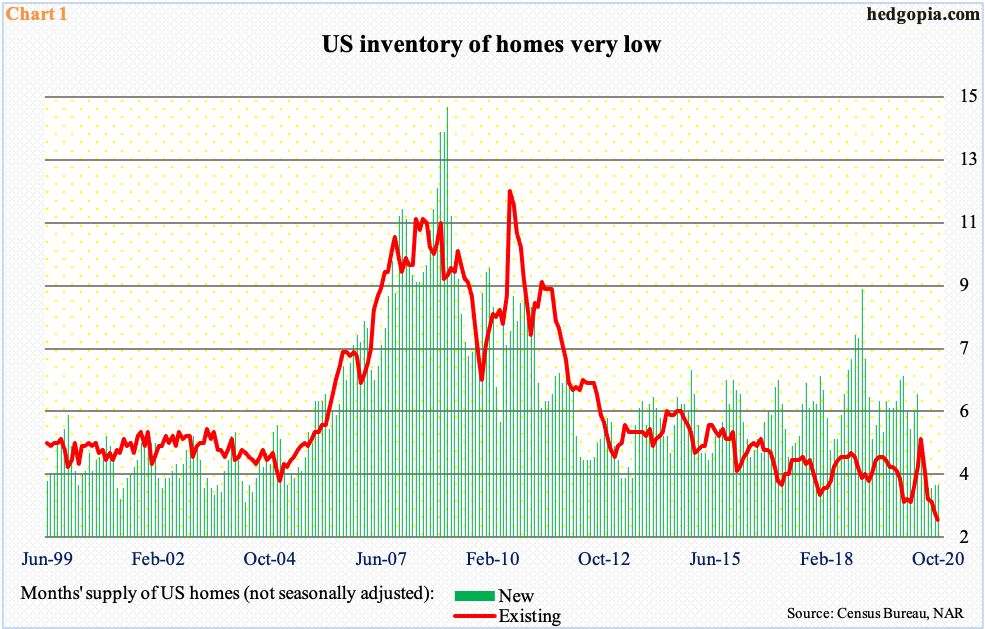
Home sales are on fire. In May, sales of existing homes were down to a seasonally adjusted annual rate of 3.91 million units; in October, they stood at 6.85 million. Similarly, new home sales dropped as low as 570,000 units in April; in both August and September, they were north of a million, with October at 999,000. These are multi-year highs.
Inventory is tight. In October, the supply of existing and new homes was 2.5 and 3.5 months, in that order (Chart 1). Of course, this is based on the current sales pace, meaning if sales weaken, more homes will be available, but the fact remains that the inventory of homes for sale is dwindling, which is helping push up the price.
The phenomenon is not just limited to housing.
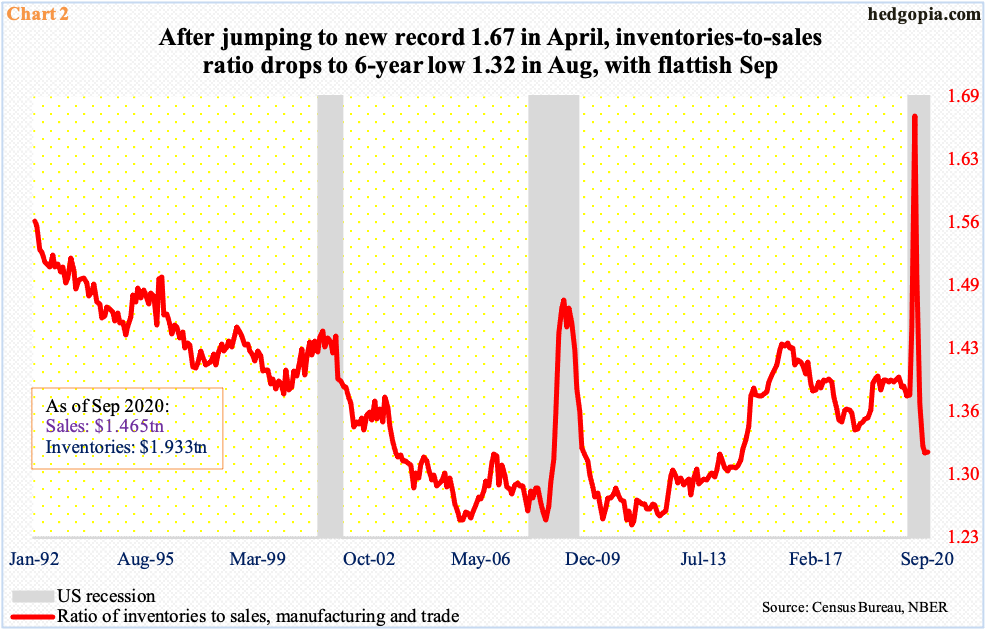
In manufacturing and trade, the inventories-to-sales ratio dropped to a six-year low 1.32 in August, with a flat September. Earlier, the ratio shot up to a record 1.67 in April (Chart 2).
A lot of the improvement in the ratio is due to sales that recovered quickly. In April, sales came in at $1.18 trillion (seasonally adjusted); by September, they had risen to $1.47 trillion. Inventories, on the other hand, went from $1.98 trillion to $1.93 trillion between the periods. In all of last year, inventories were just north of $2 trillion before coming under pressure early this year. They have been slightly rising since hitting $1.91 trillion in June.
The slight buildup in inventories in recent months after depletion earlier is also evident elsewhere.
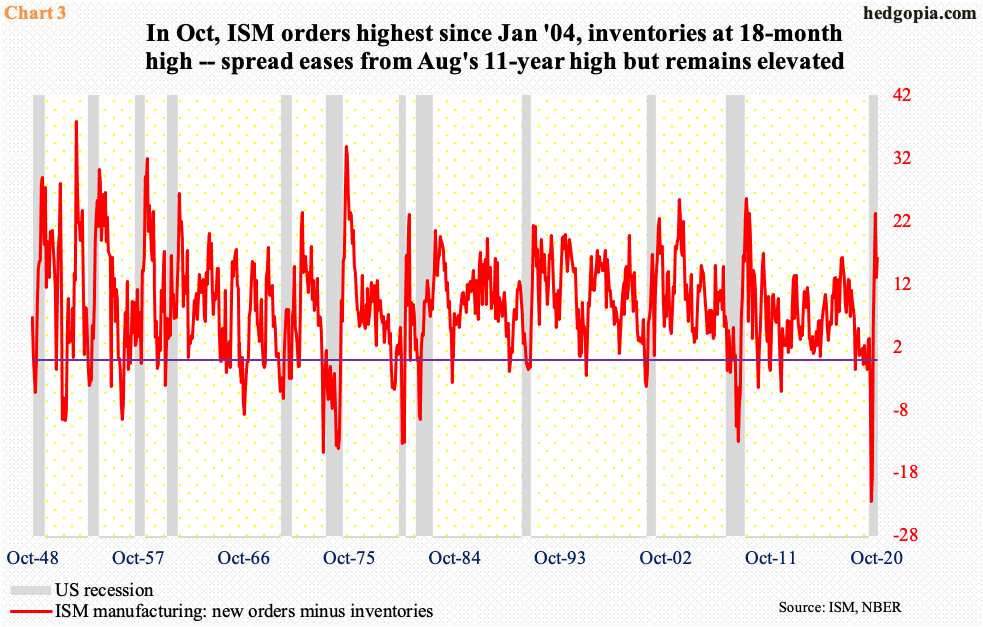
In manufacturing, the ISM inventories sub-index dropped to 44.4 in August, which was the lowest since January 2014. October’s was up 4.8 points month-over-month to 51.9 – an 18-month high. Orders similarly jumped 7.7 points m/m to 67.9 in that month, which has the highest since January 2004.
As things stand, orders are rising faster than inventories, which, should the pace sustain, will be struggling to keep up. The spread between orders and inventories rose as high as 23.2 in August. This had narrowed to 16 in October, but remains elevated. August’s reading was at a level which in the past marked the end of recession (Chart 3).
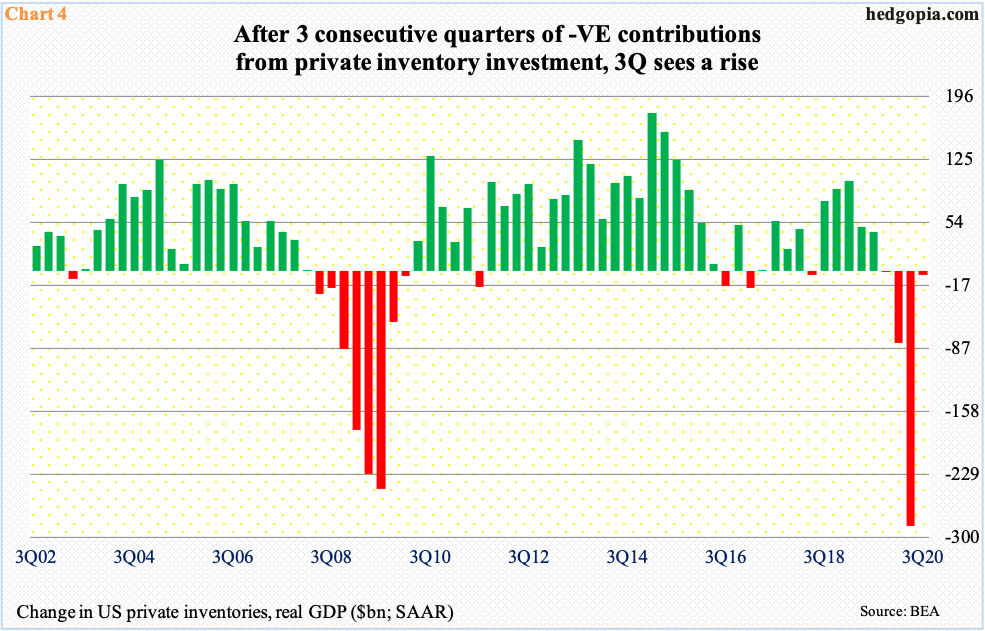
In 3Q, real GDP grew at an annual rate of 33.1 percent. This followed back-to-back contraction –31.4 percent in 2Q and down five percent before that. On a real basis, the economy was $19.3 trillion in 4Q last year. In the next two quarters it shrank by $2 trillion, before recovering to $18.6 trillion last quarter. Among others, inventory was a positive contribution in 3Q. In contrast, it took away from growth in the prior three quarters (Chart 4).
In the event the orders momentum keeps up and the demand picture continues to improve, inventory-build has the potential to become a tailwind. This will obviously help growth, and by default corporate profits.
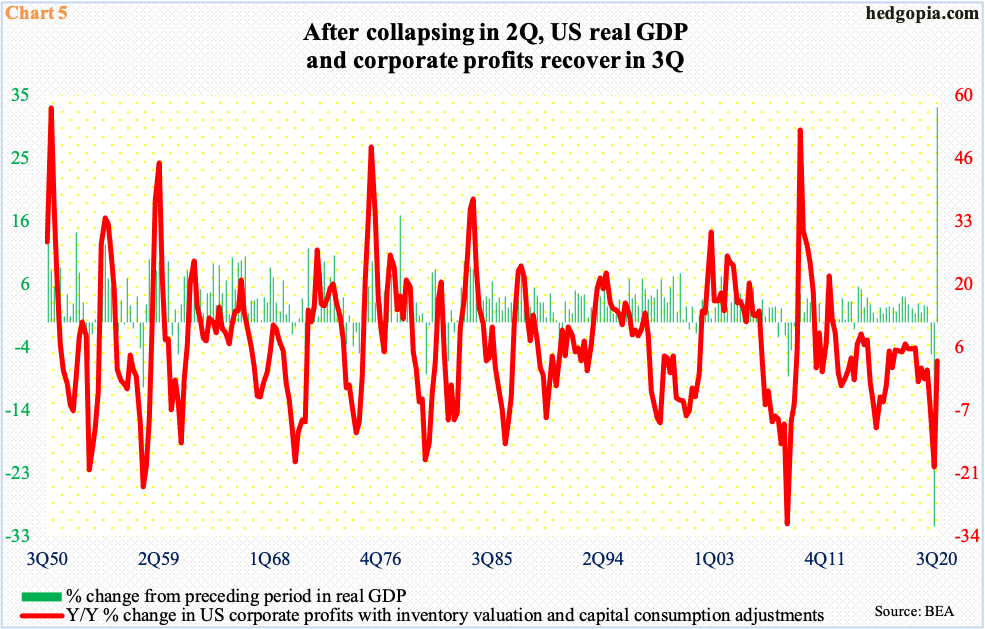
Not surprisingly, the economy and corporate profits move together directionally (Chart 5). In 3Q, profits adjusted for inventory valuation and capital consumption increased 3.3 percent year-over-year to $2.32 trillion (SAAR), which just about eclipsed the prior high of $2.31 trillion from 4Q19. Before that, profits dropped 19.3 percent in 2Q and 6.7 percent in 1Q.
Particularly post-news on COVID-19 vaccine development the last three weeks, investor optimism that the economy will begin to get back to normal next year has meaningfully firmed up. Small-caps are just ripping higher. Unlike their larger-cap brethren which are also internationally exposed, small-caps inherently have larger domestic exposure. With one session to go this month, the Russell 2000 Small Cap Index is up 20.6 percent, compared to 11.3 percent for the S&P 500 Large Cap Index and 10.9 percent for the Nasdaq 100 Index.
Stocks are rapidly pricing in the expected massive improvement in earnings next year.
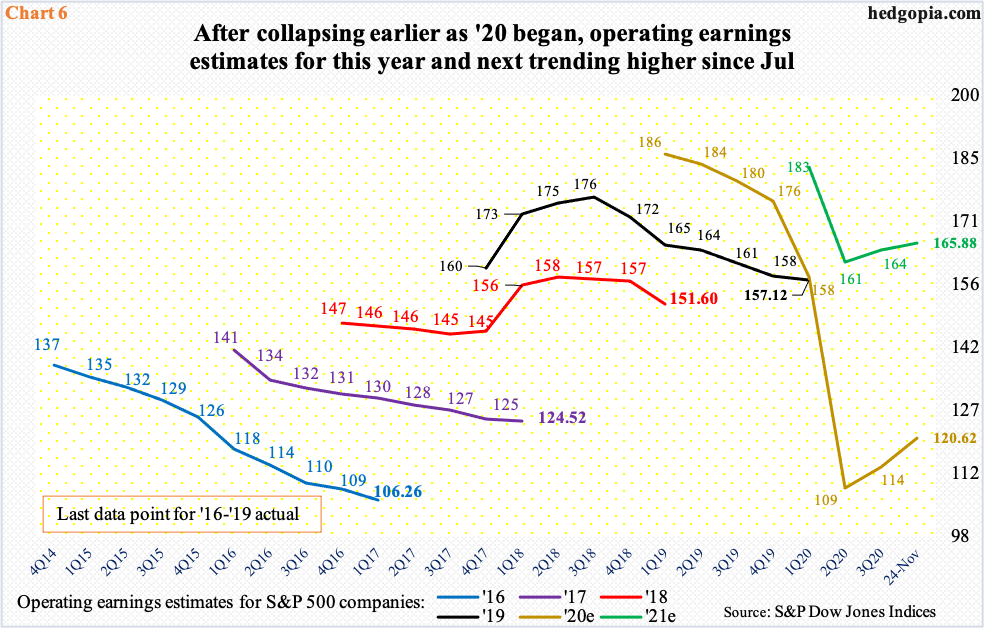
As of last Tuesday, S&P 600 companies (small-caps) are expected to earn $55.55 next year, versus a loss of $4.89 this year. For S&P 400 companies (mid-caps), the sell-side expects $114.85 next year and $71.18 this year, and for S&P 500 companies (large-caps) $165.88 and $120.62, in that order.
There are a couple of things that need consideration in this regard.
First, the revision trend has indeed turned higher – for both this year and next, which is a good thing. Chart 6 plots estimates for S&P 500 companies, but the improving trend is the same for mid- and small-caps as well. Secondly, based on past years’ revision trend, it is also true that the sell-side is notorious for being optimistic early on and then bring out the scissors as the year progresses. If this phenomenon repeats itself as 2021 kicks off, then stocks seriously run a risk of a rerating, not the least of which because they have already priced in massive improvement in the economy, and by default earnings.
Thanks for reading!


