
Stocks Once Again Under Pressure, But At/Near Crucial Support – Some Metrics Way Oversold
Stocks are selling off, but major indices are at/near crucial support, testing the will of the bulls.
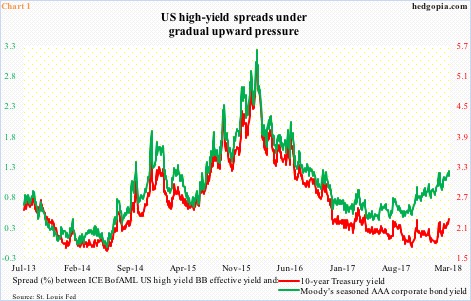
High-yield spreads are tightening. In Chart 1, the ICE BofAML US high yield BB effective yield is pitted against Moody’s seasoned AAA corporate bond yield and the 10-year Treasury rate.
Spreads over both corporate investment-grade and 10-year Treasurys have been gradually inching higher in a sawtooth pattern for a while now. The former in particular has been in a sharper uptrend. As of last Thursday, the yield difference between investment-grade and high-yield was 1.18 percent, up from .37 percent last May. Investors are beginning to seek protection in more reliable companies.
Be that as it may, the green line – as well as the red line – is nowhere near the highs of February 2016. There was a mini panic back then, which was also when US stocks reached a major bottom.
Fast forward to now, stocks once again are selling off. January was very strong, but this has been followed by weakness in February and March-to-date.
It is too soon to say if stocks are pricing in a scenario in which the current trajectory in Chart 1 continues. But cracks are beginning to show in technicals.
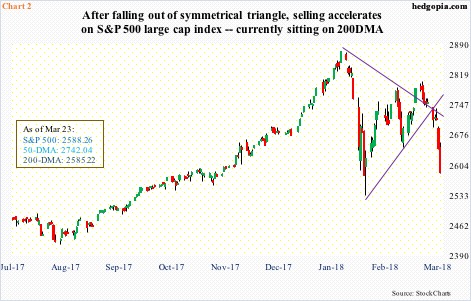
After peaking on January 26 at 2872.87 followed by a reversal low of 2532.69 on February 9, the S&P 500 large-cap index pretty much traded within a symmetrical triangle (Chart 1). Monday last week, it fell out of it. This was followed by rejection post-FOMC decision Wednesday at a confluence of moving averages, including the 50-day. Friday, the index essentially closed on the 200-day. On February 9, this average was tested successfully.
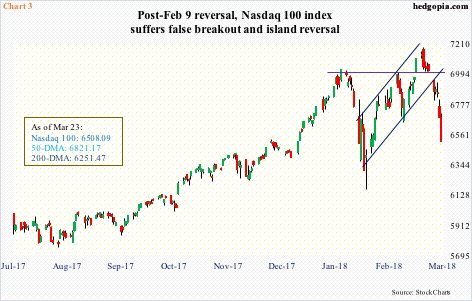
On the Nasdaq 100, no sooner did a breakout occur 11 sessions ago than it was lost (Chart 3). Following that breakout, the index did rise to a new intraday high of 7186.09 on March 13, but it came in a bearish engulfing session. Last week, it fell out of a seven-week rising channel.
In fact, that false breakout was also part of an island reversal, in which a gap-up was quickly followed by a gap-down, potentially trapping breakout traders with losses.
Both weekly and monthly momentum indicators have begun to turn lower. In a worst-case scenario for the bulls, in time they can go a lot lower.
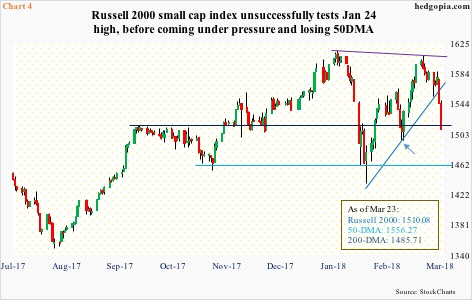
Ditto with the Russell 2000 small cap index.
On March 13, the index came within 6.47 points of the all-time high of 1615.52 that was hit on January 24. The subsequent downward pressure has cost the Russell 2000 a rising trend line from February 9 as well as the 50-day.
The 200-day is 1.6 percent away. It will be an important test. Before that lies support at just under 1500 where buyers showed up twice early this month (arrow in Chart 4).
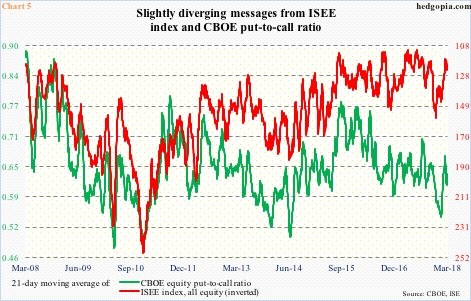
Even as these indices have come under pressure, the options market is sending mixed messages.
Chart 6 plots a 21-day moving average of the CBOE equity put-to-call ratio and the ISEE index, all equity. The latter is a call-to-put ratio, hence inverted in the chart. It only uses opening long trades and excludes trades from market makers and broke/dealers. Thus, from the sentiment point of view, it is considered a cleaner number.
After bottoming on March 12 at 116.9, the red line has been rising, with last Friday at 124.3. In the right circumstances, it has tons of room to continue higher, which in general should bode well for stocks. That said, the green line is not in confirmation. It is going the other way, from .61 on March 15 to .634 last Friday.
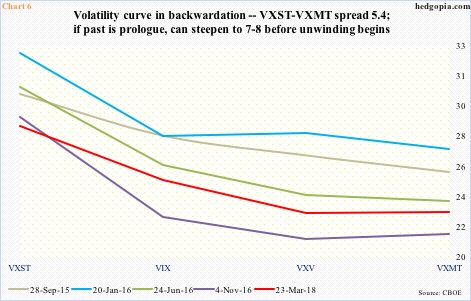
The volatility curve – VXST (measures nine-day implied volatility using S&P 500 options), VIX (30 days), VXV (90 days) and VXMT (six months) – is the same way. Kind of.
It is now in backwardation, with the VXST-VXMT spread of 5.36 points. In the past, a spread of seven, eight points means unwinding can begin, which, in turn, bodes well for risk assets, including equities. The problem with this is that in late September 2015 the spread began unwinding after rising to 4.93, while in early November 2016 it did so after getting to 7.38. Further, during last month’s volatility spike it surged to 34.79 on the 5th (not shown in Chart 6). The latter is more of an exception than a rule.
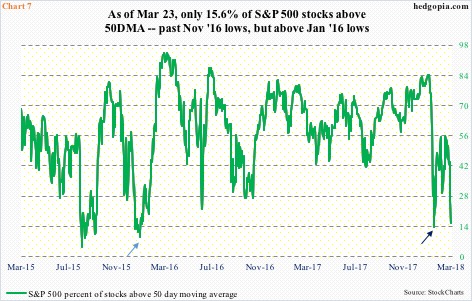
Amidst these mixed messages, there is one that is beginning to look grossly oversold. The percent of S&P 500 stocks above the 50-day stood at 15.6 last Friday. On February 8, a day prior to the intraday reversal, this had dropped to 13.6 percent. Of course, this went as low as nine percent in January 2016 (light blue arrow in Chart 7), but that also represented a great buying opportunity.
Is the current selloff offering a similar opportunity? Tough to say. This much we know. There has been technical damage. All three equity indices mentioned here – and others – are below their respective 50-day, which is also pointing lower. In a scenario in which the spreads in Chart 1 continue higher, the Nasdaq 100 can easily go on to unwind its monthly overbought condition. This is more medium- to long-term risk. Near-term, these indices are also at/near crucial technical levels, including support from metrics such as in Chart 7. Hence the need to keep an eye out for reversal. Should one occur this week, how they behave at/near the 50-day will be a tell.
Thanks for reading!
Disclaimer: This article is not intended to be, nor shall it be construed as, investment advice. Neither the information nor any opinion expressed here constitutes an offer to buy or sell any ...
more

