
Stocks Hit New Highs Despite Rotation Into Defensive Sectors
Some investors transitioned from a “fear of missing out” (aka FOMO) at the beginning of the year to a worry that things are now “as good as it gets” – meaning that the market is in its last bullish move before the inevitable downturn kicks in. And now, escalating trade wars and a flattening yield curve have added to those fears. However, it appears to me that little has changed with the fundamentally strong outlook characterized by global economic growth, strong US corporate earnings, modest inflation, low real interest rates, a stable global banking system, and historic fiscal stimulus in the US (including both corporate tax cuts and deregulation). Moreover, the Fed may be sending signals of a slowing of rate hikes, while great strides have been made in reworking trade deals.
Many followers of Sabrient are wondering why our Baker’s Dozen portfolios – most of which had been performing quite well until mid-June – suddenly saw performance go south even though the broad market averages have managed to achieve new highs. Their concerns are understandable. However, if you look under the hood of the S&P 500, leadership over the past three months has not come from where you would expect in a robust economy. An escalation in trade wars (moving from posturing to reality) led industrial metals prices to collapse while investors suddenly shunned cyclical sectors in favor of defensive sectors in a “risk-off” rotation, along with some of the mega-cap momentum Tech names. This was not a healthy behavior reflecting the fundamentally-strong economy and reasonable equity valuations.
But consensus forward estimates from the analyst community for most of the stocks in these cyclical sectors have not dropped, and in fact, guidance has generally improved as prices have fallen, making forward valuations much more attractive. Sabrient’s fundamentals-based GARP (growth at a reasonable price) model, which analyzes the forward estimates of the analyst community, still suggests solid tailwinds and an overweight in cyclical sectors. Thus, we expect that investor sentiment will eventually fall in line and we will see a “risk-on” rotation back into cyclicals as the market once again rewards stronger GARP qualities rather than just the momentum or defensive names. In other words, we think that now is the wrong time to exit our cyclicals-heavy Baker’s Dozen portfolios. I talk a lot more about this in today’s commentary.
Of course, risks abound. One involves divergent central bank monetary policies, with some continuing to ease while others (including the US and China) begin a gradual tightening process, and the enormous impact on currency exchange rates. Moreover, the gradual withdrawal of massive liquidity from the global economy is an unprecedented challenge rife with uncertainty. Another is the high levels of global debt (especially China) and escalating trade wars (most importantly with China). Because China is mentioned in every one of these major risk areas, I talk a lot more about China in today’s commentary.
In this periodic update, I provide a market commentary, offer my technical analysis of the S&P 500, review Sabrient’s latest fundamentals-based SectorCast rankings of the ten US business sectors, and serve up some actionable ETF trading ideas. In summary, our sector rankings now look even more strongly bullish, while the sector rotation model retains its bullish posture. Read on...
Market Commentary:
Impact of trade wars on Sabrient’s GARP portfolios:
First let me speak to recent market conditions because investor sentiment is not as confident as the recent all-time highs make it seem. A strong 2017 carried over into January, led by the momentum factor and growth stocks, reflecting brimming business, consumer, and investor confidence in synchronized global economic growth and the massive potential presented by fiscal stimulus here at home. Most of Sabrient’s cyclicals-heavy portfolios thrived during this period. But then February brought about an overdue correction on fears of rising inflation and stock valuations getting ahead of themselves, and market behavior hasn’t been quite the same ever since, as trade war rhetoric has kept investors jittery and sector correlations rose from around 50% to roughly 80% (reflecting more in the way of risk-on/risk-off behavior).
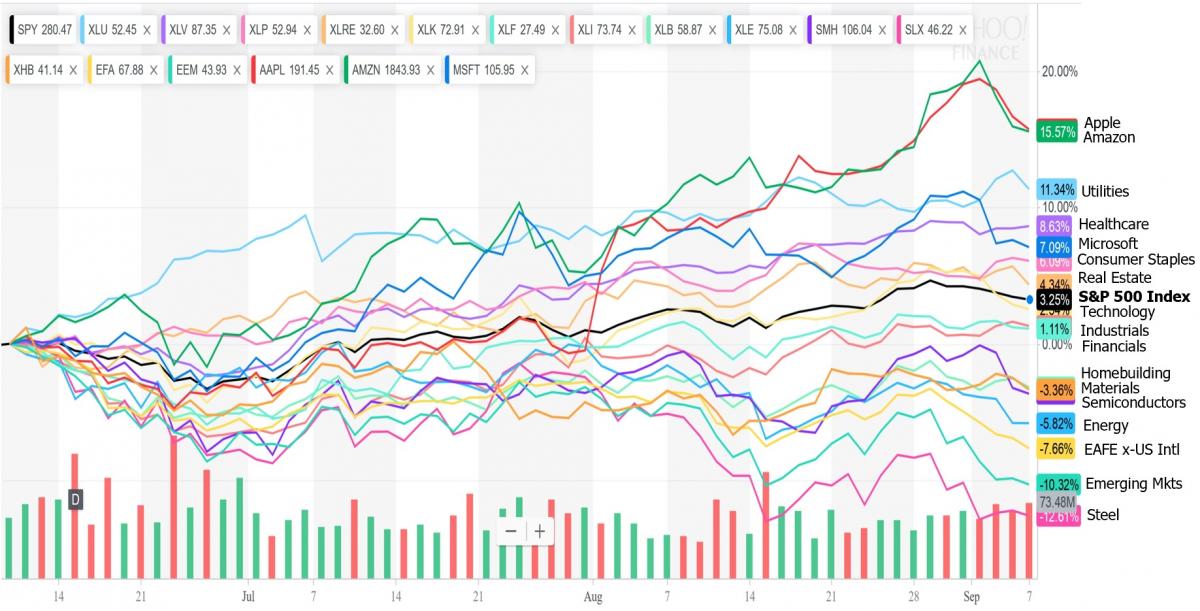
And then on June 11, the sudden escalation in trade wars (when President Trump announced a 25% tariff on $50 billion of Chinese imports) led investors to take profits in the cyclical sectors (e.g., Industrials, Materials, Steel, Homebuilding, Energy, Financials, Semiconductors) and rotate capital into the defensive and dividend-paying sectors (e.g., Utilities, Healthcare, Real Estate, Consumer Staples) and the low-volatility factor, along with a few mega-cap momentum Tech names that include the three largest holdings in the S&P 500: Apple (AAPL), Microsoft (MSFT), and Amazon (AMZN). Notably, those three companies account for almost half of the S&P 500’s return since June 11, and two of them (AAPL and AMZN) recently reached $1 trillion market caps.
You can see the rotation since June 11 among various sector ETFs and mega-cap Techs in the chart below, as well as a similar risk-off divergence in the relative performance of international markets represented by the iShares MSCI EAFA ETF (EFA) and the iShares MSCI Emerging Markets ETF (EEM):
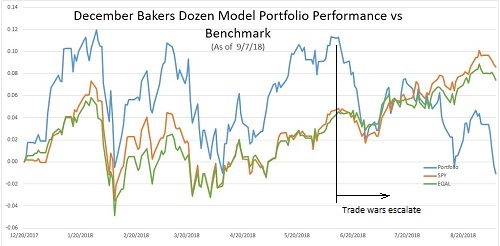
Meanwhile, Sabrient’s quantitative GARP model has pointed us toward the cyclical sectors, as you would expect in a robust economy. Our December Baker's Dozen launched late in December, so it can help serve to illustrate the 2018 YTD performance of our models, and you can see in the chart below the sudden performance downturn starting on June 11 coinciding with the escalation in trade wars. (Note: it shows gross price performance of our Model Portfolio, not the net return of the UIT portfolio that seeks to track it.)
If you believe that US and global economies are strong and growing, then cyclicals (and our portfolios) are likely only temporarily underperforming. But for now, our pronounced sector tilts away from the benchmark’s allocations have magnified the impact on relative performance. The S&P 500 benchmark has been able to hold up better (and even move to new highs) due to three key aspects: 1) a high (26%) sector allocation to the Technology sector, which our GARP model has not been favoring lately as much as it did in prior years; 2) persistent strength in mega-cap momentum names like AAPL, MSFT, AMZN, which are its 3 largest holdings; and 3) the ability to retain investment capital while temporarily rotating internally into defensive sectors like Utilities, Healthcare, Real Estate, and Consumer Staples.
Sabrient’s concentrated Baker’s Dozen portfolios are designed to offer strong potential for alpha versus the broad market, but they also can display higher volatility – especially given sector tilts away from the benchmark. But this current performance divergence (extreme as it may be) certainly does not lead me to lose confidence in the long-term performance of Sabrient’s disciplined bottom-up process, which continues to be run by founder David Brown and the combined Sabrient/Gradient analyst team. History shows that when the market is rewarding fundamentals (rather than simply reacting to the news stream in risk-on/risk-off behavior), our GARP approach tends to work quite well. The chart below shows the long-term gross performance of our annual January Model Portfolio, 2009-2017, going into this year:
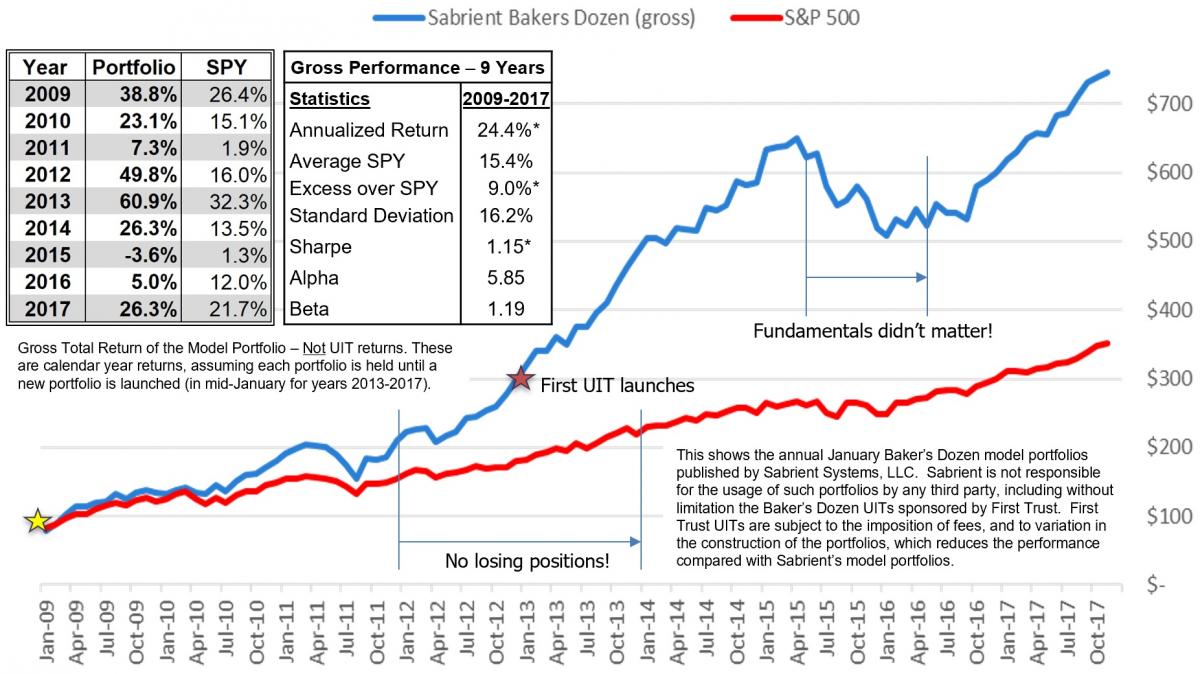
The main periods of underperformance were in 2H2011 and the 12-month timeframe 2H2015-1H2016, during which the market was news-driven rather than fundamentals-driven. You can find more information, including the specific holdings of each historical January portfolio, as well as the new monthly Baker’s Dozens, on our public website: http://bakersdozen.sabrient.com.
Of course, if the sell-side analyst community were to slash estimates in the cyclical sectors due to a change in outlook, that would certainly impact our quant rankings. But that has not yet been the case, as the consensus forward estimates from the analyst community for most of the stocks in these cyclical sectors have not dropped, and in fact, guidance has generally improved as prices have fallen, making forward valuations much more attractive. And with fiscal stimulus boosting what I think is a mid-cycle economy that seems ready to finally ramp into a boom phase, cyclicals remain the place to be overweight, according to our model.
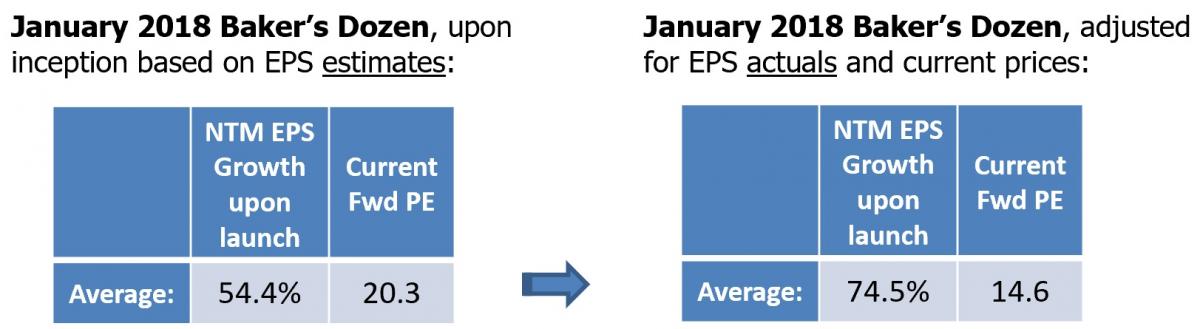
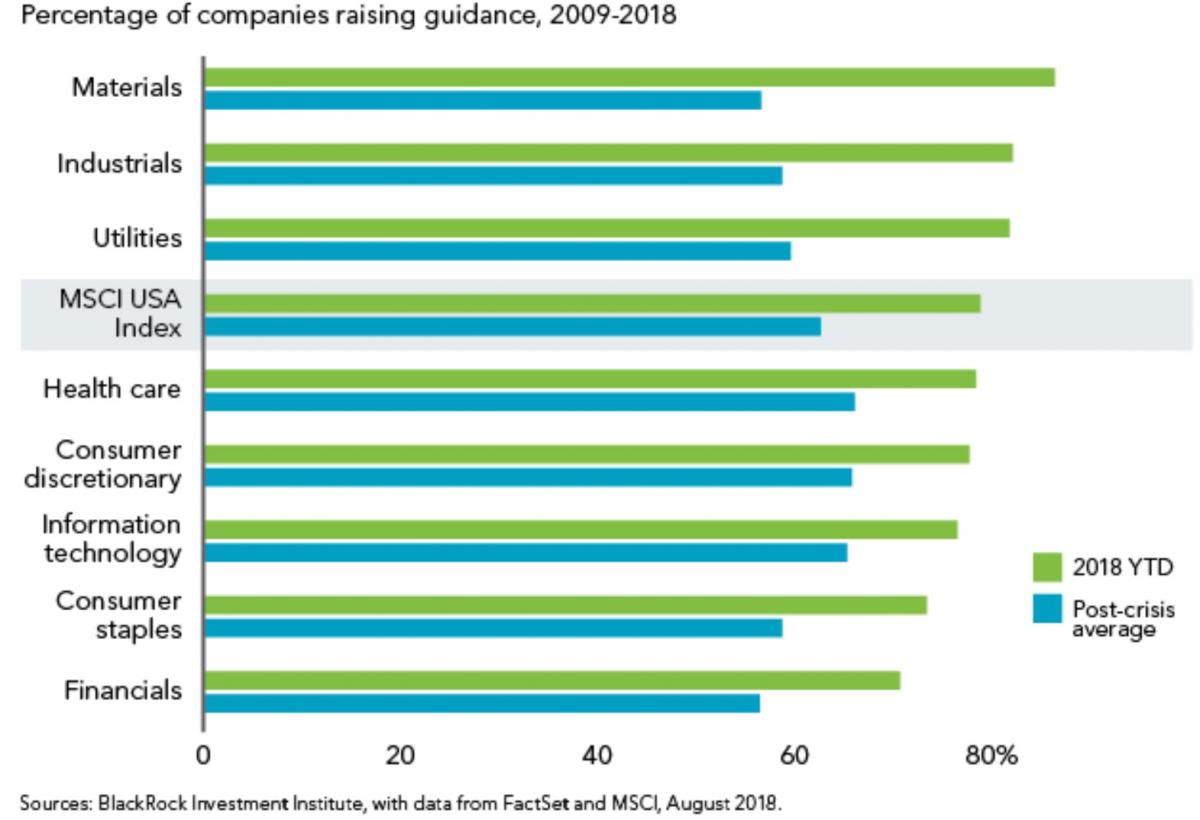
Indeed, the tables below show how much better the EPS growth for next 12 months (NTM) and forward P/E ratio are when we replace the original estimates for Q1 and Q2 with actual reported EPS numbers for the January Baker’s Dozen stocks, along with current prices. In addition, the second graphic published by BlackRock shows that Materials and Industrials companies have been raising guidance this year much more than the post-Financial Crisis average, despite the trade wars. Unless guidance suddenly weakens significantly and the analyst community slashes forward estimates, we fully expect these stocks to recover, as their numbers are just too good.
So, forward valuations for our Baker’s Dozen stocks appear to be much more attractive. And with fiscal stimulus boosting what I consider to be a mid-cycle economy that finally seems ready to ramp into a long-awaited boom phase, cyclicals remain the place to be overweighted, according to our model. We have great optimism that as strong earnings reports continue to roll in, if forward guidance remains solid and the trade wars are resolved (especially with China), investor sentiment will fall in line and we will see a risk-on rotation back into cyclicals as the market once again rewards stronger GARP qualities rather than just the momentum or defensive names. In fact, if you look closely at the December Baker's Dozen performance chart above, the brief but significant performance upturn in mid-August – after the announcement that talks with China had resumed – may have provided a glimpse of that potential.
The economy, corporate earnings, and Fed policy:
Next, let’s explore the strength in the economy and corporate earnings, the direction of interest rates, and the likely outcome of trade wars.
Numerous market pundits have been lamenting “protectionist” tariffs, a slowdown in housing, a too-strong US dollar, a spiraling financial crisis in emerging markets (led by Turkey and Argentina, spreading to Brazil, South Africa, and Indonesia), growth deceleration in Europe and China, a hawkish Fed, the yield curve threatening to invert, and a toxic domestic political environment with mid-term elections on tap, et al. And yet the US economy just keeps expanding. The BEA’s second estimate of GDP came in at a 4.2% annual rate in the second quarter (after an advance reading of 4.1%), which is the fastest rate since late-2014. Looking ahead, the Atlanta Fed’s GDPNow model as of September 5 forecasts 3Q18 GDP annualized growth of 4.4%, while the New York Fed’s Nowcast model as of September 7 forecasts 2.2%. Friday’s jobs data was stellar, with unemployment remaining at 3.9%, while year-over-year wage growth clocked in at 2.9%. Consumer and business confidence, household consumption, and industrial production are all strong. ISM Manufacturing report blew away estimates (61.3 vs. 57.7 consensus), with strong production, a surge in new orders, and rising backlogs. Q2 earnings reports showed that 83% of US firms beat earnings estimates, driven by broad-based revenue growth (not just tax cuts) and record levels of profitability (around 12%). In his speech at the Jackson Hole Economic Symposium, Fed chair Jerome Powell said, “Over the course of a long recovery, the U.S. economy has strengthened substantially…With solid household and business confidence, healthy levels of job creation, rising incomes, and fiscal stimulus arriving, there is good reason to expect that this strong performance will continue.”
Mr. Powell defended the FOMC’s plan for a slow-but-steady rise in the fed funds rate, but he also noted that as long as the unemployment rate remains low and inflation stable near the 2% target, he doesn’t see a need to accelerate the current path of interest rate increases. And St. Louis Fed CEO James Bullard suggested, “The Phillips Curve has disappeared and neither low unemployment nor faster real GDP growth gives a reliable signal of inflationary pressure” such that the Fed should watch the yield curve in deciding monetary policy. They seem to be leaving open the door to adjustments to the current plan, and I believe these are the initial signals of a potential slowing of Fed rate hikes. Indeed, in contrast to the stated plan for two more rate hikes this year followed by four next year, which would move the fed funds rate from the current 2.00% to 3.50% by the end of 2019, CME Group fed funds futures (which essentially reflect the real-money bets by knowledgeable traders on what the Fed will actually do) suggest that the highest percentage likelihood (62%) by next September is a fed funds rate of 2.75% or less. But in the near term, fed funds futures currently place the odds of a rate hike at the upcoming September meeting at 99.8%, and by the December meeting, there is an 80% probability of another quarter-point rate hike. But for next year, the story might be quite different.
So, why would Powell slow things down if he thinks our economy is so solid? Well, there are a number of reasons. First of all, we aren’t an island unto ourselves, and the divergent monetary policies of central banks mean that Fed tightening has strengthened the dollar to the detriment of emerging markets (who carry dollar-denominated debt but earn their money in weaker local currencies), and rising interest rates can further hurt their ability to repay. Weaker currencies in these markets have contributed to the decline in commodity prices. Moreover, President Trump has made it clear that he will not be a happy camper if Fed tightening messes up our strong economic growth – which Trump is using as “cover” to fight his trade wars. In addition, some strategists would say that we appear to be on the verge of a “Fed inversion” of the yield curve. The 10-year Treasury yield closed Friday at 2.94% while the 2-year T-note is at 2.68%, so the closely-watched 2-10 spread is only 24 bps (less than one Fed 25-bp rate hike). You see, the Fed controls the short-end of the curve, and the 2-year note is heavily influenced by it, but the 10-year is much more market-driven (with Fed QE/QT having lesser impact), and you can bet the Fed doesn’t want to be responsible for inverting the curve.
What are these market dynamics pushing capital into US Treasuries and keeping the 10-year yield under 3.0%? Regular readers of mine know that I have been in the “lower for longer” camp regarding the 10-year Treasury yields for a long time (and lower long-term yields support equity valuations). These dynamics include geopolitical turmoil and aging demographics seeking safe yield, divergent central bank monetary policies and the much higher rates offered in the US (and the resulting “carry trade” from other countries), plus the structure of cap-weighted fixed-income indexes whereby the large mutual funds and ETFs whose mandate is to track them must buy these Treasuries, even as new issuance floods the market.
But with the 10-year struggling to rise while the fed continues to raise on the short end, the flattening of the yield curve – according to the Fed chair himself – is essentially the marketplace telling the FOMC that it is already close to the “neutral rate” and may not need to raise much further. (The neutral rate is the level at which the Fed's target fed funds rate neither stimulates nor slows the economy, and Fed officials see it as being close to 3%.) Powell has previously stated that there is a lot of uncertainty surrounding estimates of the neutral interest rate and that the FOMC therefore “will refer to many indicators when judging the degree of slack in the economy or the degree of accommodation in the current policy stance.”
The trade war with China:
As for the ongoing trade tensions. In my August article, I said that I would talk a lot more this month about China, so let’s have at it.
As you know, our President has been using various unconventional tactics to bring our various trading partners to the negotiating table to rework longstanding trade deals he believes have essentially subsidized the growth of other countries at our own expense. In other words, the temporary “hand up” long ago became a permanent “hand out” (aka entitlement) that they no longer need and we can no longer afford. Of course, the biggest offender is China, which has long used state ownership, subsidy, overcapacity, tariffs, forced technology transfer, patent violations, and outright theft of intellectual property (IP) to give their businesses an advantage in the global marketplace, while US businesses have looked the other way so as not to jeopardize their entry into the Chinese market. From China’s standpoint, it is much more expedient to appropriate the technology needed to drive growth than to go through the arduous and expensive process of R&D.
In a search for ways to continue its rapid growth in the face of the “law of large numbers” as an obstacle, the country has embarked upon its Belt & Road Initiative (aka BRI) and created a “Made in China 2025” strategic roadmap. BRI is an ambitious state-backed stimulus package for a slowing economy (and a path to global dominance) made up of a “belt” of overland corridors and a maritime “road” of shipping lanes that connect Asia, Africa, and Europe, encompassing 71 countries comprising over half the world’s population and roughly a quarter of global GDP. China continues to aggressively build infrastructure – like airports, subways, bullet trains, and renewable-energy facilities (including nuclear power plants with stolen technology). It also will allow China to employ its excess capacity while luring many poor countries into a “debt trap” in which China can, for example, acquire land in exchange for writing off their debts. As for the Made in China 2025 initiative, it has the goal of capturing 70% of global production in the emerging industries of the future. This includes seeking to become the global leader in artificial intelligence (AI) by 2030, supplanting the US. To accomplish all of this, I’m sure China’s leaders feel the need to continue appropriating the IP of others rather than to create and pay for it themselves.
But a trade war couldn’t come at a worse time for China, in my view. The country is burdened with a highly-levered and fragile financial system, with some estimates that total debt-to-GDP has risen over the past 10 years from roughly 140% to about 300% – and much of that debt went to build massive domestic infrastructure projects with little to no ROI. And given that it produces nearly 19% of global GDP, the ripple effects are also impacting commodity prices and emerging markets. Now it finds itself with slowing GDP growth as domestic demand and credit expansion has slowed, while new manufacturing data show slowing export orders. But China is better prepared today to deal with this, as it has implemented rigid capital controls, tighter regulation, and improved coordination between policymakers than in 2015 when it was still early in its deleveraging efforts. Thus, the government actually has had some success in navigating its way through the deleveraging process without upsetting aggressive growth targets.
For example, it has restricted the practice of large domestic companies issuing local debt to buy US dollar-denominated assets, which weakened its currency and its consumer purchasing power at a time when it needed to transition to more of a consumer-driven economy (rather than simply dump cheap goods on the world as a disinflationary manufacturing-driven economy, as it had done for so many years). Such capital controls have helped to greatly slow capital flight to other countries, and restrictions on rampant “shadow banking” and “wealth management products” (risky uninsured loans disguised as investments, generally offering high yields and sometimes guaranteed returns) have improved domestic and foreign confidence in the renminbi, thus allowing the currency to gradually depreciate (rather than rapidly plummet), and the People’s Bank of China (PBC) is better able to balance structural financial reform and deleveraging with monetary easing and fiscal stimulus as needed.
Nevertheless, the trade war has renewed pressure on the renminbi, which endured its biggest monthly fall against the U.S. dollar on record in June, when the trade war rhetoric became reality. This led the Chinese government to temporarily reverse its quantitative tightening policies, injecting liquidity back into the system by renewing QE, cutting taxes, and redoubling infrastructure investment. Although this is counter to its goal of loosening up its capital markets and currency exchanges in order to take its “rightful place” among the world’s major financial powers, it had to be done – especially if you look back to the crisis it faced with capital flight in 2015 when it burned through $1 trillion in foreign currency reserves to support the renminbi before finally succumbing to a devaluation. But this time around, capital flight was more contained, and China has not had to resort to a currency devaluation like it did back in 2015. Many experts think that another currency devaluation would likely undermine deleveraging effort, drive unlawful capital flight, ignite inflation, and stanch the growing interest of foreign investors in China’s capital markets. So, I would think another devaluation is a monetary “last resort,” and a strategic “last resort” retaliatory tactic might be the withholding from the marketplace of rare earth metals (which are critical ingredients in high-tech consumer and military electronics, and China is the world’s primary producer).
All in all, with its economy weakening and its stock market mired in a bear market, it seems to me that China can ill-afford any escalation in the trade war with the US. But by the same token, giving up the advantages it enjoys in our existing trade deals would also hurt it. So, it’s a bit of a Catch-22. But on balance, it seems to me that it would be better to appease Trump than let this drag out.
Mohamed El-Erian, the chief economic advisor at Allianz, expects the US to win the trade war, citing the performance of US markets relative to China and others. He believes, “…it's just a matter of time until other countries realize that their best approach is to collaborate with the U.S. and fix things that are broken.” I couldn’t have said it better. He thinks there is a 60% chance that we end up with "fairer trade" for the US, a 15% chance that Trump will achieve a "Reagan moment" in trade with respect to China (referring to Reagan's breakthrough with the Soviet Union), and a 25% chance of a downward spiral into an ugly and debilitating global trade war.
My personal expectation is in line with his 60% scenario. But I think China is unlikely to fully acquiesce on the forced technology transfer issue, given how important it has been to their growth. So, I think the new trade deal will include a gradual phase-out of technology transfer, but there will be no compromise from the US on a requirement that China must recognize international patents and defend intellectual property rights, as well as a pledge to crack down on hacking and technology theft.
Do you think I obsess too much about China? I must admit I find it both fascinating and worrisome, given its opacity, its rigid control of its economy and suppression of free speech, its unique form of state-capitalism, and its huge importance to the global economy. The country has engineered a lengthy economic boom (aka the “China Miracle”), from which a free-market economy by now would need to “wring out excesses” with a bust cycle. But China is not a true free market, and it is attempting to deleverage and undergo a structural transition without slowing down too much. I for one am rooting for them, if only because a recession in China would drag down the rest of the world along with it.
China has a chance to pull it off because of its ability (through both choice and force) to bring the entire nation together with a unified conviction to a common purpose – growth, and prosperity. When the US has pursued a common purpose – like winning World War II or putting astronauts on the moon – we couldn’t be denied. But today, our country is so divided that a common purpose seems like a pipe dream. The resistance is so embedded and vocal that it seems that much of the country would prefer to see us fail and fall into recession rather than watch Trump gloat about a stronger economy under his watch and further embarrass us on the world political stage. But there is a silent majority that is rooting for him, in spite of his insufferable, strident, combative, and unstatesmanlike ways. In fact, those qualities are exactly what many Americans felt the country needed to shake up the Deep State and fix many of our long-festering problems. We shall see whether Trump can get some resolution on the trade war front in advance of November’s mid-term elections.
Outlook for stocks:
Nike’s new ad campaign featuring Colin Kaepernick urges us to “Believe in something.” Well, among other things, I believe in the US Constitution, capitalism, free markets, and personal responsibility. And I still believe in the solid underpinnings of today’s economy – with continued confidence that strong and sustainable economic fundamentals will continue to drive robust corporate earnings, supported by modest inflation and interest rates and a continued flow of foreign capital into the US. This should drive stocks higher into year-end and beyond, perhaps for the next few years, as a true economic boom cycle finally gains some traction. As Nick Colas of DataTrek has said, “…rates are low, the dollar is strong, and corporate earnings remain robust. Those are the only things stock prices can (and should) actually discount.” In addition, credit continues to grow (meaning that investors and consumers are borrowing). And then there are longstanding market indicators like Dow Theory, which states that stocks will likely rise when both the Dow Industrials and Dow Transports are both in confirmed uptrends, which they are.
Notably, Dan Loeb, CEO of hedge fund Third Point LLC, wrote in his recent investor letter that he expects US growth will remain strong due to fiscal stimulus and associated spending increases and that the global manufacturing cycle should resurge, barring a full-blown trade war. He sees little sign of impending acceleration in inflation despite record low unemployment. Moreover, he thinks the economic cycle can extend longer than many investors expect given that companies are on solid footing, and he thinks equities are not expensive at a forward P/E of around 16x. He wrote, “We believe the risk of recession in the next year remains low and, without this concern weighing heavily on the markets and with the tailwinds we have described, we believe equities should go higher but at a moderate pace.” Similarly, JP Morgan analysts believe a trade war escalation with China will likely be averted and that a resolution will lead to a slightly weaker dollar and a "risk-on convergence" that will boost cyclicals and emerging markets.
These narratives are very similar to mine. I expect stocks to see continued appreciation – not through P/E multiple expansion but rather through solid EPS growth, driven primarily by revenue growth but also by gains in productivity and profitability and supported by ongoing share buyback programs, as shares outstanding shrink (allowing total profits to be allocated across a smaller number of shares). Shares outstanding among S&P 500 companies has fallen 7.7% since the beginning of 2011 (according to Ed Yardeni). So, by my calculation, if buybacks hit $1 trillion this year for the S&P 500 as some pundits are suggesting, that would equate to 4.0% buyback yield, or put another way, it would allow for an additional 4% share price appreciation on top of the organic earnings growth rate (of perhaps 10-12%), assuming a constant P/E multiple.
I was saying at the beginning of the year that US equities were the best place to invest this year (especially small caps), and I still think they have more years of appreciation ahead. But with the enormous negative divergence in cyclical sectors and emerging markets, combined with slower rate hikes, renewed stability in US and China currencies, and a resolution to the trade conflicts, I think cyclicals, in particular, will do well, and emerging markets might be setting up for a terrific risk-on buying opportunity, as well.
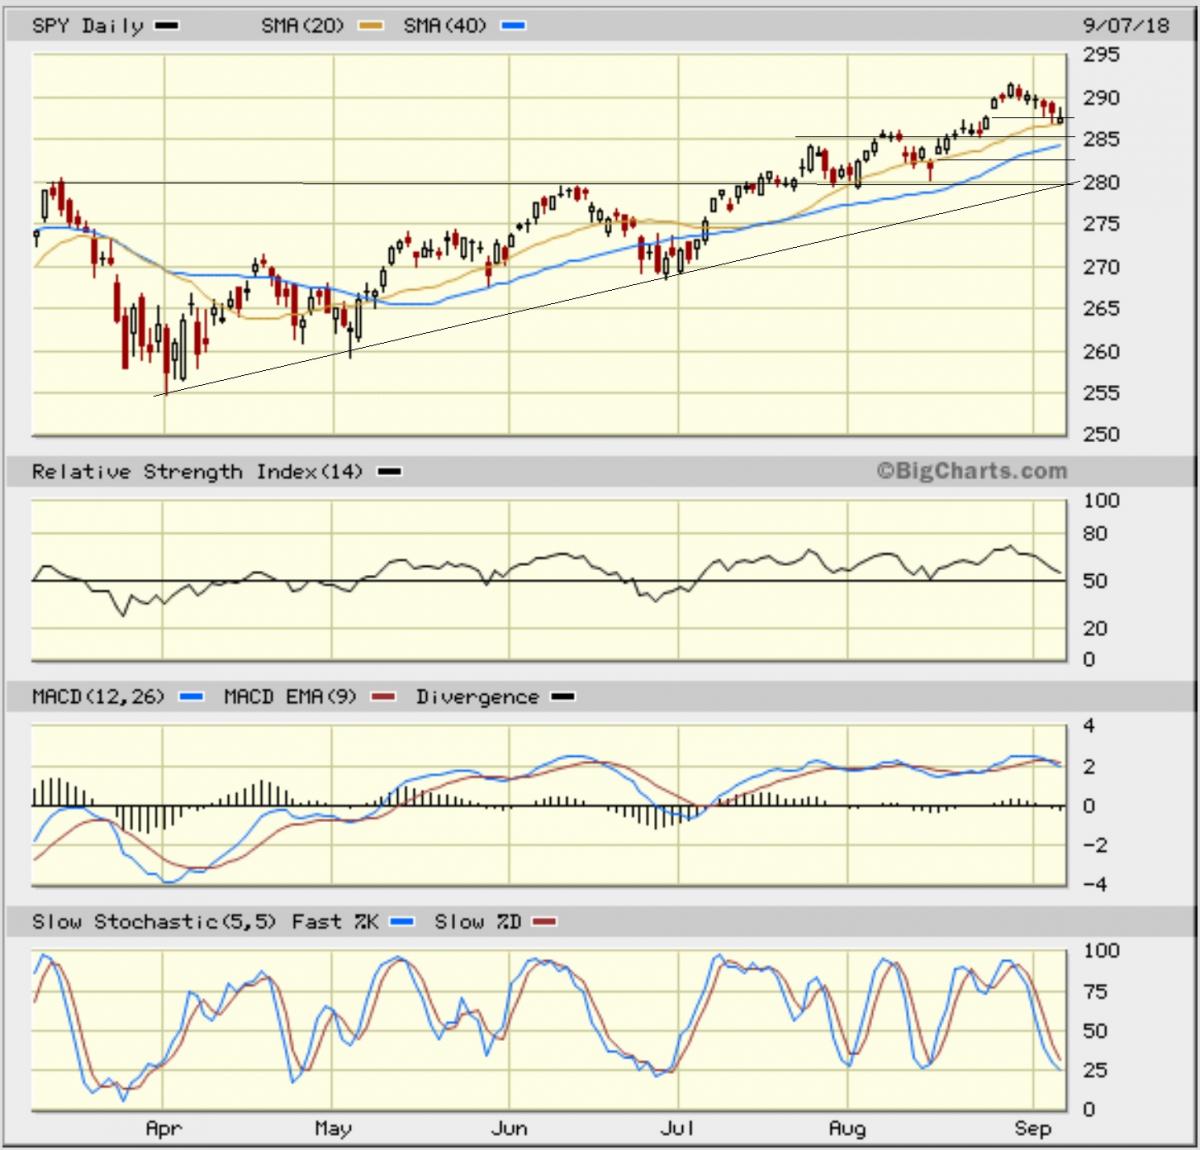
SPY Chart Review:
The SPDR S&P 500 ETF (SPY ) closed Friday at 287.60 after recently setting a new all-time high of 291.74. In fact, all the major averages set new highs at the end of August, with the S&P 500 briefly eclipsing 2,900, the Dow Industrials 26,000, Nasdaq 8,100, and Russell 2000 over 1,740. I mentioned last month that it appeared traders had gained sufficient bullish conviction to push higher and challenge the all-time highs. After exceeding the previous highs, SPY has now pulled back to support at the 20-day simple moving average (SMA), and while doing so filled a price gap from the close on August 24, which is an important part of the consolidation process. Oscillators RSI, MACD, and Slow Stochastic have all worked off much of their overbought conditions and seem ready to turn upwards. If the 20-day SMA doesn’t hold, next support levels can be found at the breakout resistance-turned-support level of 285, followed by the 50-day SMA at 283, a prior price gap at 282, prior support at 280, the 100-day at 277, and the critical 200-day SMA nearing 274. Despite ongoing worries about the negative impact of trade wars, the chart looks bullish and nearly ready to resume the uptrend – although I think a rotation back into cyclicals will be needed to lead a sustained uptrend.
Note that the current estimate for the S&P 500 EPS in 2019 is $178. Given a 17x forward P/E multiple, that would put the S&P 500 well above 3,000 by year end and SPY above 300. Likewise, Roelof-Jan van den Akker, ING's senior technical analyst, previously forecasted the breakout to new all-time highs above horizontal resistance at the 287 level achieved in January, and now expects a resumption of the longer term uptrend with an eventual target of between 315–320.
Latest Sector Rankings:
Relative sector rankings are based on our proprietary SectorCast model, which builds a composite profile of each of over 600 equity ETFs based on bottom-up aggregate scoring of the constituent stocks. The Outlook Score employs a forward-looking, fundamentals-based multifactor algorithm considering forward valuation, historical and projected earnings growth, the dynamics of Wall Street analysts’ consensus earnings estimates and recent revisions (up or down), quality and sustainability of reported earnings, and various return ratios. It helps us predict relative performance over the next 1-3 months.
In addition, SectorCast computes a Bull Score and Bear Score for each ETF based on recent price behavior of the constituent stocks on particularly strong and weak market days. A high Bull score indicates that stocks within the ETF recently have tended toward relative outperformance when the market is strong, while a high Bear score indicates that stocks within the ETF have tended to hold up relatively well (i.e., safe havens) when the market is weak.
Outlook score is forward-looking while Bull and Bear are backward-looking. As a group, these three scores can be helpful for positioning a portfolio for a given set of anticipated market conditions. Of course, each ETF holds a unique portfolio of stocks and position weights, so the sectors represented will score differently depending upon which set of ETFs is used. We use the iShares that represent the ten major U.S. business sectors: Financial (IYF), Technology (IYW), Industrial (IYJ), Healthcare (IYH), Consumer Goods (IYK), Consumer Services (IYC), Energy (IYE), Basic Materials (IYM), Telecommunications (IYZ), and Utilities (IDU). Whereas the Select Sector SPDRs only contain stocks from the S&P 500 large-cap index, I prefer the iShares for their larger universe and broader diversity.
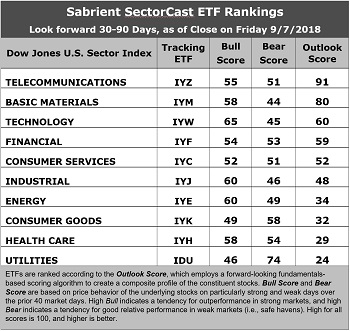
Here are some of my observations on this week’s scores:
1. Telecom retains to the top spot with a robust Outlook score of 91. After making its debut in the top spot last month, indeed it’s been the top performer over the last 30 days. Telecom displays a relatively low forward P/E (14.7x), some of the best sell-side analyst sentiment (net positive revisions to EPS estimates), and the highest return ratios. Although its projected year-over-year EPS growth rate is on the low side (10.0%), its forward PEG (ratio of forward P/E to forward EPS growth rate) is a respectable 1.46. Basic Materials takes second with an Outlook score of 80, having good return ratios, positive sell-side analyst sentiment, the lowest forward P/E (14.0x, as investors have shied away due to trade war fears), and a forward PEG of 1.10. Technology, Financial, Consumer Services (Discretionary/Cyclical), Industrial, and Energy follow in line, and the top five all score above 50. Consumer Services enjoys the best analyst sentiment in terms of upward EPS revisions, while Energy has the highest projected EPS YOY growth rate of 50.8% and the lowest forward PEG of 0.31. Also, the forward P/E for Energy continues to fall as estimates rise while prices languish, and now sits at 15.8x (versus 24x at the beginning of 2018 and 32x at the beginning of 2017).
2. Three sectors are bunched at the bottom: Utilities, Healthcare, and Consumer Goods (Staples/Noncyclical). Each of these sectors is either defensive or all-weather, and each either has seen prices rise faster than earnings projections, or analysts have cut net EPS estimates, or EPS growth rates are on the low end.
3. Looking at the Bull scores, Technology enjoys the top score of 65, followed by Industrial and Energy, as stocks within these sectors have displayed relative strength on strong market days. Utilities scores the lowest at 46 and Consumer Goods scores 49, as their leadership over the past few months of market uptrend may be waning. The top-bottom spread is 19 points, which reflects low sector correlations on strong market days. It is desirable in a healthy market to see low correlations reflected in a top-bottom spread of at least 20 points, which indicates that investors have clear preferences in the market segments and stocks they want to hold (rather than broad risk-on behavior).
4. Looking at the Bear scores, we find Utilities in the top spot with a score of 74, which means that stocks within this defensive sector have been the preferred safe havens lately on weak market days. Materials has the lowest score of 44, followed by Technology at 45, as investors have fled during recent market weakness. The top-bottom spread is 30 points, which reflects quite low sector correlations on weak market days. Ideally, certain sectors will hold up relatively well while others are selling off (rather than broad risk-off behavior), so it is desirable in a healthy market to see low correlations reflected in a top-bottom spread of at least 20 points.
5. Telecom displays the best all-around combination of Outlook/Bull/Bear scores, followed by Materials, while Consumer Goods (Staples/Noncyclical) is the worst. Looking at just the Bull/Bear combination, Utilities is the best, followed by Healthcare, indicating superior relative performance (on average) in extreme market conditions (whether bullish or bearish), while Materials is the worst, as investors have generally avoided the sector lately.
6. This week’s fundamentals-based Outlook ranking reflects a more strongly bullish bias, given that six of the top seven sectors are economically-sensitive or cyclical. Keep in mind, the Outlook Rank does not include timing, momentum, or relative strength factors, but rather reflects the consensus fundamental expectations at a given point in time for individual stocks, aggregated by sector.
ETF Trading Ideas:
Our Sector Rotation model, which appropriately weights Outlook, Bull, and Bear scores in accordance with the overall market’s prevailing trend (bullish, neutral, or defensive), still displays a bullish bias and suggests holding Technology (IYW), Basic Materials (IYM), and Telecom (IYZ), in that order. (Note: In this model, we consider the bias to be bullish from a rules-based trend-following standpoint when SPY is above both its 50-day and 200-day simple moving averages.)
Besides iShares’ IYW, IYM, and IYZ, other highly-ranked ETFs in our SectorCast model (which scores over 500 US-listed equity ETFs) from the Technology, Materials, and Telecom sectors include VanEck Vectors Semiconductor (SMH), VanEck Vectors Steel (SLX), and First Trust NASDAQ Smartphone Index (FONE).
If you prefer a neutral bias, the Sector Rotation model suggests holding Telecom, Basic Materials, and Technology, in that order. On the other hand, if you are more comfortable with a defensive stance on the market, the model suggests holding Utilities, Telecom, and Financial, in that order.
An assortment of other interesting ETFs that are scoring well in our latest rankings include First Trust Materials AlphaDEX Fund (FXZ), Pacer US Cash Cows 100 (COWZ), AdvisorShares Dorsey Wright ADR (AADR), SPDR S&P Homebuilders (XHB), US Global Jets (JETS), VanEck Vectors BDC Income (BIZD), iShares Edge MSCI USA Value Factor (VLUE ), Forensic Accounting Long-Short (FLAG), Cambria Value and Momentum (VAMO), and Cambria Shareholder Yield (SYLD).
IMPORTANT NOTE: I post this information periodically as a free look inside some of our institutional research and as a source of some trading ideas for your own further investigation. It is not ...
more

