
Stocks Going Lower After Fed, Were We Right About The Topping Pattern?
The U.S. stock market indexes lost 1.1-1.3% on Wednesday, as investors reacted to the Fed's interest rate cut decision release. The S&P 500 index broke below the 3,000 mark. It fell almost 70 points of its Friday's new record high of 3,027.98, before bouncing off the support level and closing more than 20 points above the daily low. The Dow Jones Industrial Average lost 1.2% and the Nasdaq Composite lost 1.3% on Wednesday.
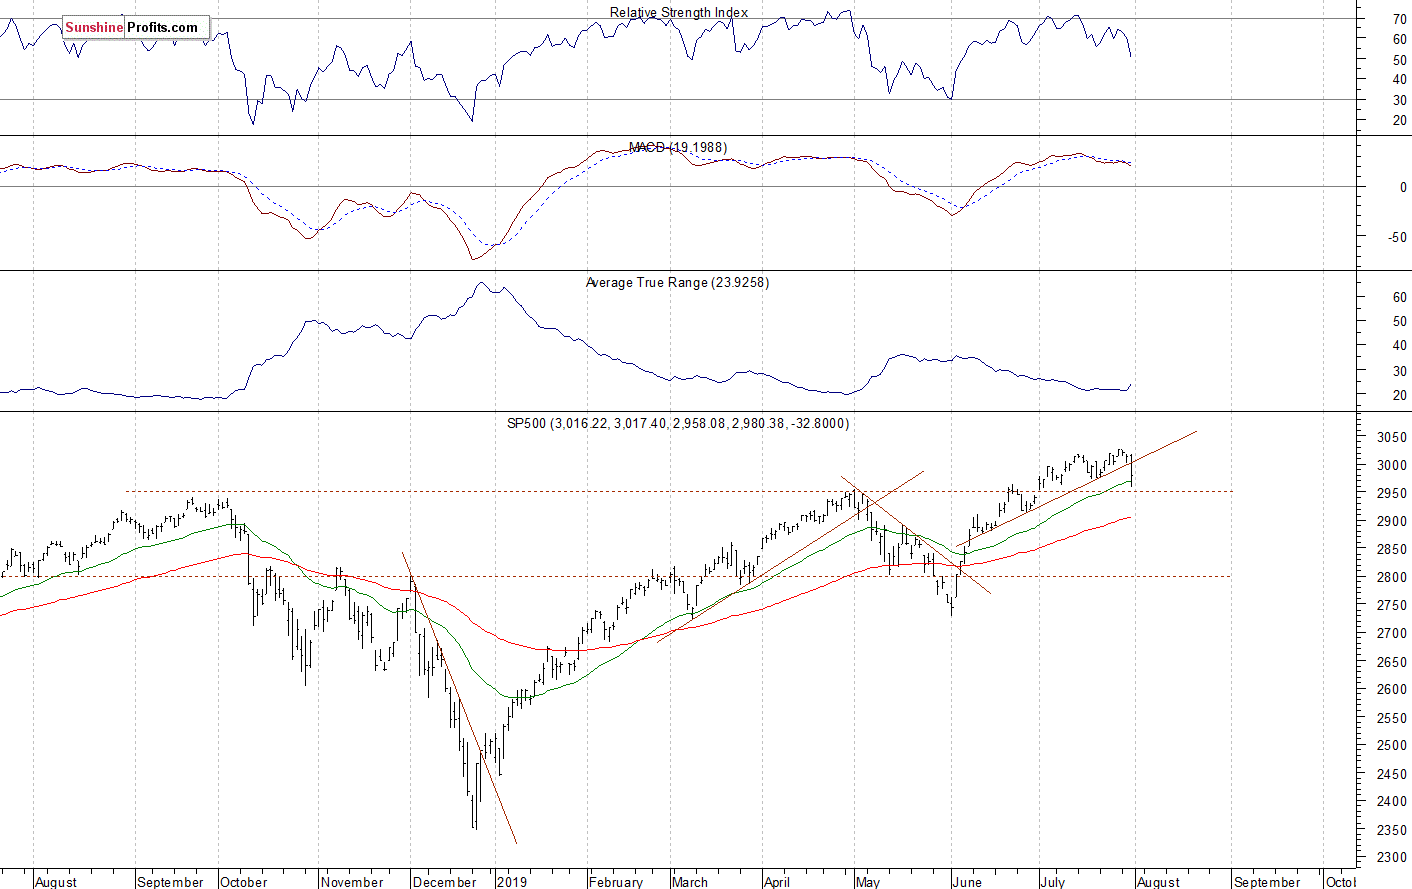
The nearest important resistance level of the S&P 500 index is now at 2,995-3,000, marked by the recent support level. The resistance level is also at 3,020-3,030. On the other hand, the support level is at 2,950-2,960, marked by the early May local high of around 2,954, among others.
The broad stock market broke below its two-month-long upward trend line yesterday, and then it accelerated lower towards the early May local high. Is this a downward reversal or just another correction within an over half-year-long medium-term uptrend? For now, it looks like a downward correction:
(Click on image to enlarge)
New Short-Term Uptrend or Just Retracement?
The index futures contracts trade 0.1-0.4% above their Wednesday's closing prices, so expectations before the opening of today's trading session are slightly positive. The European stock market indexes have been mixed so far. Investors will wait for some economic data announcements today: Unemployment Claims at 8:30 a.m., ISM Manufacturing PMI, Construction Spending at 10:00 a.m.
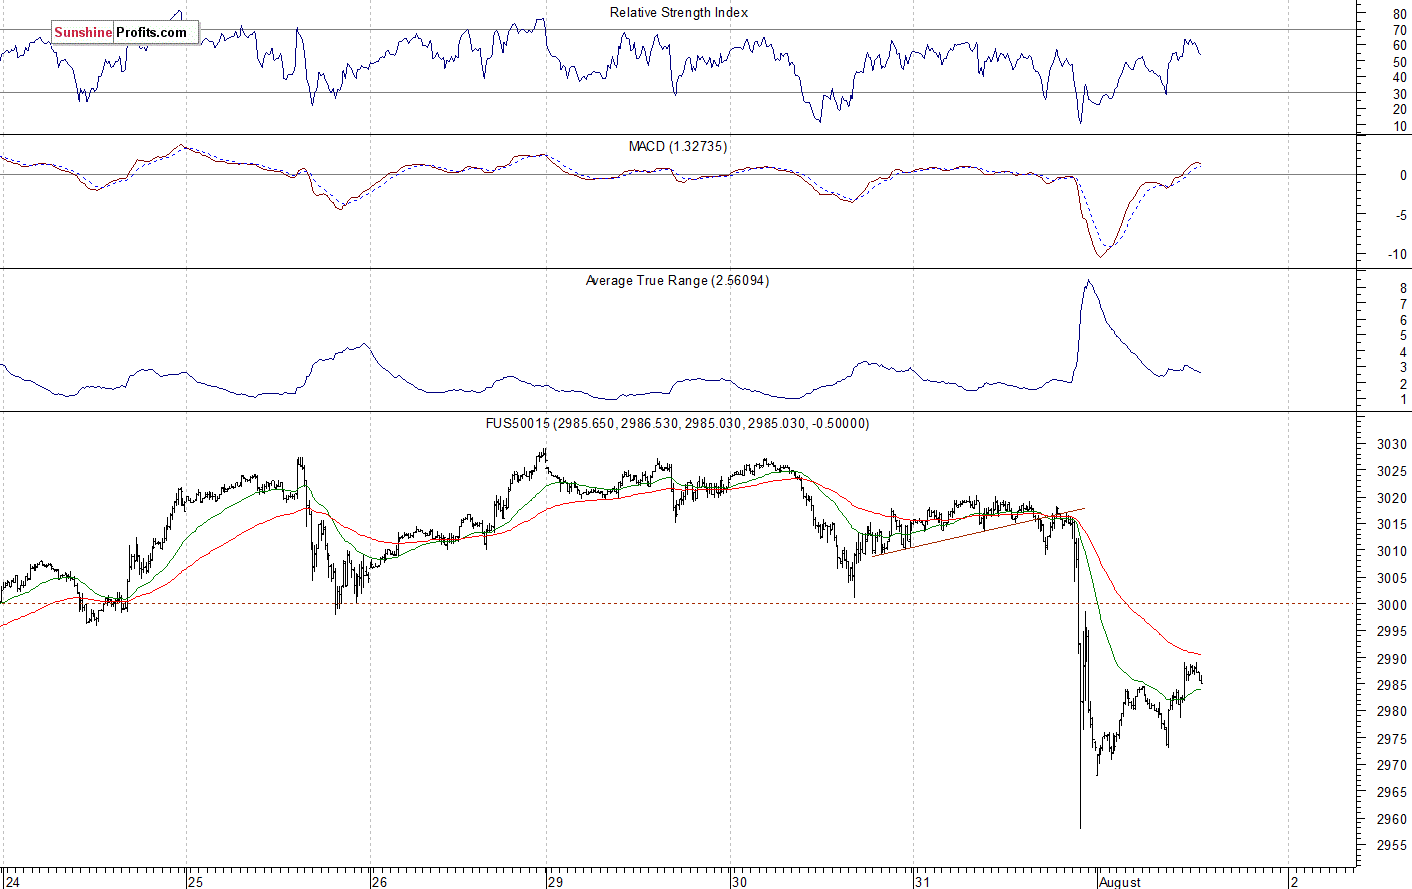
The S&P 500 futures contract trades within an intraday uptrend, as it retraces some of its yesterday's decline. The nearest important resistance level is now at around 3,000, marked by the previous support level. On the other hand, the support level is at 2,970-2,975, among others. The futures contract is within a short-term upward correction this morning, as the 15-minute chart shows:
(Click on image to enlarge)
Nasdaq 100 Slightly Below 7,900
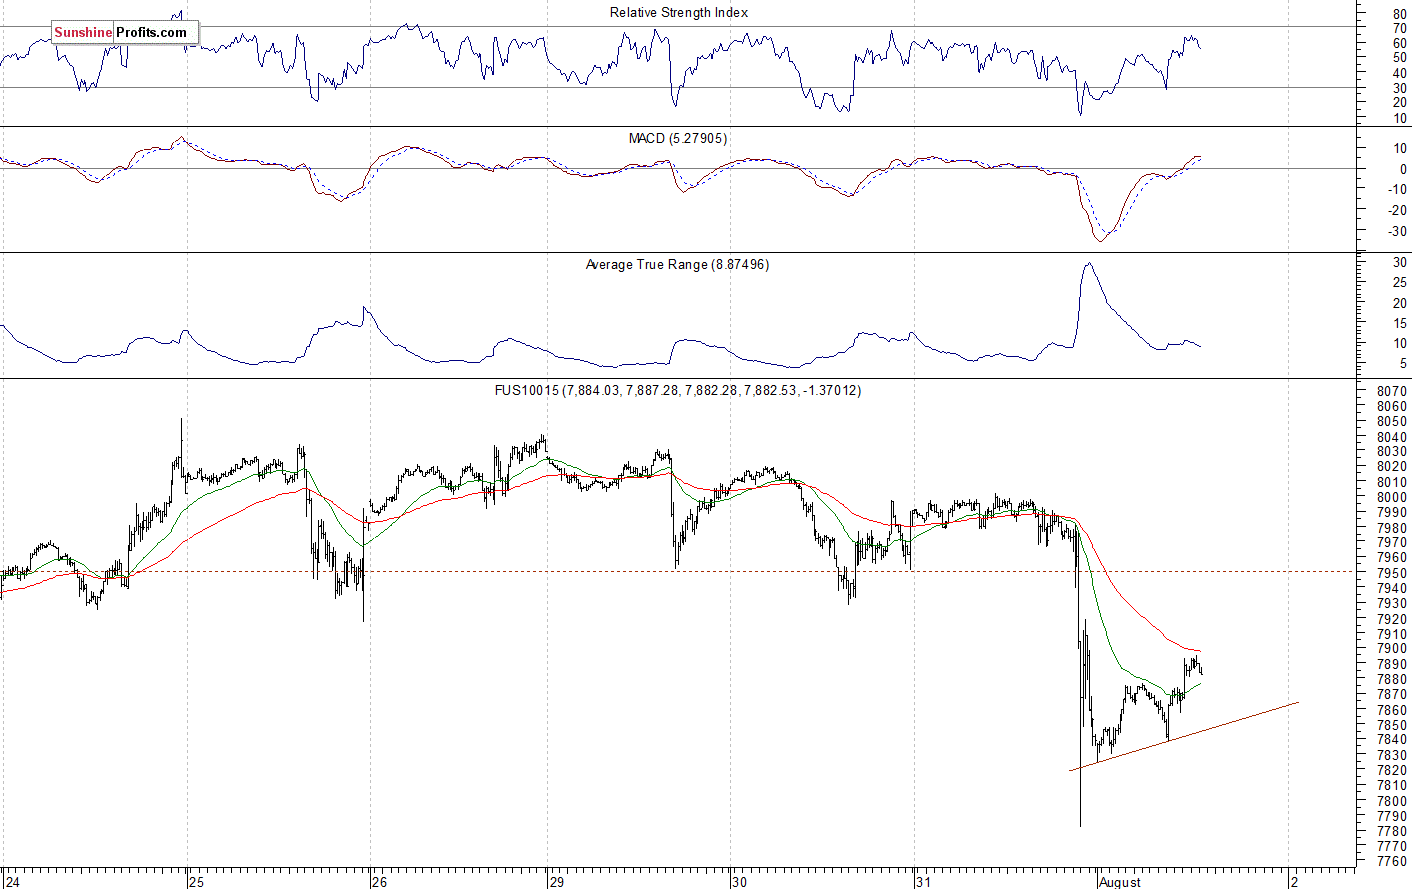
The technology Nasdaq 100 futures contract follows a similar path, as it trades within an intraday uptrend this morning. The resistance level is at around 7,900-7,950. On the other hand, the support level is at 7,800-7,850. The Nasdaq futures contract is way below its recent trading range, as we can see on the 15-minute chart:
(Click on image to enlarge)
Apple's Reversal?
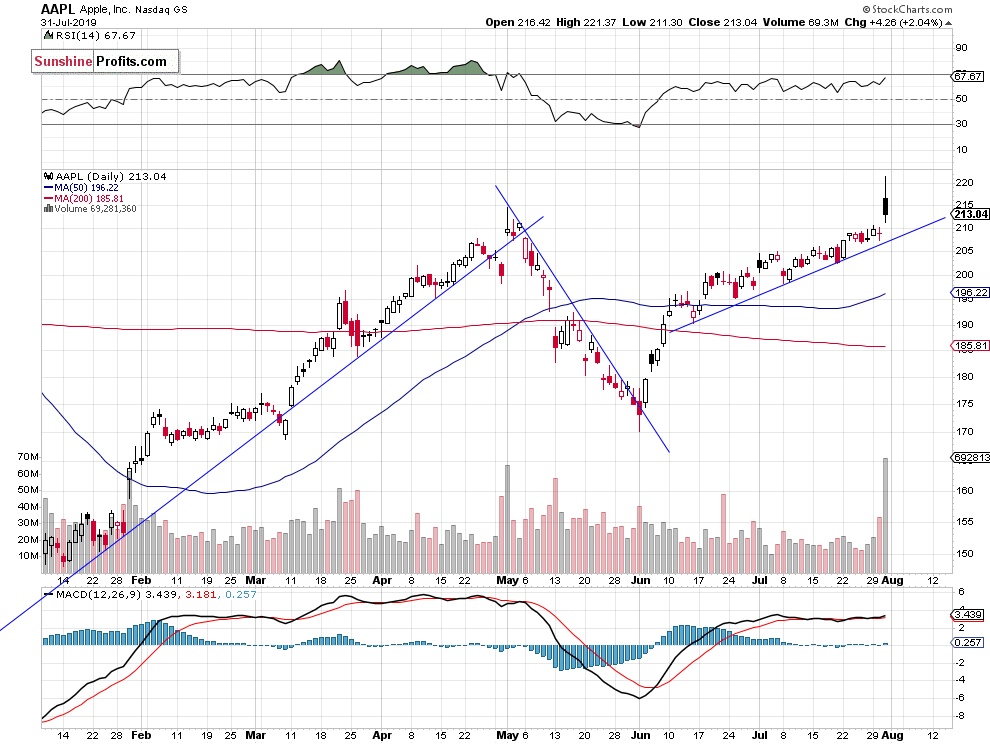
Let's take a look at the Apple, Inc. stock (AAPL) daily chart (chart courtesy of http://stockcharts.com). The stock continued to trade at the resistance level of $210-215 recently. It was the highest since the early May on Monday. But it broke higher following Tuesday's quarterly earnings release. However, we can see a short-term topping pattern here:
(Click on image to enlarge)
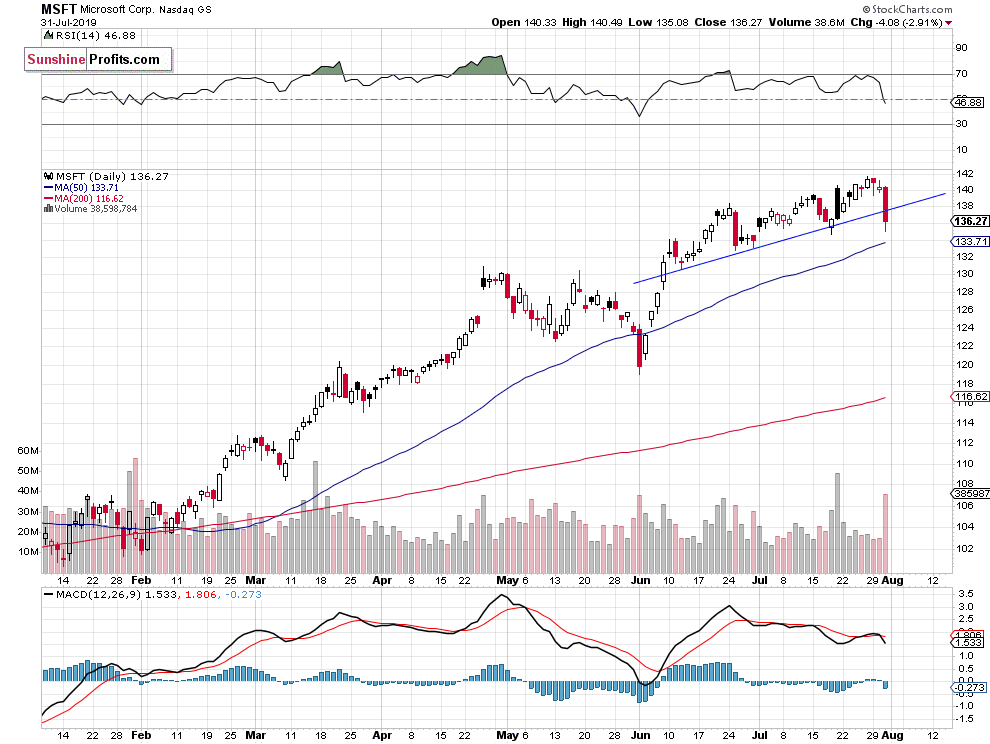
Now let's take a look at the daily chart of Microsoft Corp. stock (MSFT). The stock reached the new record high of $141.68 on Friday following the recent quarterly earnings release. But yesterday it retraced most of the recent advance and it broke slightly below the two-month-long upward trend line. Is this a new downtrend? For now, it looks like a medium-term consolidation:
(Click on image to enlarge)
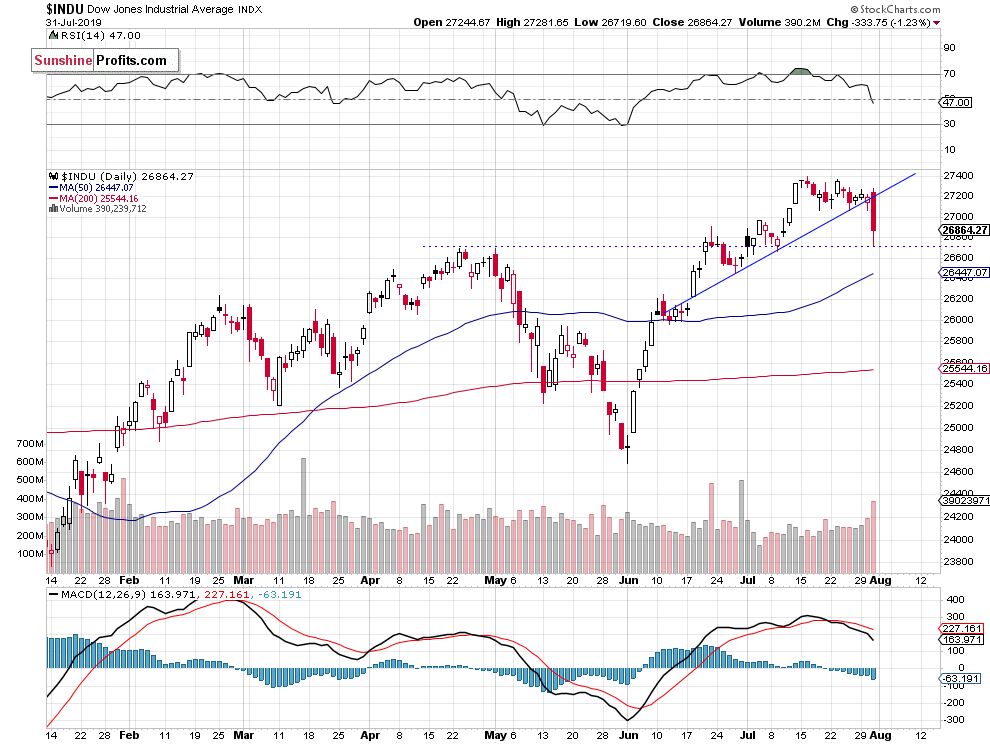
Dow Jones Broke Below the Trend Line
The Dow Jones Industrial Average broke below its upward trend line on Wednesday. So the recent consolidation was a topping pattern. However, the market bounced off its previous medium-term high yesterday. Is the decline over? There have been no confirmed positive signals so far:
(Click on image to enlarge)
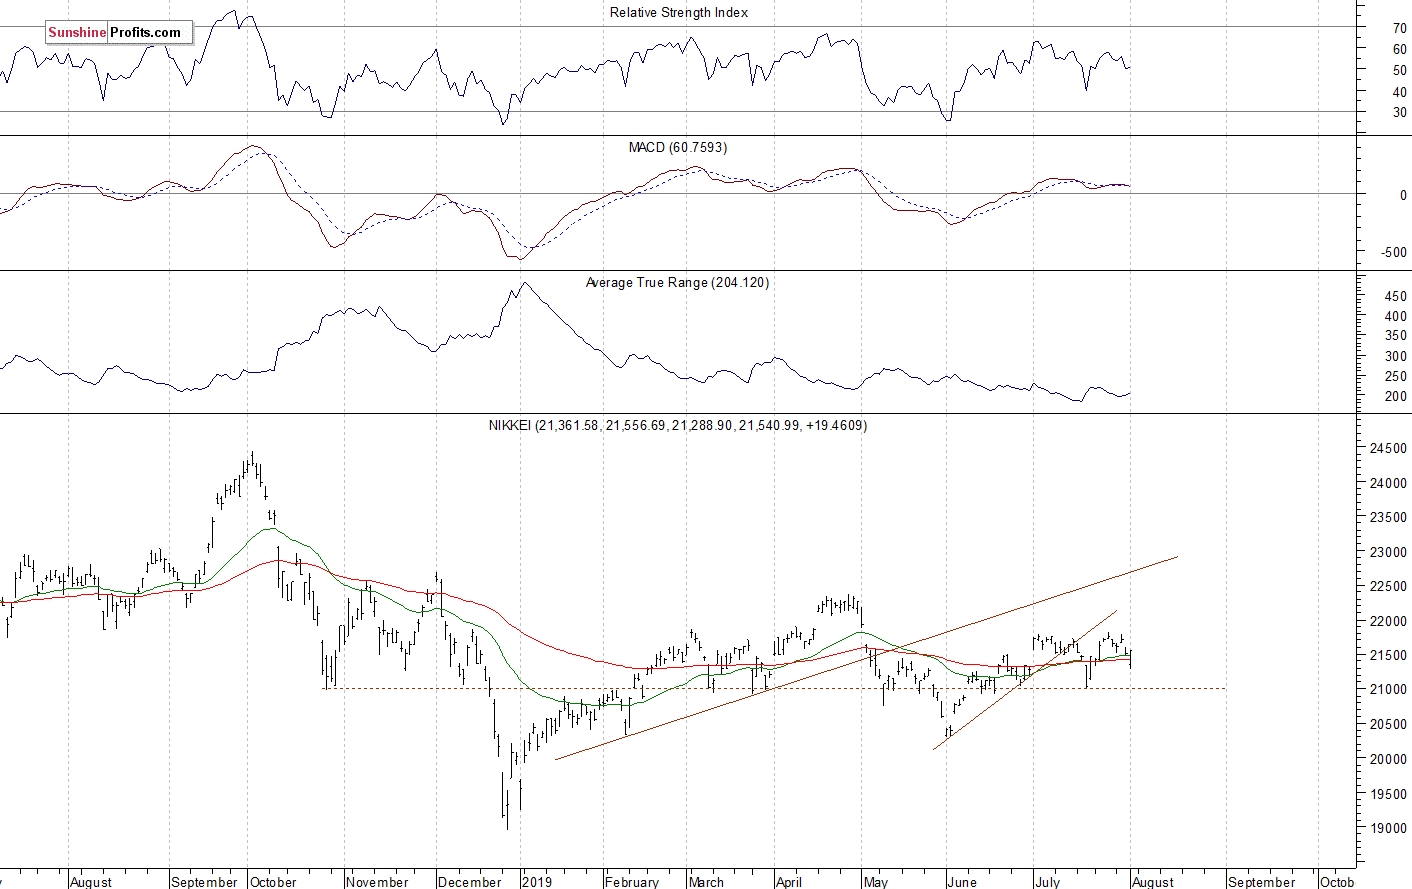
Nikkei Keeps Going Sideways
Let's take a look at the Japanese Nikkei 225 index. It broke below the over month-long upward trend line recently and then it bounced off the 21,000 mark again. The market extends its half-year-long consolidation:
(Click on image to enlarge)
The S&P 500 index broke below the upward trend line yesterday, as investors reacted to the Fed's Rate Decision release. We saw technical overbought conditions along with negative technical divergences recently. And the market turned lower. But is this a new downtrend or just another downward correction within a medium-term uptrend? For now, it looks like a downward correction. However, if the index gest back below the early May local high, we could see more selling pressure.
Concluding, the S&P 500 index will likely open slightly higher today. The market may retrace some of its yesterday's decline. However, it may be hard to reverse the negative effect of the post-Fed decline.
Disclosure: None.


