
Stocks Find Blue Skies While Economy Deals With Inclement
Facing formidable resistance and the threat of an ominous triple-top sell signal if bulls lost their battle, U.S. stocks appear to have successfully navigated a critical crossroads by finding the wherewithal to break out to new highs, with blue skies above. Among the ten U.S. business sectors, the performance leaders last week were Consumer Services, Consumer Goods, Industrial, and Financial. Now the question is whether stocks can confirm the nascent breakout in the face of yet another new crop of global and domestic challenges. “Inclement weather” has been both real and metaphorical, and both are impacting the economy.
Internationally, China just reported that their official non-manufacturing (i.e., services) PMI rose to 55.0, which should help alleviate some of the concern about an economic slowdown there. However, after conducting a successful Winter Olympics while preventing a devastating terrorist incident, Russian President Putin has now turned Ukraine’s internal struggle over their future direction into a major international incident. Secretary of State Kerry said that the G8 countries were prepared to isolate Russia economically, including bans of travel visas, freezes on assets, and limitations on trade.
Domestically, the severe weather that has hamstrung much of the country for months has now sucked final holdout California into the maelstrom, with torrential rains and mudslides -- as well as powerful waves that did a good bit of damage to some of the popular beachside restaurants here in Santa Barbara.
However, as spring emerges and the clouds clear, there will be a lot of catching up to do, particularly in the housing industry, which bodes well for GDP growth. Also, the Fed remains accommodative, and in fact, with inflation still exceedingly (and for the Fed, uncomfortably) low, there’s a chance further tapering might be slowed until the economy shows it is indeed ready to roll post-winter. Note that Treasury yields continue to fall.
Furthermore, short interest remains high, which has been consistently supportive of the bull market so far. It is reflective of a cautious market that is hedged for downside. Market breadth has been strong. Corporate profits, stock buybacks, and M&A activity are robust, and cash is plentiful. On the other hand, revenue growth and hiring is still slow, stock buybacks don’t boost GDP, and much of the M&A is for intellectual property with uncertain payout -- witness the Facebook (FB) purchase of WhatsApp.
The CBOE Market Volatility Index (VIX), a.k.a. “fear gauge,” closed Friday at 14.00. It is way down from the 21+ levels it hit during the extreme market turbulence in early February, yet still above the low levels commonly hit last year, i.e., it has room to fall further. Although most market commentators expect increased volatility this year, the low level of fear has been bullish for stocks. However, if you look at a chart of the VIX, it is in a neutral triangle pattern that soon could break in either direction, but the oscillators are giving no indication which way that might be.
Overall, even if we get another pullback in the market, I think the path of least resistance for the foreseeable future is still up.
SPY chart review:
The SPDR S&P 500 Trust (SPY) closed Friday at 186.29, and its chart is looking quite bullish after breaking through tough resistance at the 185 level, averting a dreaded triple-top. The 20-day simple moving average is about to cross back upward through the 50-day SMA. Bollinger Bands are spreading apart again. Oscillators RSI, MACD, and Slow Stochastic are all looking strong and prepared to support further upside. Also, the Russell 2000 small cap index broke back above its long-standing uptrend line (which more recently had been serving as overhead resistance), and it too is back inside the bullish rising channel. There are no guarantees, of course, especially with so many external events continually whipping up new worries, but those blue skies above are sure inviting.
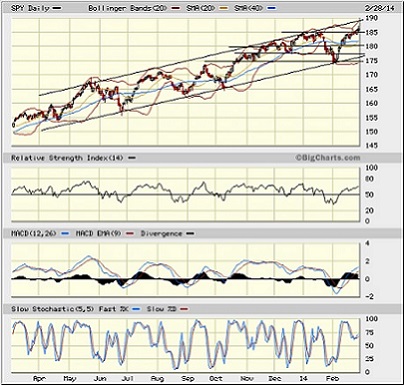
On the other hand, the nascent breakout is fragile. If something does manage to bring out the bears (like military escalation in Ukraine, for instance), there are many support points, including resistance-turned-support at 185, the 20-day and 50-day SMAs (currently near 182), round-number support at 180, the 100-day SMA near 179, prior support at 177.50, the bottom of the rising channel (currently near 176), prior strong support at 175, and then the 200-day SMA (currently near 173).
Latest sector rankings:
Relative sector rankings are based on Sabrient’s proprietary SectorCast model, which builds a composite profile of each equity ETF based on bottom-up aggregate scoring of the constituent stocks. The “Outlook Score” employs a forward-looking, fundamentals-based multifactor algorithm considering forward valuation, historical and projected earnings growth, the dynamics of Wall Street analysts’ consensus earnings estimates and recent revisions (up or down), quality and sustainability of reported earnings (forensic accounting score), and various return ratios. It helps us predict relative performance over the next 1-3 months.
In addition, SectorCast computes Sabrient's Bull Score and Bear Score for each ETF based on recent price behavior of the constituent stocks on particularly strong and weak market days. High Bull score indicates that stocks within the ETF have tended recently toward relative outperformance when the market is strong, while a high Bear score indicates that stocks within the ETF have tended to hold up relatively well (“safe havens”) when the market is weak.
Outlook Score is forward-looking while Bull and Bear are backward-looking. As a group, these three scores can be helpful for positioning a portfolio for a given set of anticipated market conditions. Of course, each ETF holds a unique portfolio of stocks and position weights, so the sectors represented will score differently depending upon which set of ETFs is used. For Sector Detector, I use the iShares that represent the ten major U.S. business sectors: Financial, Technology, Industrial, Healthcare, Consumer Goods, Consumer Services, Energy, Basic Materials, Telecom, and Utilities. Whereas the Select Sector SPDRs only contain stocks from the S&P 500, I prefer the iShares for their larger universe and broader diversity. Fidelity also offers a group of sector ETFs with an even larger number of constituents in each.
Here are some of my observations on this week’s scores:
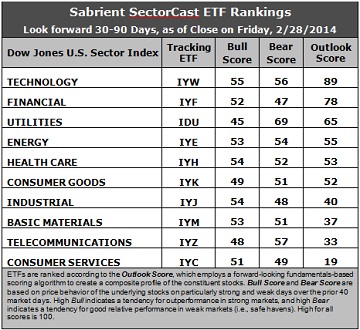
1. Technology (IYW) retakes the top spot with a strong Outlook score of 89, followed by Financial (IYF) at 78, as these two sectors continue to dominate the top of the rankings. Technology has consistently displayed solid factor scores across the board, with a strong forward long-term growth rate, a relatively low forward P/E, the highest return ratios, and excellent sentiment among Wall Street’s sell-side analysts (net positive revisions to forward earnings estimates) and company insiders (open market buying). The Financial sector displays one of the lowest (best) forward P/Es and decent sentiment among both sell-side analysts and company insiders. Moving into third place this week is Utilities (IDU) with a 25-point jump to 65, mostly due to a sudden increase in forward estimates and insider buying. It is followed by Energy (IYE) and Healthcare (IYH). Energy continues to rise in the rankings, scoring 55 this week as sentiment continues to improve among both sell-side analysts and insiders. Healthcare has slipped to fifth but still scores above 50.
2. Consumer Services (IYC) remains in the cellar with an Outlook score of 19, as Telecommunications (IYZ) scores a 33 to further widen its distance above the bottom. Consumer Services, a.k.a., consumer cyclicals or consumer discretionary, continues to boast the best forward long-term growth rate, but this is more than offset by a relatively high forward P/E and weak sentiment among both Wall Street analysts (net negative revisions to earnings estimates) and company insiders (low buying activity). Telecom continues to score among the lowest on most of the factors in the model, including the highest (worst) forward P/E, lowest return ratios, and a low projected long-term growth rate. However, the long-term growth rate has gone up as Wall Street analysts have been revising upwards, and sentiment among insiders (buying activity) has improved, as well.
3. These fundamentals-based rankings still reflect a mostly bullish bias. Economically-sensitive sectors Tech and Financial remain at the top and six of the ten sectors are scoring above 50. Although the rise in Utilities might be considered somewhat bearish, the sudden jump in analyst net revisions might be a one-week blip. However, it is concerning to see the continued gradual decline in the Outlooks scores for Industrial and Consumer Services.
4. Looking at the Bull scores, Technology remains the leader on strong market days, scoring 55, while Utilities (IDU) is the laggard with a score of 45. The top-bottom spread remains at 10 points, reflecting moderately high sector correlations on particularly strong market days. It is generally preferably in a healthy market to see the top-bottom spread approach 20 points.
5. Looking at the Bear scores, Utilities scores a 69, giving a clear indication that stocks within this sector are the preferred “safe haven” on recent weak market days. Financial scores the lowest with a 47. The top-bottom spread is now a robust 22 points, reflecting low sector correlations on weak market days, which is a good sign for a healthy market.
6. Overall, Technology displays by far the best all-weather combination of Outlook/Bull/Bear scores, while Consumer Services is the worst. Looking at just the Bull/Bear combination, Utilities holds the lead, indicating excellent relative performance (on average) in extreme market conditions, and Technology is a close second. Financial scores the lowest, indicating investor avoidance (relatively speaking) during extreme conditions.
These Outlook scores represent the view once again that Technology and Financial sectors are relatively undervalued, while Consumer Services and Telecom may be relatively overvalued based on our 1-3 month forward look.
Stock and ETF Ideas:
Our Sector Rotation Model, which appropriately weights Outlook, Bull, and Bear scores in accordance with the overall market’s prevailing trend (bullish, neutral, or bearish), suggests holding Technology (IYW), Financial (IYF), and Healthcare (IYH) in the current bullish climate. (The market climate remains bullish with the SPY above its 50 and 200-day simple moving averages.)
Other ETFs highly-ranked by Sabrient from the Technology, Financial, and Healthcare sectors include ProShares Ultra Technology (ROM), PowerShares Dynamic Financial Sector Portfolio (PFI), and Market Vectors Pharmaceutical ETF (PPH).
For an “enhanced” sector portfolio that employs top-ranked stocks (or options) from within the top-ranked sectors (instead of ETFs), some long ideas from Technology, Financial, and Healthcare sectors include Brocade Communications Systems (BRCD), Aspen Technology (AZPN), Redwood Trust (RWT), CYS Investments (CYS), CorVel Corp (CRVL), and Myriad Genetics (MYGN), all of which are ranked highly in the Sabrient Ratings Algorithm and score near the top of the Sabrient/Gradient Earnings Quality Rank (EQR), which is a pure accounting-based risk assessment signal based on the forensic accounting expertise of Sabrient subsidiary Gradient Analytics.
On the other hand, if you have a bearish outlook on the market, our Sector Rotation Model would suggest holding Utilities (IDU), Technology (IYW), and Energy (IYE) sector ETFs.
The author has no positions in stocks or ETFs mentioned. The materials available from us are published solely for informational purposes. They are not to be construed as advice or recommendations.


