
Stocks Continue To Rebound From Edge Of Abyss As Uncertainties Subside
Last week, stocks continued their rebound from the edge of the abyss. Investors responded positively to a dovish combination of comments from Speaker of the House John Boehner and new Federal Reserve Chairwoman Janet Yellen. Mr. Boehner said he would not pursue another acrimonious battle over the debt ceiling. And Ms. Yellen signaled that the Fed will do the “right thing” for the economy when it comes to appropriate liquidity and data-dependent accommodative policy.
Among the ten U.S. business sectors, the leaders last week were Materials, Energy, Utilities, Technology, Telecom, and Healthcare. Utilities and Healthcare are still the top performers so far in 2014, which isn’t a surprise given that most of the major market averages are still in the red (with the exception of the NASDAQ Composite), but Technology also is now safely positive year-to-date by more than +2%. The other seven sectors are still negative.
Rather than the rapidly rising long-term interest rates that everyone feared was the imminent impact of Fed tapering, the risk appears to be to the downside for yields, at least in the near term. It seems that the secular bear market in fixed income is not quite ready to launch after all, and both equities and bonds are seeing capital inflows, just like they did before the Fed announced its tapering plan.
Corporate earnings have been looking passable, although definitely not stellar. Certainly one positive driver for U.S. firms has been the weak dollar. Other positive developments for global economic recovery include news that Chinese banks disbursed the highest monthly volume of loans in four years, upbeat economic data in the Eurozone, plus new political initiatives in Italy to form a new government coalition that might be able to address its severe economic malaise.
Furthermore, there remains a general lack of euphoria, if not outright pessimism, during this bullish recovery. Short interest on S&P 500 stocks remains near 3-year highs, individual investors are still largely underinvested in equities, and prominent Wall Street investment strategists are predicting only modest gains in 2014. In other words, there is plenty of potential fuel on the sidelines that could power further stock market gains.
Last week I spoke of the market approaching a crossroads that would likely culminate in either a bullish breakout or a bearish reversal back down to test the 200-day SMA and perhaps an even deeper correction. Well, the market now finds itself at that crossroads as we enter the holiday-shortened week. I remain optimistic, and one reason is that there is really no attractive investment alternative to equities for total return. The path of least resistance is up.
SPY chart review:
The SPDR S&P 500 Trust (SPY) closed Friday at 184.02, which is back within spittin’ distance of its all-time high of 184.94. The bullish reversal last Wednesday from its 12-month uptrend line seems to have confirmed. However, the Russell 2000 small caps, which had endured a serious violation of a similar 12-month uptrend support line, has recovered back up to that line, and is now dealing with it as overhead resistance. Nevertheless, all markets have staged an impressive comeback from the edge of the abyss. The SPY has blasted back through potential lines of support-turned-resistance at 177.50 and 180. In fact, I have drawn what in retrospect might have been a bull flag pattern.
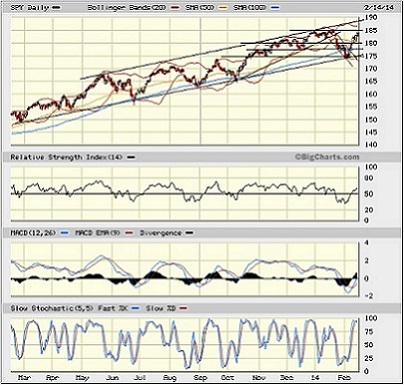
Although the 20-day simple moving average had crossed down bearishly through the 50-day, SPY has now retaken both moving averages and has its sights set on strong resistance at the 185 level. Oscillators RSI and Slow Stochastic bounced nicely from oversold territory and are now approaching short-term overbought; however, MACD just crossed over into a new buy signal.
Again, as we enter the holiday-shortened week, I think the market now finds itself at a crossroads that will likely culminate in either a bullish breakout or a bearish reversal back down to test the 200-day SMA. We will soon see how it deals with this resistance level.
On Friday, the CBOE Market Volatility Index (VIX), a.k.a. “fear gauge,” closed at 13.57, as it continues to fall after briefly spiking above 21 during the market turbulence. I described last week the indications of panic, including both the high levels in VIX spot price and the backwardation in VIX futures, that almost always precede a market bounce. For the moment, all is calm again in VIX-land.
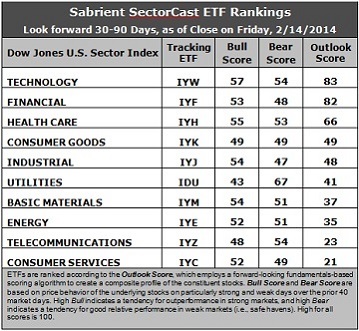
Latest sector rankings:
Relative sector rankings are based on Sabrient’s proprietary SectorCast model, which builds a composite profile of each equity ETF based on bottom-up aggregate scoring of the constituent stocks. The “Outlook Score” employs a forward-looking, fundamentals-based multifactor algorithm considering forward valuation, historical and projected earnings growth, the dynamics of Wall Street analysts’ consensus earnings estimates and recent revisions (up or down), quality and sustainability of reported earnings (forensic accounting score), and various return ratios. It helps us predict relative performance over the next 1-3 months.
In addition, SectorCast computes Sabrient's Bull Score and Bear Score for each ETF based on recent price behavior of the constituent stocks on particularly strong and weak market days. High Bull score indicates that stocks within the ETF have tended recently toward relative outperformance when the market is strong, while a high Bear score indicates that stocks within the ETF have tended to hold up relatively well (“safe havens”) when the market is weak.
Outlook Score is forward-looking while Bull and Bear are backward-looking. As a group, these three scores can be helpful for positioning a portfolio for a given set of anticipated market conditions. Of course, each ETF holds a unique portfolio of stocks and position weights, so the sectors represented will score differently depending upon which set of ETFs is used. For Sector Detector, I use the iShares that represent the ten major U.S. business sectors: Financial, Technology, Industrial, Healthcare, Consumer Goods, Consumer Services, Energy, Basic Materials, Telecom, and Utilities. Whereas the Select Sector SPDRs only contain stocks from the S&P 500, I prefer the iShares for their larger universe and broader diversity.
Here are some of my observations on this week’s scores:
1. Technology (IYW) has moved back into the top spot with an Outlook score of 83, with Financial (IYF) close behind at 82. Technology has consistently displayed solid factor scores across the board, with a strong forward long-term growth rate, a relatively low forward P/E, the highest return ratios, and excellent sentiment among Wall Street’s sell-side analysts (net revisions to forward earnings estimates) -- in fact, Tech is the only sector currently displaying net positive sentiment. The Financial sector displays one of the lowest (best) forward P/Es and notably strong sentiment among both sell-side analysts and company insiders (buying activity). In third place again this week is Healthcare (IYH), followed by Consumer Goods (IYK) and Industrial (IYJ).
2. Consumer Services (IYC) remains at the bottom with an Outlook score of 21, with Telecommunications (IYZ) scoring only slightly higher at 23. Consumer Services, a.k.a., consumer cyclicals or consumer discretionary, continues to boast the best forward long-term growth rate, but this is more than offset by a continued weakening in sentiment among both Wall Street analysts (net negative revisions to earnings estimates) and company insiders (low buying activity). Telecom continues to score among the lowest on most of the factors in the model, including the highest (worst) forward P/E, lowest return ratios, and a low projected long-term growth rate. Although analysts have been reducing forward earnings estimates across the board during this earnings season, stocks within Energy and Materials have been getting hammered the worst, followed by the Consumer sectors.
3. Although these fundamentals-based rankings still reflect a mostly bullish bias, with economically-sensitive sectors at the top, I am concerned about the rash of sell-side reductions to corporate earnings estimates, and that only three sectors have Outlook scores above 50.
4. Looking at the Bull scores, Technology has emerged as the leader on strong market days, scoring 57, while Utilities (IDU) is the laggard with a score of 43. The top-bottom spread is 14 points, reflecting fairly low sector correlations on particularly strong market days, which is a good sign for a healthy market. Nevertheless, I would prefer to see the top-bottom spread approach 20 points.
5. Looking at the Bear scores, Utilities again displays a 67, which indicates that it has been holding up the best (“safe haven”) on recent weak market days. As a traditionally defensive sector, this makes sense. Industrial scores the lowest with a 47. The top-bottom spread is 20 points, which reflects low sector correlations on weak market days, which is a good sign for a healthy market.
6. Overall, Technology displays the best all-weather combination of Outlook/Bull/Bear scores, while Consumer Services is the worst. Looking at just the Bull/Bear combination, Technology holds the lead, indicating excellent relative performance in extreme market conditions (whether bullish or bearish), while Consumer Goods scores the lowest, indicating investor avoidance (relatively speaking) during extreme conditions.
These Outlook scores represent the view once again that Technology and Financial sectors are relatively undervalued, while Consumer Services and Telecom may be relatively overvalued based on our 1-3 month forward look.
Stock and ETF Ideas:
Our Sector Rotation Model, which appropriately weights Outlook, Bull, and Bear scores in accordance with the overall market’s prevailing trend (bullish, neutral, or bearish), suggests holding Technology (IYW), Financial (IYF), and Healthcare (IYH) in the current bullish climate. (The trend moved back to bullish with the SPY above its 50 and 200-day simple moving averages.)
Other ETFs highly-ranked by Sabrient from the Technology, Financial, and Healthcare sectors include Technology Select Sector SPDR (XLK), Market Vectors Bank and Brokerage ETF (RKH), and Market Vectors Pharmaceutical ETF (PPH).
For an “enhanced” sector portfolio that employs top-ranked stocks (or options) from within the top-ranked sectors (instead of ETFs), some long ideas from Technology, Financial, and Healthcare sectors include VMWare (VMW), NXP Semiconductors NV (NXPI), SVB Financial Group (SIVB), Signature Bank (SBNY), Allergan (AGN), and Jazz Pharmaceuticals (JAZZ), all of which are ranked highly in the Sabrient Ratings Algorithm and score near the top of the Sabrient/Gradient Earnings Quality Rank (EQR), which is a pure accounting-based risk assessment signal based on the forensic accounting expertise of Sabrient subsidiary Gradient Analytics.
Two of the stocks mentioned above, NXPI and JAZZ, were top performers in last year’s Sabrient “Baker’s Dozen” portfolio of top GARP stocks (growth at reasonable price) for 2013, and both stocks are also members of our 2014 portfolio that was unveiled last month. The 2013 portfolio doubled the S&P 500 return, with all 13 positions comfortably positive by double-digit percentages. Notably, for the past two years, our annual portfolio has endured none of the upsetting meltdowns that can offset the strong performers, and we largely attribute this to our Earnings Quality Rank (EQR) as a screening and scoring factor in the multifactor quant model.
The author has no positions in stocks or ETFs mentioned. The materials available from us are published solely for informational purposes. They are not to be construed as advice or recommendations.


