
Stock Performance Following Six Straight Weeks Of Gains In Q4
GLOOMY MANUFACTURING SURVEY FOLLOWED BY GAINS
In early October, a weak ISM Manufacturing Survey was followed by talk of an imminent recession. A factual analysis of similar drops in the manufacturing survey told us to keep an open mind about better than expected outcomes. The market responded with six consecutive weeks of gains (see chart below).
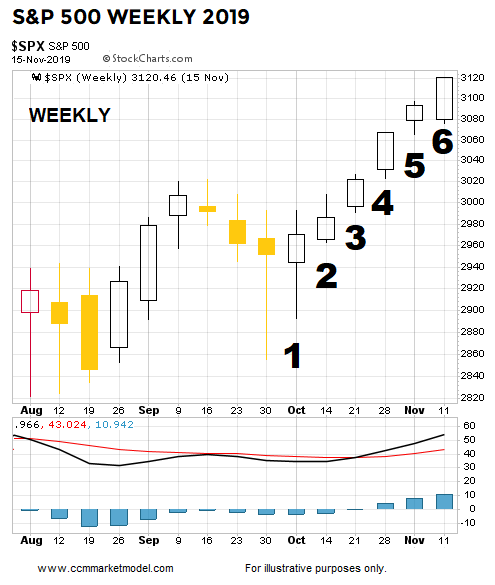
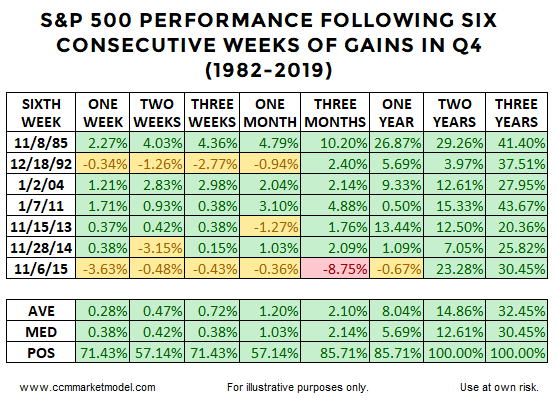
Given Q4 and Q1 offer some of the more favorable seasonal tailwinds, we wondered how stocks have performed in the past following a period of six consecutive weekly gains in the S&P 500. We looked for cases where the six-week streak began in the fourth quarter. As shown in the table below, stocks were higher one year later in 86% of the cases posting an average gain of 8%. Two and five years later, the S&P 500 was higher in every case. The yellow and red portions of the table remind us to have realistic expectations about normal volatility over the next three months.
MAJOR BOTTOM OR MAJOR TOP?
With many calling for stocks to peak soon, it is easy to forget the S&P 500 recently dropped almost 20%. Therefore, rather than assuming a major peak is coming soon, it is logical to ask:
Is there any factual basis to believe December 2018 marked a major stock market low?


