
Stock Market Crosscurrents
MANY WEEKLY CHARTS LOOK CONSTRUCTIVE
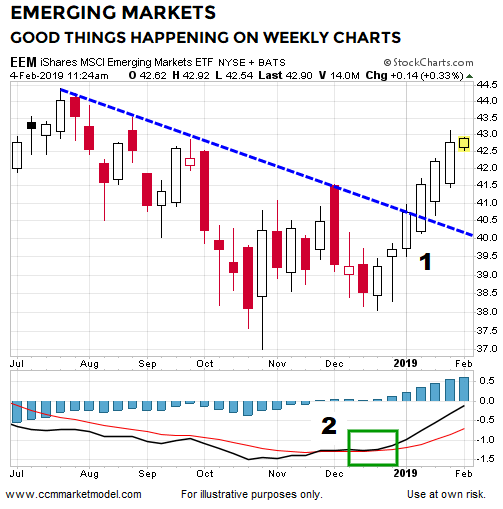
A very substantial number of growth-oriented weekly charts have three similar and bullish characteristics:
- A break of downward-sloping trendlines.
- MACD cross showing improving momentum.
- Similar look to 2016 bottoming process.
The weekly chart of emerging markets (EEM) is one example of the widespread “we should be open to adding to the growth side of the portfolio in the coming days/weeks” look.
(Click on image to enlarge)
WEAKER OR STRONGER THAN 2016?
As numerous historical examples illustrate, when markets try to rally from a very weak trend profile, bottoms are typically a give-and-take process that occurs over several weeks or months. Momentum is one thing; trends are another.
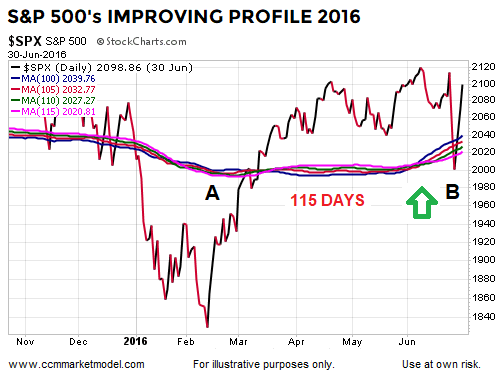
The 2016 S&P 500 chart below shows generic daily moving averages to illustrate basic concepts. Notice how it takes time for the moving averages to turn from a concerning look (far left side below) to a more constructive look (far right below). The S&P 500 rallied sharply off the February 2016 low and momentum improved significantly. However, 115 days of gains were fully retraced before the longer-to-intermediate-term moving averages turned up near point B.
(Click on image to enlarge)

In 2019, the S&P 500 is 27 trading days removed from the December 2018 low. The S&P 500 ETF (SPY) chart below shows the look of the same moving averages near the low (red box) and 27 trading days after the low (blue arrow). Thus far, SPY’s moving averages do not even have the early stages of a “trying to flip back to a bullish trend” look.
(Click on image to enlarge)
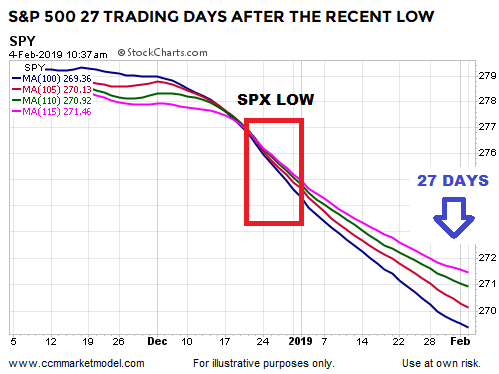
Since numerous 2019 weekly charts have a similar bullish look to what was seen near the 2016 S&P 500 lows, it might be helpful to understand how the trends looked 27 trading days after the 2016 low. Notice how the moving averages had a flattish/bottoming look literally days after the S&P 500 low. Bullish moving average crossovers were present 27 trading days after the low. None of those improving characteristics are evident yet on the 2019 chart above.
(Click on image to enlarge)
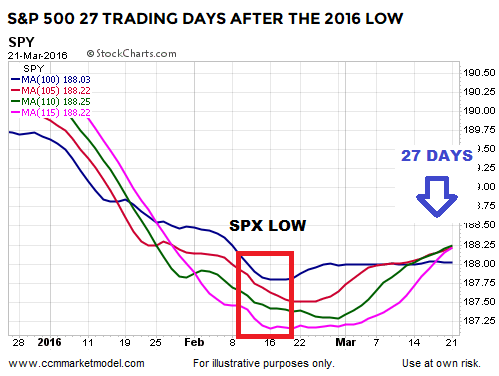
We should also keep in mind, the trend off the 2016 low was stronger than present-day trends, and even with the more constructive profile, stocks ended up retracing 115 days worth of gains in 2016 before resuming the bullish trend. Our purpose is not to forecast any outcome in 2019, but rather to highlight the uncertainties associated with weak market profiles.
ASSET CLASS BEHAVIOR
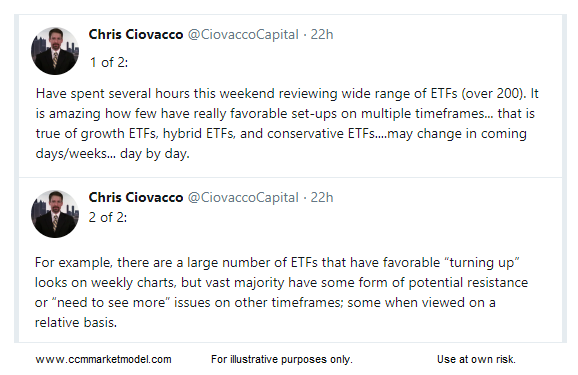
The broad array of ETFs we currently hold, along with a substantial cash position, reflect the market’s current mixed state, which was noted via the tweets below:
(Click on image to enlarge)
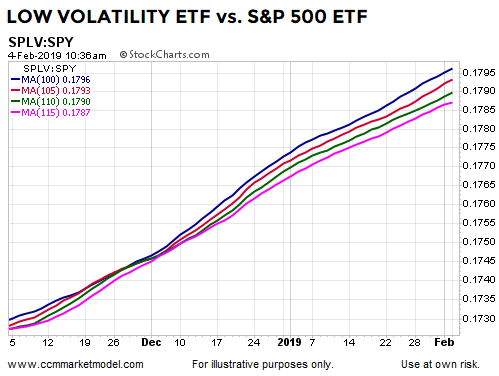
The S&P 500 Low-Volatility ETF (SPLV) overweights more defensive-oriented sectors. The chart of SPLV relative to SPY looks quite a bit better than the SPY chart in isolation. Two weeks ago, SPLV beat SPY by 0.57%. Last week SPLV beat SPY by 0.87%. The chart below may roll over soon, but right now we have not even seen much in terms of change.
(Click on image to enlarge)
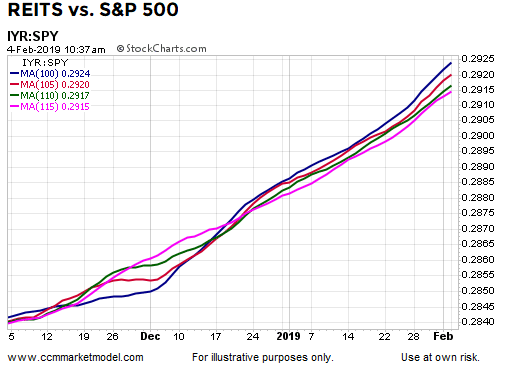
Even after the big rally off the December 2018 lows, many of the leading ETFs still have a defensive/income bias, including REITS.
(Click on image to enlarge)
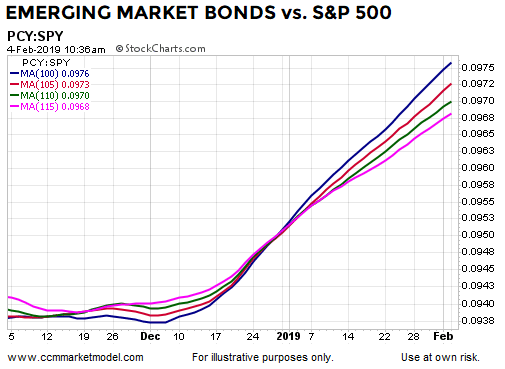
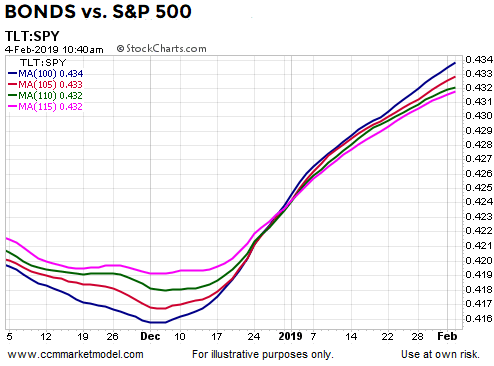
The strength in emerging market bonds (PCY) is due, in part, to the market’s expectation the Fed is done or nearly done raising interest rates.
(Click on image to enlarge)
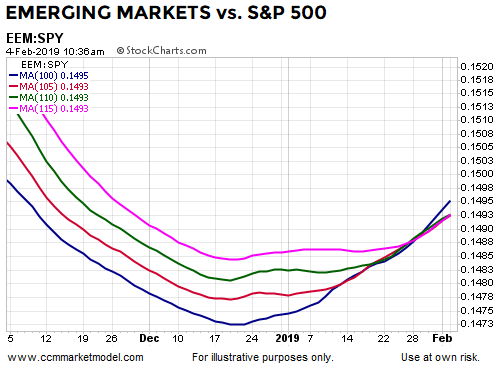
The “turning up” look on the chart of emerging market stocks relative to the S&P 500 also reflects shifting expectations relative to the Federal Reserve.
(Click on image to enlarge)
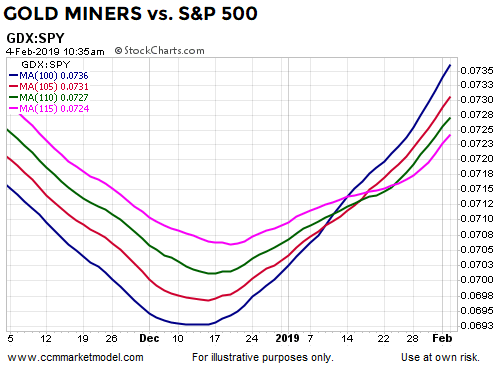
Fed actions also impact expectations related to a weaker U.S. dollar, which can be a driving force behind increasing relative demand for gold-mining stocks (GDX).
(Click on image to enlarge)
MIXED CONVICTION MARKET
The market’s profile and the still mixed messages coming from asset class behavior do not allow for high conviction regarding any option at this stage, which is reflected by (a) the small % stakes in each of our positions and (b) the high cash position we still hold. On the other end of the spectrum, the data in hand does not warrant a 100% cash position.
As the data evolves, some additional clarity should emerge, allowing us to add to the successful positions and trim any laggards in the coming days, weeks, and months.
Today’s profile is weaker than at a similar point following the February 2016 low. Many of the initial 2016 “rush to get in” gains were fully retraced months down the road.
(Click on image to enlarge)
A common question might be, “doesn’t Brexit skew the 2016 case?” The answer is no; the market was pricing in expectations for all events in 2016, just as it is pricing in expectations for all future events in 2019. It is quite possible we will not know the reasons for the still-weak profile in 2019 for many months; it may be that economic data will begin to deteriorate noticeably between now and spring. All TBD.
(Click on image to enlarge)

MANY REASONS TO BE BULLISH
In addition to the improving momentum look on a substantial number of growth-oriented weekly charts, this week’s video covers numerous data points telling us to remain open to better than expected outcomes in the days, weeks, and months ahead.
Bullish and bearish crosscurrents have a way of working themselves out over time for those that can remain patient and proceed at a prudent, measured, and data-dependent pace. For now, we have some still-concerning data points…
(Click on image to enlarge)
…and some very bullish and encouraging data points. Emerging markets were one of the first markets to seriously roll over in 2018; it is possible they are trying to lead again but in a more constructive manner. All TBD.
(Click on image to enlarge)

Disclaimer: The opinions in this document are for informational and educational purposes only and should not be construed as a recommendation to buy or sell the stocks mentioned or to solicit ...
more

