
Stock Bulls Shake Off Worries About Mounting Global Dangers
As expected, August brought more volatility. Early in the month, the large cap, mid cap, and small cap indices all set new all-time closing highs while the CBOE Volatility Index (VIX) hit an all-time low. But then tough resistance levels failed to yield, the expected late-summer volatility set in, and support levels were tested. Nevertheless, the intra-month swoon (3% on the S&P 500) turned into a buying opportunity for the bulls, and by month-end the S&P 500 managed to eke out a small gain, giving it five straight positive months. Then the market started the month of September with a particularly strong day to put those all-time highs once again within spittin’ distance…that is, until North Korea detonated a hydrogen bomb in its testing area, while massive hurricanes created havoc. But by this past Friday, bulls had recovered key support levels.
One can only wonder how strong our global economy would be if it weren’t for all the tin-pot dictators, jihadis, and cyberhackers that make us divert so much of our resources and attention. Nevertheless, prospects for the balance of 2H2017 still look good, even though solid economics and earnings reports have been countered by government dysfunction, catastrophic storms, escalating global dangers, and plenty of pessimistic talk about market conditions, valuations, and credit bubbles. Thus, while equities continue to meander higher on the backs of some mega-cap Tech sector darlings and cautious optimism among some investors, Treasuries are also rising (and yields falling) to levels not seen since before the election in a flight to safety among other investors.
In this periodic update, I give my view of the current market environment, offer a technical analysis of the S&P 500 chart, review Sabrient’s weekly fundamentals-based SectorCast rankings of the ten U.S. business sectors, and then offer up some actionable ETF trading ideas. In summary, although September historically has been the weakest month of the year, our sector rankings still look moderately bullish, while the sector rotation model has managed to maintain its bullish bias, and overall the climate still seems favorable for risk assets like equities. Read on....
Market overview:
So much to talk about these days. Where to start? There have been strong economic reports, with PMI Services, ISM Manufacturing, and ISM Non-Manufacturing all rising impressively. Corporate earnings season proved solid, with support from a weakening US dollar (especially helping the multinational firms). Copper, a key industrial metal that had been in a 5-year downtrend, has remained strong ever since the election. Consumer Sentiment is strong, as is jobs growth with unemployment at a low 4.3%. Real GDP growth in Q2 was revised at the end of August to an annualized rate of 3.0%, and the Atlanta Fed’s GDPNow predicts Q3 to come in at 3.0%, as well. But then there are distractions like North Korea detonating a hydrogen bomb, the temporary debt ceiling suspension (which may make it difficult to achieve both spending cuts and tax cuts in December), and Trump’s rescission of Obama’s DACA benevolent decree, choosing instead to force our 535 elected legislators to decide whether such important immigration policy should be the law of the land (although he will revisit it if they fail to decide). Such things distract from the bipartisan fashioning of important fiscal policies, e.g., tax cuts, regulatory reform, infrastructure spending, so as to broaden and strengthen this slow recovery before the next recession inevitably hits.
I could go on and on, but instead let’s just focus on the current market conditions and valuations.
Year-to-date through the end of August, the S&P 500 total return hit 11.9%, with 9 of the 10 major business sectors positive. As of Friday’s close, the SPDR S&P 500 Trust (SPY) was up +10.3%. Among sectors, using the 10 US sector iShares, the top-performer YTD through Friday is Technology, up +22.8%, followed by Healthcare at +20.1%, boosted by a sudden resurgence over the past couple of weeks in the biotech segment, while Energy is the worst at -15.5%, followed by Telecom at -12.5%. Utilities (+13.7%) also has been a steady performer this year as reliable cash flow and solid dividend yields have attracted income investors. Since the November presidential election, the S&P 500 is +15.1%; however, after an initial broad-based rally in the wake of the election, so far in 2017 its performance has been dominated by the mega-caps in a narrow, momentum-driven, low-volatility market.
This might sound obvious, but the best climate for a “healthy” stock market and for fundamentals-based GARP stock pickers (like Sabrient) is when fundamentals matter to investors, and when investors are aligned with the sell-side analyst community on where the growth opportunities lie (market segments and individual companies). This generally manifests in good market breadth, low sector correlations, and high performance dispersion among individual stocks, as investors pick their spots for investments in the best companies for solid growth at attractive prices. This is how the markets behaved late last year after the election uncertainty was lifted.
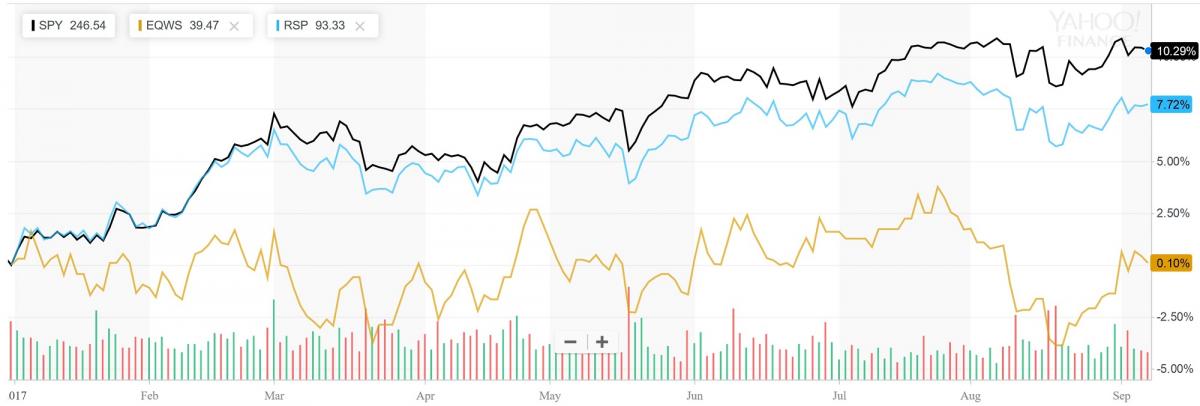
This year, however, although Sabrient’s January Baker’s Dozen is outperforming the S&P 500 (as of 9/8/17), the overall market has returned to more of that narrow, momentum-driven climate, led by the mega caps, similar to what we experienced in late 2015, which we would not look upon as healthy or sustainable. This largely has been driven by the preponderance of capital flows into passive products that are overwhelmingly cap-weighted. Below is a chart comparing the performance of the market-cap-weighted S&P 500 (SPY), the equal-weight S&P 500 (RSP), and the equal-weight Russell 2000 (EQWS) to illustrate the lack of breadth. The performance differentials are striking. Not only has the cap-weighted SPY (+10.3% YTD) diverged from the equal-weighted RSP (+7.7%), but the equal-weight small caps (EQWS) has badly underperformed so far this year (+0.1%). On an encouraging note, small caps greatly outperformed during the late-August rebound, along with other riskier segments like biotechs, e.g., the SPDR S&P Biotech ETF (XBI), and retail, e.g., the SPDR S&P Retail ETF(XRT).
Moreover, if you look at single-factor ETFs, the Momentum factor has been greatly outperforming fundamental factors like Value and Quality. None of this is indicative of fundamentals-based investing behavior! So, in my humble opinion, for there to be much more market appreciation from here, factors other than momentum will have to be rewarded and stocks outside of the Tech mega-caps will have to take the baton and assume leadership, including the mid and small caps and the transports. This may be facilitated by, for example, investors returning to active management or through multifactor ETFs.
And I think it is likely to happen. If you look at the US and global economies, fundamentals are solid, and stocks continue to be supported by a favorable environment comprising low inflation, low-interest rates, robust share buybacks and M&A, and continued organic growth in corporate earnings. Low inflation and interest rates means less discounting of future corporate earnings, which allows for higher enterprise values and stock prices. Buybacks and M&A mean lower outstanding float, which means reduced supply. Meanwhile, central bank largesse globally has created more investable capital, much of which pours into the many mutual funds, pension funds, endowments & foundations, insurance companies, ETFs, private equity, family offices, hedge funds, and sovereign wealth funds with mandates to invest in equities.
At least some fiscal stimulus may be priced into the analyst forward estimates that we find in our data feeds, so something in this realm will need to materialize. Fortunately, there already has been some movement in the regulatory area that has been helpful to businesses. And even without tax reform, year-over-year corporate EPS growth has been robust and should continue so, such that prices can still increase without further multiple expansion. Thus, we expect improving market breadth, with stronger participation from the small and mid caps, and a return to lower sector correlations and higher performance dispersion. Moreover, with a still-accommodative Federal Reserve and strong demand for bonds, the low-yield environment is likely to persist for the foreseeable future, so high-quality dividend payers should continue to attract capital, particularly given their potential for earnings growth leading to rising dividend payouts.
Speaking of the Fed, CME fed funds futures now place the odds of the next rate hike coming at the upcoming September meeting at zero (there’s actually a 4% chance of a rate cut), but it rises to 27% by December (down from 44% one month ago). Futures now indicate zero odds of seeing two further rate hikes this year. Those futures traders seem to believe that the Fed is between a rock and a hard place when it comes to the shape of the yield curve. With the 10-year Treasury closing Friday at 2.06%, the Fed moving too quickly on the fed funds rate would not only threaten economic recovery but also further flatten the yield curve. With global demand for Treasuries continuing to put downward pressure on longer-term rates, the Fed is all but certain to start unwinding its $4.5 trillion balance sheet later this month as planned, which may help offset some of that downward pressure on long-term rates. As it stands today, with the 2-year at 1.26%, the closely-watched 2-10 spread has fallen to 80 bps, which is still well under the 100 bps “normalcy” threshold and the 101 bps on Election Day, not to mention the relatively steep 136 bps spread achieved after the November election.
The CBOE Market Volatility Index (VIX), aka fear gauge, closed Friday at 12.12, as we continue to witness the lowest sustained volatility in 24 years. Even during August’s brief bout of heightened volatility, VIX spiked above the 15 fear level but never came close to the 20 panic level. I will continue to warn, however, that although complacency can persist for a long time, as an oscillator, VIX will eventually spike again.
As for valuations in the stock market, yes, the major cap-weighted market averages are on the high side relative to historicals. Many market commentators have been in a prolonged tizzy and warning of the inevitable selloff to come. Of course, anything is possible, but let’s think about this in its proper context, given stubbornly low inflation and interest rates. The trailing 12 months P/E ratio for the S&P 500 index currently sits at 23.6x (versus a long-term average of 15.1x). Flip it upside down and you get an earnings yield of 4.2% (versus the long-term average of 6.6%). Moreover, the Shiller 10-year trailing CAPE (cyclically-adjusted price/earnings ratio) is around 30x, which indicates an earnings yield of 3.3%. Looking ahead, the S&P 500 displays a forward P/E of 17.7x, indicating an earnings yield of 5.6%. Those earnings yields might look low on a historical basis, but when you consider today’s climate of low inflation and interest rates – with annualized core inflation around 1.7% and the 10-year yield around 2.1% – the earnings yields are still attractive on a relative basis. Okay, so what would an equivalent earnings yield of 2.1% imply for a P/E ratio? Try 47.6x, which is twice where we sit today. Do I expect such an expansion in the valuation multiple of the S&P 500? Certainly not. But it does help illustrate how a low-rate climate impacts relative valuations.
In any case, when we look beyond the fog created by the major cap-weighted indices to seek out compelling opportunities among the vast number of names below those mega-cap Tech darlings (e.g., FAAMG), we continue to find attractive forward valuations. But even those FAAMG stocks, which have been so important to the performance of “the market,” are actually much more reasonably priced today in terms of valuations, cash balances, free cash flow, and even their proportional representation within the broad indices, than they were back in 2000, before the dot-com bubble burst.
Most of you know that Sabrient now produces a Baker’s Dozen top picks list every month, rather than just once a year. This means that we can design each portfolio for a much lower asset capacity than we could with a single big annual portfolio, which means a lower liquidity threshold for eligibility, which means more eligible stocks, which means we can consider smaller high-growth companies that, for example, may be a supplier to Apple (AAPL) rather than having to select Apple itself, which means the potential for enhanced portfolio performance.
Overall, I think the signs are positive for equities, and only an inverted yield curve or a deterioration in corporate earnings would portend an end to the bulls’ party. Although there are of course worrisome (or downright frightening) matters everywhere you look, the good news is that the global economy is strengthening, the Fed and other central banks are taking pains not to screw things up on their paths to “normalization,” and as a successful Q2 earnings season winds down, a weaker dollar may lead to a better Q3 than is currently forecasted. But given the uncomfortably high valuations in some of the Tech mega-caps (e.g., FAAMG), it finally may be time for small and mid caps to take the baton and start to outperform – although admittedly their prospects are more difficult without the benefits of fiscal stimulus, especially tax and regulatory reform, which tend to offer greater advantages to smaller companies.
SPY chart review:
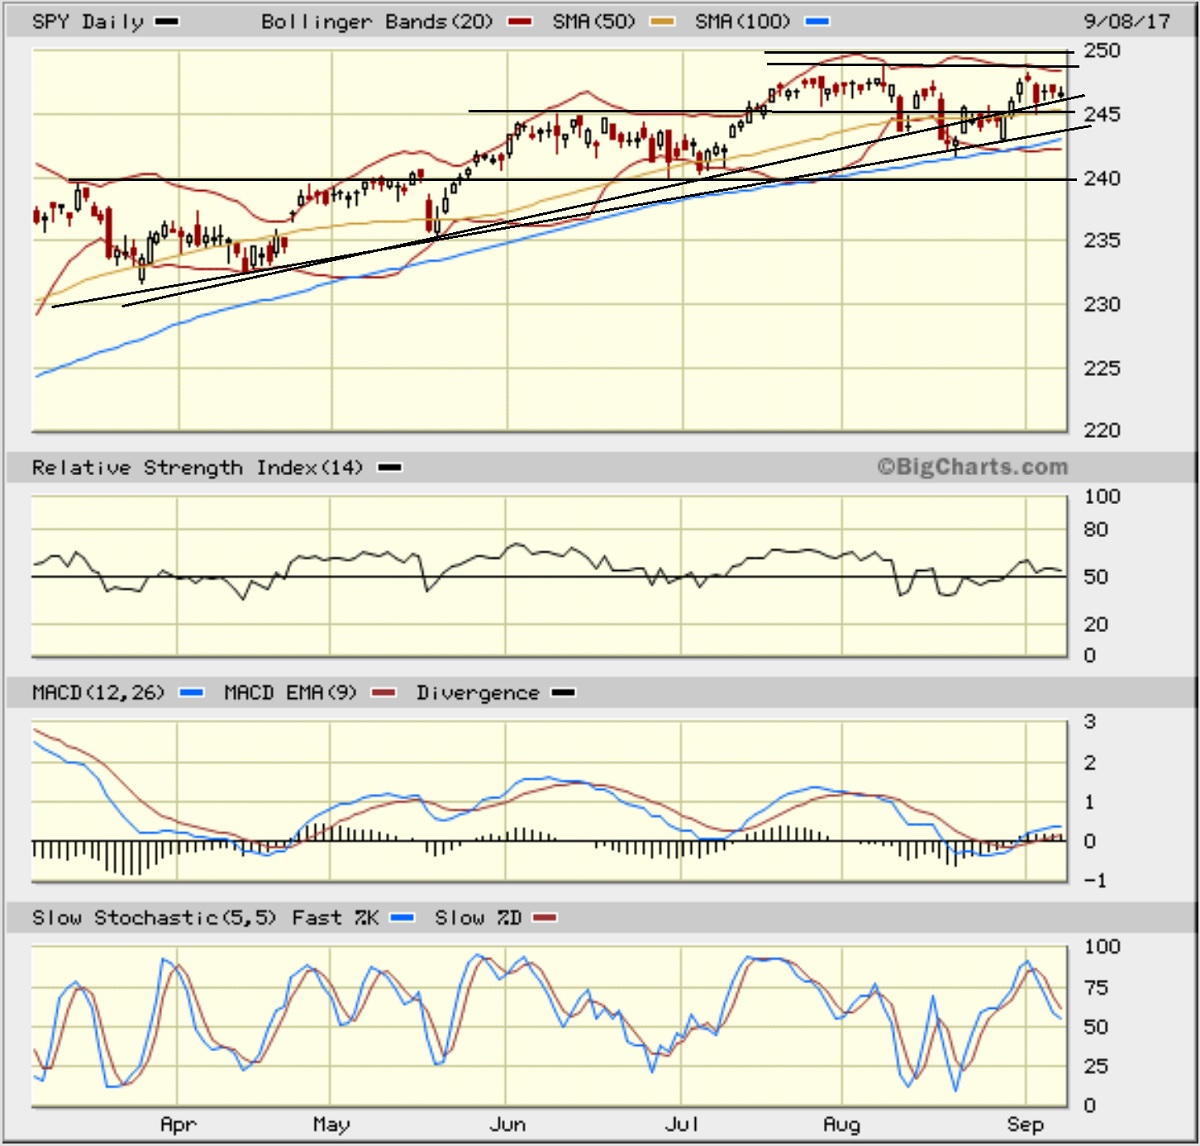
The SPDR S&P 500 ETF (SPY ) closed Friday at 246.58 and is still trying to gather sufficient bullish conviction to breach the 250 level (corresponding to 2,500 on the S&P 500). After breaking through tough psychological resistance at 240 (corresponding to 2,400 on the S&P 500 index) in late May, it went into a 6-week sideways channel before gathering bullish conviction to break through 245 in July, before the mild August swoon sent it back down to test support at the 100-day SMA (near 242 at that time). You can see on the chart how the Bollinger Bands have been pinching during consolidations and then spreading during breakouts or breakdowns. At the moment, it appears we are entering another consolidation phase after the August breakdown was thwarted by a bullish buy-the-dip effort. Oscillators RSI, MACD, and Slow Stochastic all in neutral positions and could move either way in the near term. The chart might be forming a bullish ascending triangle as the uptrend line gets closer to resistance levels. We will see how that develops. But in any case, I think we will see some further consolidation within the various support and resistance levels before a breakout attempt comes – hopefully in a sustainable way, i.e., with broad leadership, including small caps and other risk-on segments (indicating strong bullish conviction). Support levels include the convergence of the 50-day SMA with breakout resistance-turned-support at 245, one potential rising trend line around 246 and another one near 244, followed by the 100-day SMA near 243, and the critical 200-day SMA (around 237). Note that the SPY hasn’t tested its 200-day SMA since the election. Overall, the technical picture continues to look healthy, especially if recent relative strength in risk-on market segments like small caps, biotechs, and retail can continue.
Latest sector rankings:
Relative sector rankings are based on our proprietary SectorCast model, which builds a composite profile of each of over 600 equity ETFs based on bottom-up aggregate scoring of the constituent stocks. The Outlook Score employs a forward-looking, fundamentals-based multifactor algorithm considering forward valuation, historical and projected earnings growth, the dynamics of Wall Street analysts’ consensus earnings estimates and recent revisions (up or down), quality and sustainability of reported earnings, and various return ratios. It helps us predict relative performance over the next 1-3 months.
In addition, SectorCast computes a Bull Score and Bear Score for each ETF based on recent price behavior of the constituent stocks on particularly strong and weak market days. High Bull score indicates that stocks within the ETF recently have tended toward relative outperformance when the market is strong, while a high Bear score indicates that stocks within the ETF have tended to hold up relatively well (i.e., safe havens) when the market is weak.
Outlook score is forward-looking while Bull and Bear are backward-looking. As a group, these three scores can be helpful for positioning a portfolio for a given set of anticipated market conditions. Of course, each ETF holds a unique portfolio of stocks and position weights, so the sectors represented will score differently depending upon which set of ETFs is used. We use the iShares that represent the ten major U.S. business sectors: Financial (IYF), Technology (IYW ), Industrial (IYJ), Healthcare (IYH), Consumer Goods (IYK), Consumer Services (IYC), Energy (IYE), Basic Materials (IYM), Telecommunications (IYZ), and Utilities (IDU). Whereas the Select Sector SPDRs only contain stocks from the S&P 500, I prefer the IYH), Consumer Goods (IYK), Consumer Services (IYC), Energy (IYE), Basic Materials (IYM), Telecommunications (IYZ), and Utilities (IDU). Whereas the Select Sector SPDRs only contain stocks from the S&P 500, I prefer the iShares for their larger universe and broader diversity.
Here are some of my observations on this week’s scores:
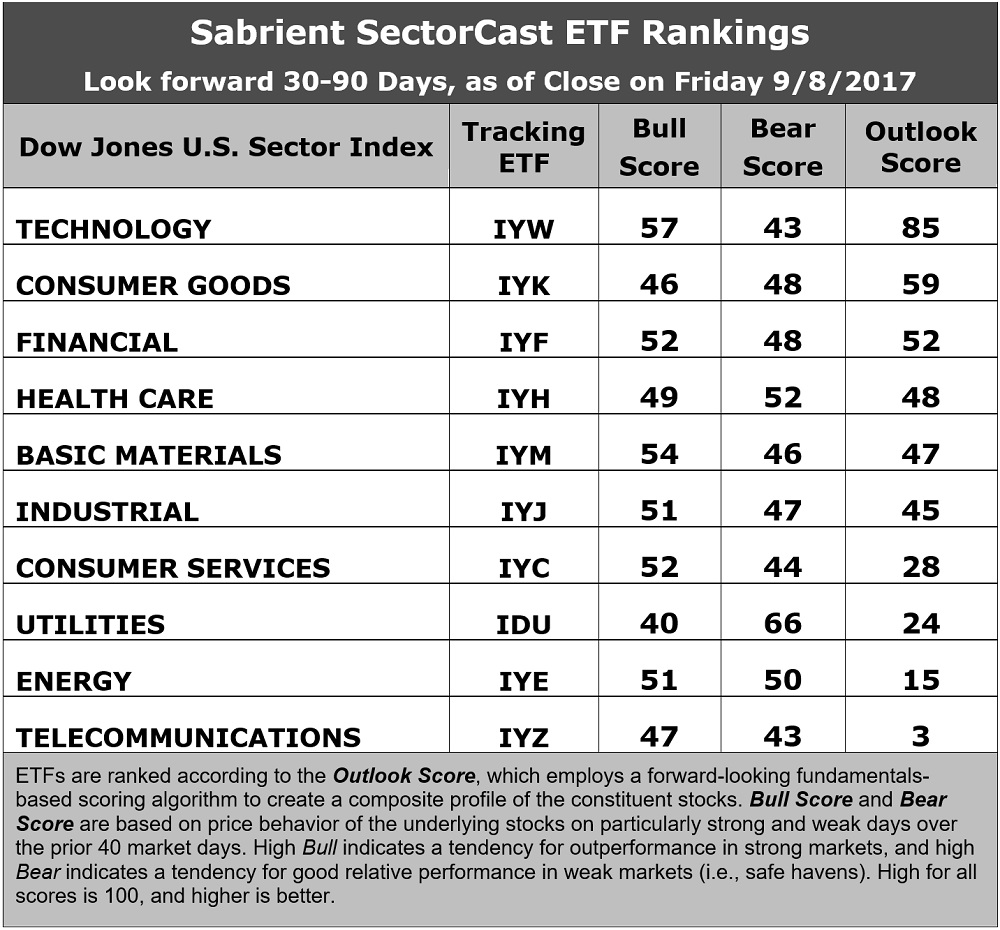
1. There has been some notable shuffling in the rankings over the past few weeks, but Technology still sits in the top spot with an Outlook score of 85, and then there is quite a gap of 26 points down to #2. Tech displays one of the best long-term projected EPS year-over-year growth rates of 15.0%, the best Wall Street sell-side analyst sentiment (i.e., net positive revisions to EPS estimates), the highest return ratios, and a low forward PEG of 1.20 (ratio of forward P/E to forward EPS growth rate). Consumer Goods (Staples/Noncyclical) takes the second spot due to its solid Wall Street sentiment and strong return ratios. However, both sectors display only average forward P/Es around 18.0x, which is in line with the overall market. Rounding out the top six are Financial, Healthcare, Basic Materials, and Industrial. Notably, positions 2 through 6 are all bunched together with Outlook scores between 45-59, which implies uncertainty. Financial displays the lowest forward P/E of 16.2x.
2. Telecom and Energy sit in the bottom two with Outlook scores of 3 and 15, respectively. Both display generally weak scores across the board, including the highest forward P/Es (25.0x and 27.5x, respectively). On the other hand, Energy also displays the highest long-term projected EPS year-over-year growth rate of 25.6% due to easier comps, and the best (lowest) forward PEG of 1.07. Telecom displays the weakest analyst sentiment (i.e., solidly negative earnings revisions) and the worst insider sentiment (net open-market selling).
3. Looking at the Bull scores, Technology boasts the top score of 57, followed by Materials at 54, as they have displayed relative strength on strong market days, while Utilities is the lowest at 40. The top-bottom spread is 17 points, which reflects moderately low sector correlations on strong market days, which is favorable for stock picking. It is desirable in a healthy market to see low correlations reflected in a top-bottom spread of at least 20 points, which indicates that investors have clear preferences in the market segments and stocks they want to hold (rather than broad risk-on behavior).
4. Looking at the Bear scores, we find Utilities at the top with a score of 66, followed by Healthcare at 52, which means that stocks within these sectors have been the preferred safe havens lately on weak market days. Technology and Telecom share the lowest score of 43, as investors have fled during market weakness. The top-bottom spread is 23 points, which reflects low sector correlations on weak market days, which is favorable. Ideally, certain sectors will hold up relatively well while others are selling off (rather than broad risk-off behavior), so it is desirable in a healthy market to see low correlations reflected in a top-bottom spread of at least 20 points.
5. Technology displays by far the best all-around combination of Outlook/Bull/Bear scores, while Telecom is by far the worst. Looking at just the Bull/Bear combination, Utilities is the best (although Energy and Healthcare share the second highest with greater balance between Bull and Bear score), indicating superior relative performance (on average) in extreme market conditions (whether bullish or bearish), while Telecom by far scores the worst, as investors have generally avoided the sector recently.
6. This week’s fundamentals-based Outlook rankings still reflect a generally bullish bias, given that six of the top seven sectors (by ordinal rank) are economically-sensitive or all-weather (Technology, Financial, Healthcare, Materials, Industrial, Consumer Services). But on the other hand, I am concerned about the low magnitude of the Outlook scores for everything but Tech (the others are all below 60), which doesn’t reflect as much conviction. Keep in mind, the Outlook Rank does not include timing, momentum, or relative strength factors, but rather reflects the consensus fundamental expectations at a given point in time for individual stocks, aggregated by sector.
ETF Trading Ideas:
Our Sector Rotation model, which appropriately weights Outlook, Bull, and Bear scores in accordance with the overall market’s prevailing trend (bullish, neutral, or defensive), displays a bullish bias and suggests holding Technology (IYW ), Basic Materials (IYM), and Financial (IYF), in that order. (Note: In this model, we consider the bias to be bullish from a rules-based trend-following standpoint when SPY is above both its 50-day and 200-day simple moving averages.)
Besides iShares’ IYW, IYM, and IYJ, other highly-ranked ETFs in our SectorCast model (which scores nearly 700 US-listed equity ETFs) from the Technology, Materials, Financial sectors include First Trust NASDAQ-100 Tech Sector Fund (QTEC), PowerShares S&P SmallCap Materials Portfolio (PSCM), and First Trust NASDAQ ABA Community Bank Fund (QABA).
If you prefer a neutral bias, the Sector Rotation model suggests holding Technology, Consumer Goods (Staples/Noncyclical), and Financial, in that order. On the other hand, if you are more comfortable with a defensive stance on the market, the model suggests holding Utilities, Healthcare, and Consumer Goods (Staples/Noncyclical), in that order.
By the way, an assortment of other interesting ETFs that happen to score well in our latest rankings include Global X SuperDividend REIT (SRET), PowerShares Dynamic Pharmaceuticals Portfolio (PJP), Elkhorn S&P MidCap Consumer Discretionary Portfolio (XD), SPDR S&P Retail (XRT), WBI Tactical SMY Shares (WBIC), Pacer US Cash Cows 100 (COWZ), PowerShares International Dividend Achievers Portfolio (PID), ValueShares US Quantitative Value (QVAL), Direxion iBillionaire Index (IBLN), iShares US Home Construction (ITB), VictoryShares US SmallCap High-Div Vol-Wtd Index (CSB), VanEck Vectors Steel (SLX), and Direxion All Cap Insider Sentiment Shares (KNOW – which tracks a Sabrient index).
Disclosure: The author has no positions in stocks or ETFs mentioned.
Disclaimer: This newsletter is published solely for informational purposes and is not to be construed as advice or ...
more

