
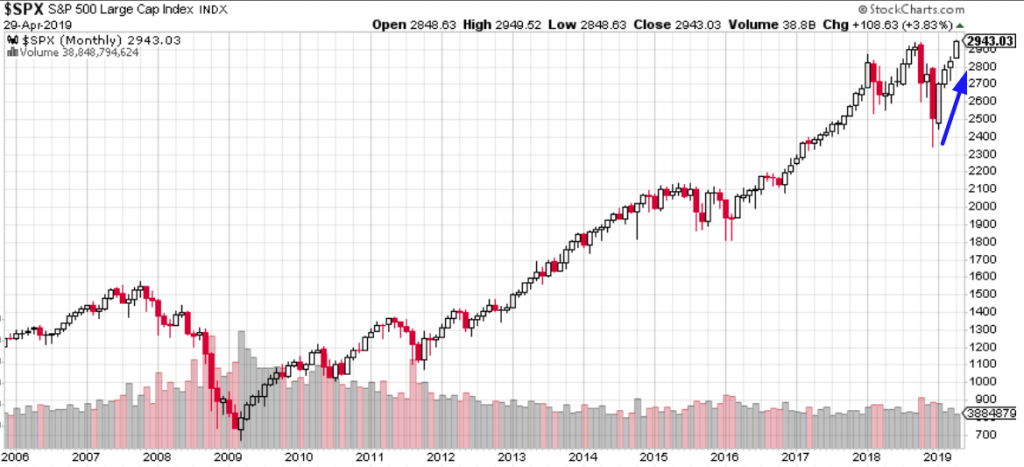
SPX Record Highs: Every Time Is Different
The S&P 500 indeed set a new record closing high and all-time intraday high on Monday. It's different this time because it's different every time, otherwise we'd have a more colloquial phrasing of "same time", which we obviously do not.
The index nearly hit 2,950 before pulling back a bit into the closing bell and ahead of a key earnings report from Alphabet Inc. (GOOGL). The Internet search and display ad mega-cap company easily beat on the bottom line, but revenue in its ad business segment slowed more than expected. Shares of GOOGL are down nearly 8% ahead of the market’s open on Tuesday. The impact from GOOGL is likely going to weigh on the tech-heavy Nasdaq (NDX) Tuesday, but that won’t likely detract from the major averages producing 4 straight months of gains. We’ll get to that in a moment.
The markets have been responding, all year long, to the better than expected economic data, capped with last week’s release of a 3.2% Q1 GDP result. With growth better than expected, it has also come with a lack of inflation as recognized in the latest release of Personal Consumption and Expenditures data (PCE). The PCE is the measure of economic inflation most widely used by the FOMC in their policy rate decision-making exercises.
Consumer spending surged in March, adding to the sense the economy is on strong footing, while core inflation weakened, government figures show. Spending jumped 0.9% in March after a 0.1% gain in February. This was the largest monthly gain in almost ten years. Again, this is MoM, which should be anticipated after a harsh winter that found consumer spending in “snap back” mode. Year over year, consumer spending is up 2.9%, and is the prime factor driving GDP.
The closely followed core PCE inflation was flat in March, knocking the yearly rate down to 1.6% from 1.7%. This is the lowest rate since September 2017. Personal incomes, meanwhile, increased 0.1% in March and remained on a moderate growth path.
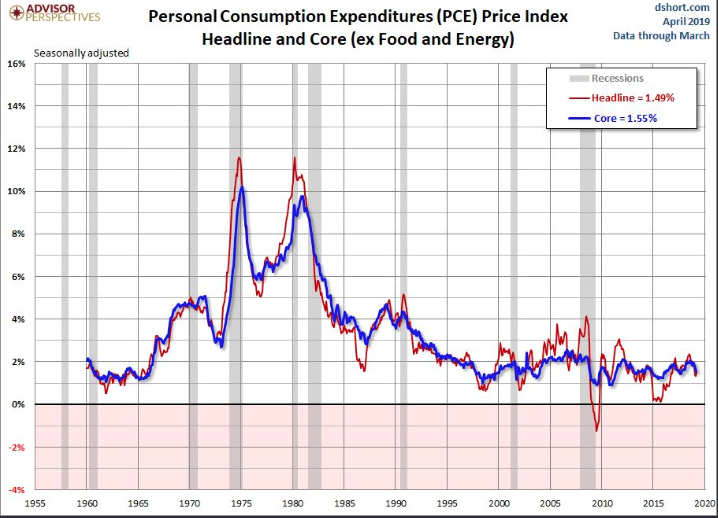
Income was subdued. The scant 0.1% gain in March follows a 0.2% gain in February and a 0.1% fall in January. Most of the weakness in personal income was in categories like interest and farm income. Private wages & salaries now comprise 42.7% of total personal income, a cycle high, rising about 4.2% over the last year. Year over year, personal income is up 3.8 percent. Disposable income was flat in March.
As a result of the boost in spending and low income, the savings rate fell to 6.5% in March, which is the smallest since November. The savings rate has averaged 6.9% since February 2013.
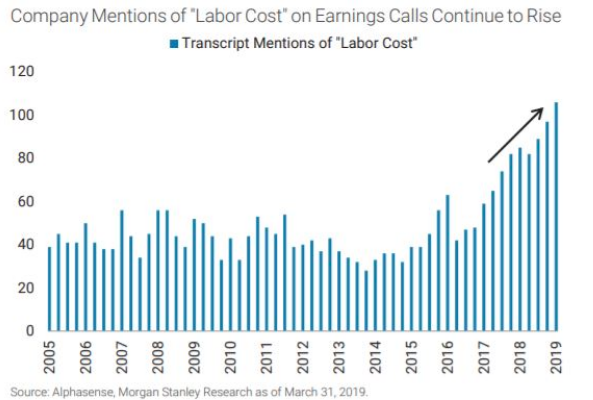
You might recall from Morgan Stanley’s analysts notes back in mid-April that the firm was of the opinion that rising wages coupled with a higher savings rate would curtail economic activity in 2019. This would also likely perpetuate an earnings recession. Finom Group (for whom I am employed) tackled these varied calls from Adam Virgadamo in the report titled S&P 500 Q1 Earnings Are Disappointing Bond Investors. (subscription needed)
Here are some of the offerings from the Morgan Stanley analyst who was negative on U.S. corporate earnings growth and fearful of wage inflation as well as the rising savings rate on the economy. Keep in mind what we just saw in the consumer spending as well as savings rate data from within the PCE data.
“Large public companies and small businesses alike are discussing labor costs as a major headwind to profitability,” wrote Morgan Stanley equity strategist Adam Virgadamo. “Sustained wage pressures add to the likelihood of an earnings recession in 2019 as higher labor costs and slowing top line growth create a dangerous recipe for margins. In the bear case, the earnings recession could spur layoffs and raise the probability of an economic recession,” he warned.
The bull case attached to rising wages is that higher wages can spur consumer spending and offer sales growth support for consumer facing companies,” wrote Virgadamo, but in recent years rising wages have been matched commensurately with rising savings. During recent years, “ an increasing percentage of higher wages are being saved.”
When I first read the notes from Adam Virgadamo I though of it as pure nonsense, or as the Brits would say, rubbish. Here is what Finom Group offered in response to the analyst’s notes, with supporting chart of average hourly earnings/savings rate:
“Everything the analyst has outlined seems very logical and is accompanied by back dated-present charts of the economic data offered. Having said that, there’s simply never been the scenario where rising wages, even when accompanied by a higher savings rate, has CAUSED an earnings recession or an outright economic recession. The denominator would have to cause that earnings recession, demand/sales. The demand side of the equation has waned from 2018 and into 2019 undoubtedly, but by all YoY accounts (factory orders, wholesale inventories and end-user retail sales) sales continue to grow. And this, yes this through the accelerated wage growth of 2018, which by the analysts’ own admission, has tapered off in Q1 2019. Nonetheless we can also take a look at that savings rate overlay with wage growth.”
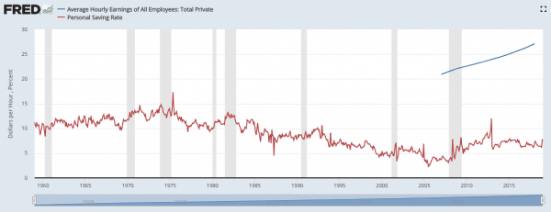
If you want to be your own worst enemy as an analyst, go ahead and pick the fight suggesting the U.S. consumer/household is unwilling to spend over time. Go right ahead and pick that fight. As shown in the chart above, the savings rate (red line) has come down since we’ve moved to a more consumer-based economy (Post 1970s). Wages do nothing but go up over time and as such it should be expected that the rate of change for the savings rate may tick higher, but rate of change does not qualify as a growth rate or growth rate trend. The current uptick in the savings rate is a measure we would anticipate to tick lower in the back half of 2019. With that said, we don’t see the demand picture moving to a more recessionary stance either. The impetus for declines in consumer spending aren’t presented in the labor market presently.”
With the latest slowing of income and wage growth as realized through the March PCE and BLS data, we understand the fears of breakaway inflation were overhyped. Many analysts were simply found to be “prisoners of the moment”, as wage growth accelerated in 2018, above trend. We’ll get more data on wage inflation this Friday with the release of the April Nonfarm Payroll data sets. But with respect to Virgadamo’s fear of a rising savings rate, that also proved to be overblown and disproportionate to saving rates trends dating back to the 1970s.
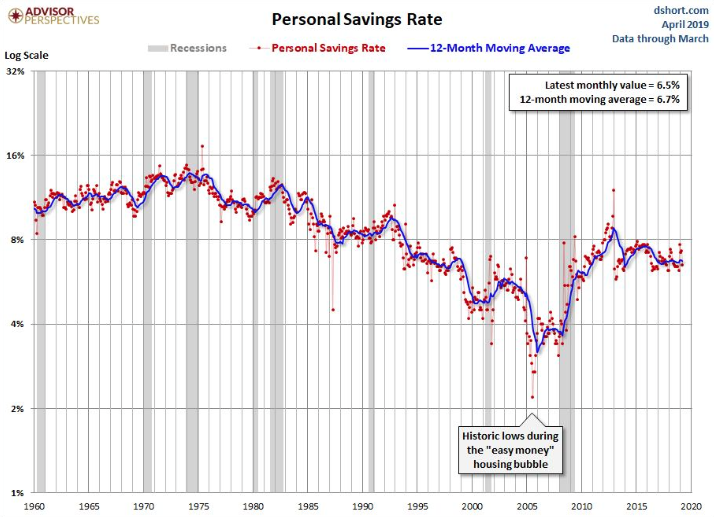
As depicted in the chart above, it’s clear that as the U.S. economy has evolved into a consumer driven economy, the savings rate has edged ever lower over time.
Coming into the final trading day of April 2019, the market will have expressed 4 straight monthly gains. With this in mind, what should we expect next from the S&P 500 benchmark index given such a circumstance?
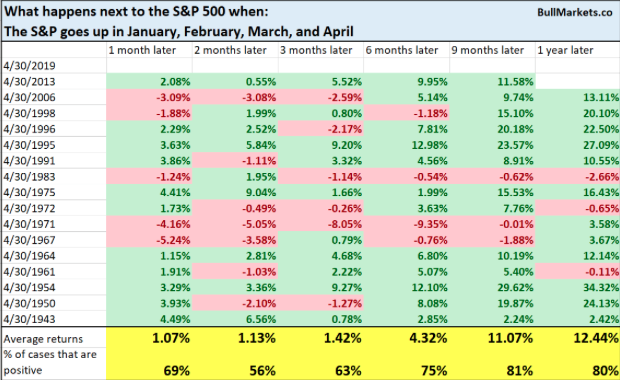
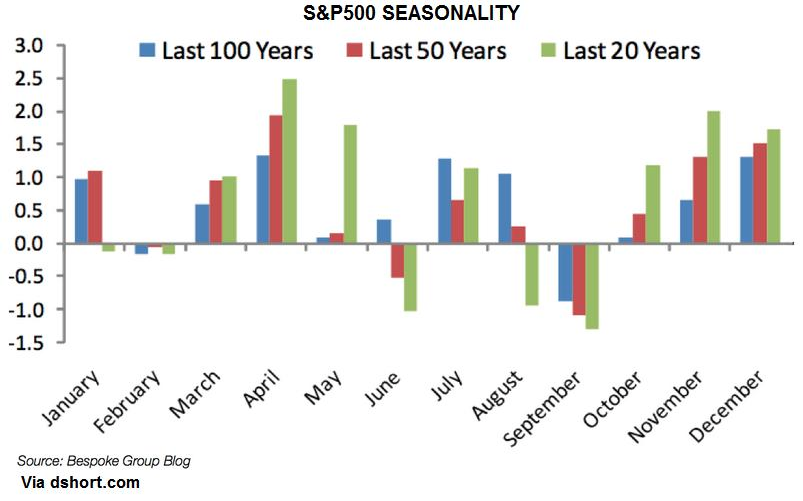
The study above from Troy Bombardia denotes the trend is your friend. The trend is mostly bullish, and the 9-12 month bearish cases only saw small losses. And as April moves out, May is ushered in with its infamous “sell in May and go away” colloquialism that is actually quite the farce. The chart from Bespoke, identifies that May has actually been a pretty strong month over the last 20 years, but June… not so much.
Reverting back to economic data, while the U.S. economic data has proven better than expected through the Q1 period and into the early goings of Q2, China’s latest PMI and manufacturing data proved to slow, unexpectedly. The Caixin/Markit factory Purchasing Managers’ Index for April was 50.2, lower than the March reading of 50.8, and missing the 51 projected by analysts in a Reuters poll.
Results of the private Caixin survey came after China’s National Bureau of Statistics released official manufacturing PMI for April, which fell to 50.1 from 50.5 in March. Analysts polled by Reuters had expected the indicator to stay at 50.5.

Tommy Xie, head of Greater China research at Singaporean bank OCBC, said the “slightly softer” official PMI data can be attributed to a build-up in inventories in the previous month. He explained that many companies increased production in March to take advantage of the value-added tax cuts that went into effect in early-April.
Tuesday’s data didn’t only show a slowdown in growth for the Chinese manufacturing sector, it also pointed to a loss in momentum for the services sector — which accounts for more than half of China’s economy. Beijing said the official non-manufacturing PMI dipped to 54.3 in April from 54.8 in March.
Analysts from Malaysian bank Maybank said the latest sets of data suggest that China’s “growth recovery is likely to be modest.” But Kelvin Tay, regional chief investment officer at UBS Global Wealth Management, said it’s premature to conclude that the Chinese economic growth is slowing based on the latest indicators. He suggested a little more patience and more data will be needed to establish a more normal rate of growth.
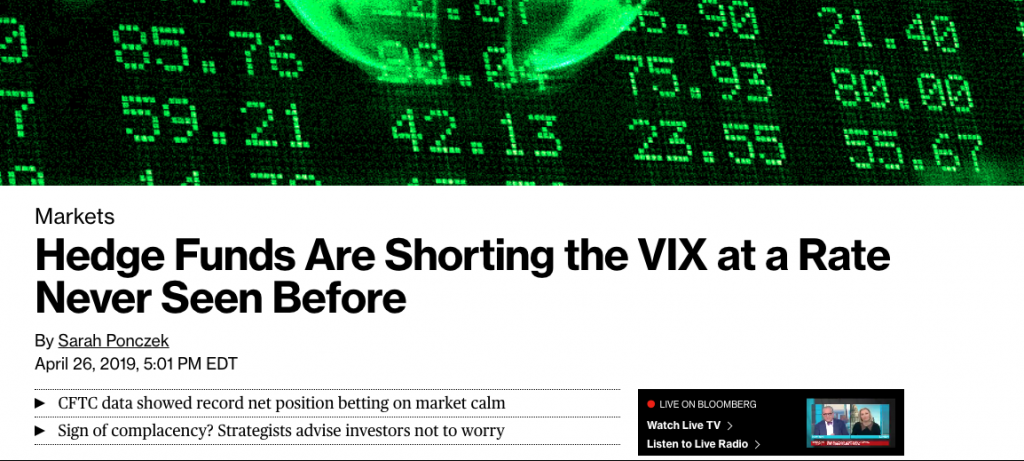
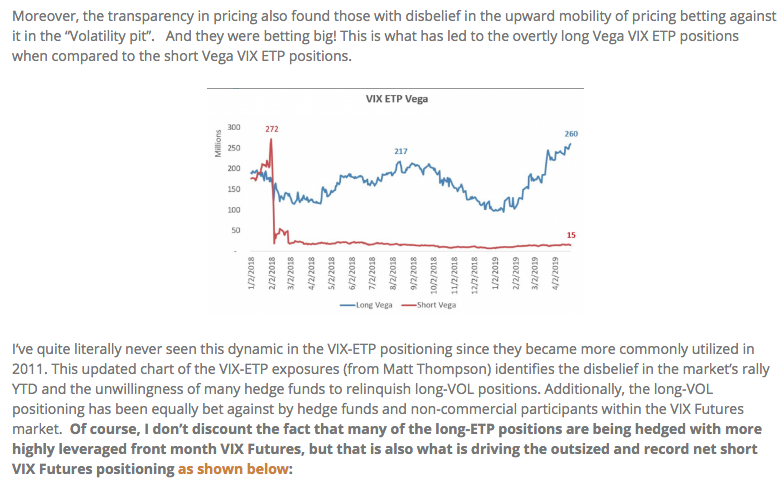
While the market has been moving higher and achieved new record highs on Monday, the media continues to jump all over the record level short VIX futures positioning. Just last Friday, Bloomberg covered the story for its audience of investors and speculators.
“Large speculators, mostly hedge funds, were net short about 178,000 VIX futures contracts on April 23, the largest such position on record, weekly CFTC data that dates back to 2004 show. Commonly known as the stock market fear gauge, aggressive bets against the VIX are, depending on your worldview, evidence of either confidence or complacency.
The problem with using just CFTC data is that it doesn’t represent the participation in the VIX-ETP derivative complex and it doesn’t lend itself to dual positioning, long and short as a hedge against one’s portfolio. Additionally, here is what Finom Group discussed in its weekly Research Report with regards to the overtly long VIX-ETP participation in 2019:
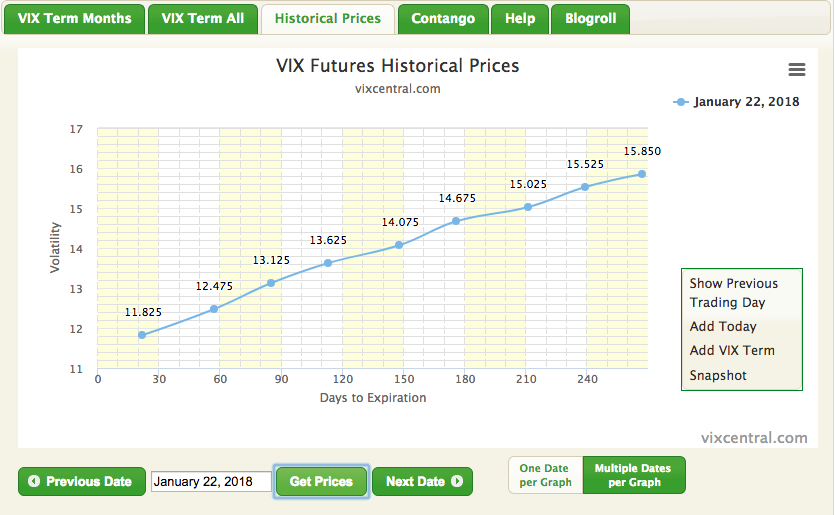
Another reason the positioning is not equally concerning as it proved to be in January 2018 is due to what VIX Futures Term Structure is indicating via the “slope of the curve”. See the slope from January 2018 below:
Now, here is the slope of the curve from 2018 compared with today in the same format:
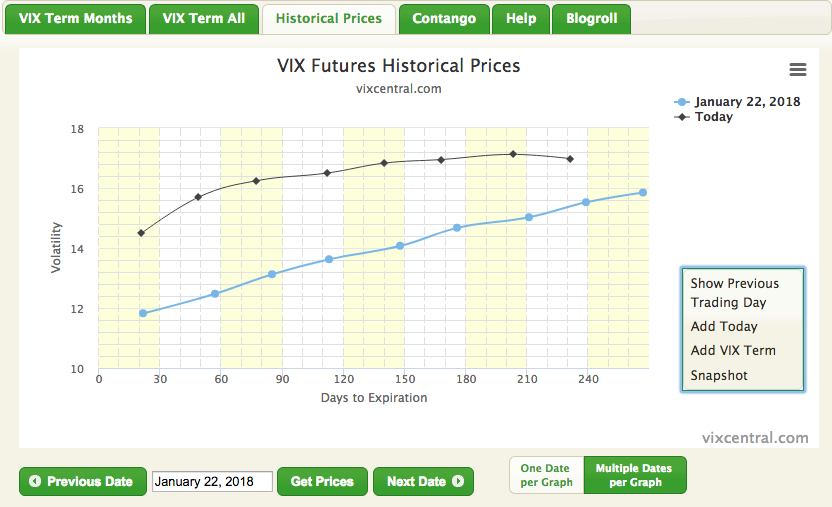
Essentially, the slope is extremely flat today (black line) compared to that from January 2018 (blue line). This indicates that not only is the expectation for volatility to rise, but when it does, it will likely be contained once it does. Additionally, it identifies that much of the risk is positioned at the front end of the VIX futures term structure while the back end is largely sponsor-oriented positioning, hedging off risk in the event of a VIX spike.
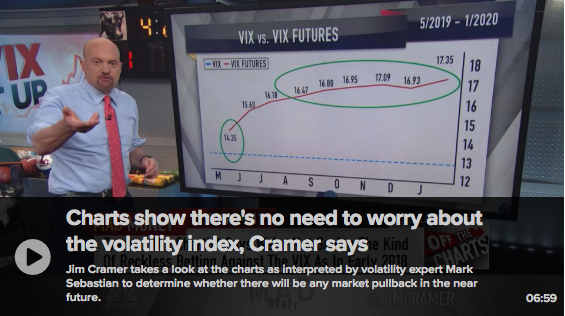
Given the complexities with understanding what the overall VIX complex positioning means or doesn’t mean, Jim Cramer also found it a point of discussion during his CNBC Mad Money show. You can review the commentary and analysis in the video linked.
The markets have a multitude of events and data points to contend with on Tuesday and through week’s end. Probably no greater event for the market Tuesday will come after the closing bell and via Apple’s Q2 2019 report. Analysts surveyed by FactSet expect Apple Inc. (AAPL) to report $2.36 in earnings per share, down from $2.73 a year earlier.
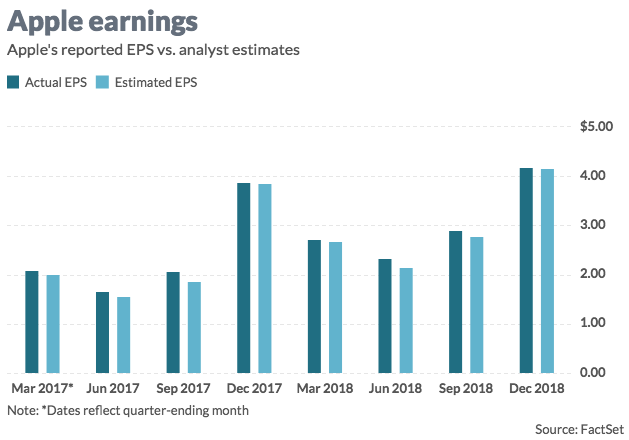
The FactSet consensus calls for $57.5 billion in second-quarter revenue. The company’s own forecast was for $55 billion to $59 billion. Apple reported $61.1 billion in sales a year ago. Apple’s iPhone sales are expected to total $31.1 billion, iPad sales $4.1 billion, Mac sales $5.9 billion, while software and services revenue is projected at $11.3 billion, and “other” revenue, which includes Apple Watch and accessory sales, is expected to total $4.8 billion, according to analyst estimates compiled by FactSet.
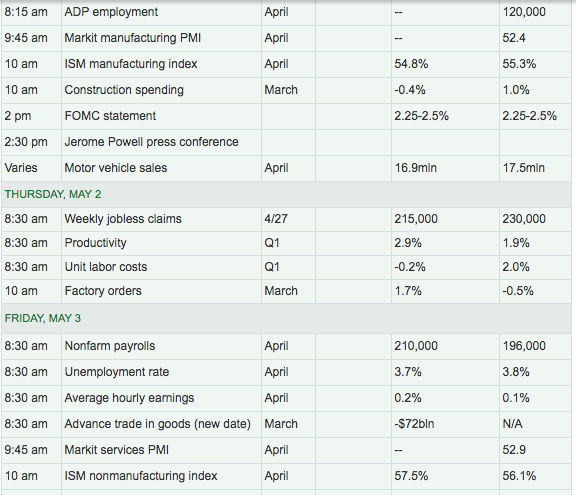
As far as the economic data is concerned, that will continue to pour in throughout the week with Wednesday’s data to coincide with the FOMC rate announcement and press conference. Chicago PMI, Consumer Sentiment and Pending Home sales all highlight Tuesday’s slate of economic data. The following table displays the data due out for the remainder of the trading week.
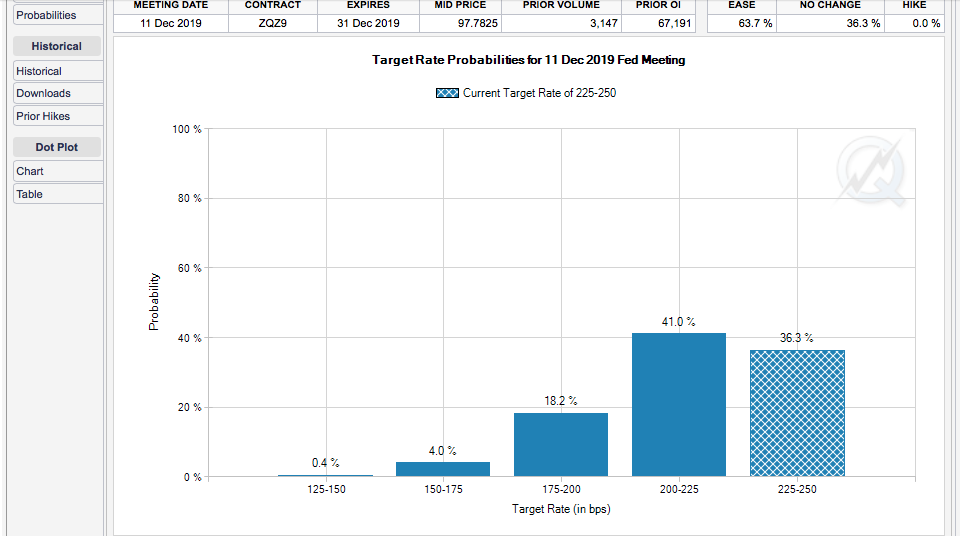
Another big story that will likely continue to plague market participants until further notice will be the ongoing debate on the Fed funds rate. Many are of the opinion that a rate cut is the next move from the Fed and we would expect that narrative to ebb and flow with each passing Fed press conference, as the central bank is likely to keep rates on hold until at least the Q4 2019 period. As of right now, the CME FedWatch Tool suggests the market is pricing in a greater than 65% chance of a rate cut by December 2019.
We’ll have to see how this moderates after Wednesday’s press conference with Fed Chair Jerome Powell. But if the market truly desires a rate cut, one way or the other it is likely to achieve the action from the Fed. Remember, the Fed is reactionary and just as it reacted to the market downturn in Q4 2019 by pausing future rate hikes, if the market demands the Fed cut rates, the central bank will most probably concede. But time is still abundant and as such it’s a tale for another day. For now, let’s see how Consumer Sentiment and Pending Home sales shake out ahead of those key Apple Inc. results.


