
SPX, Gold, Oil And G6 Targets For The Week Of December 10
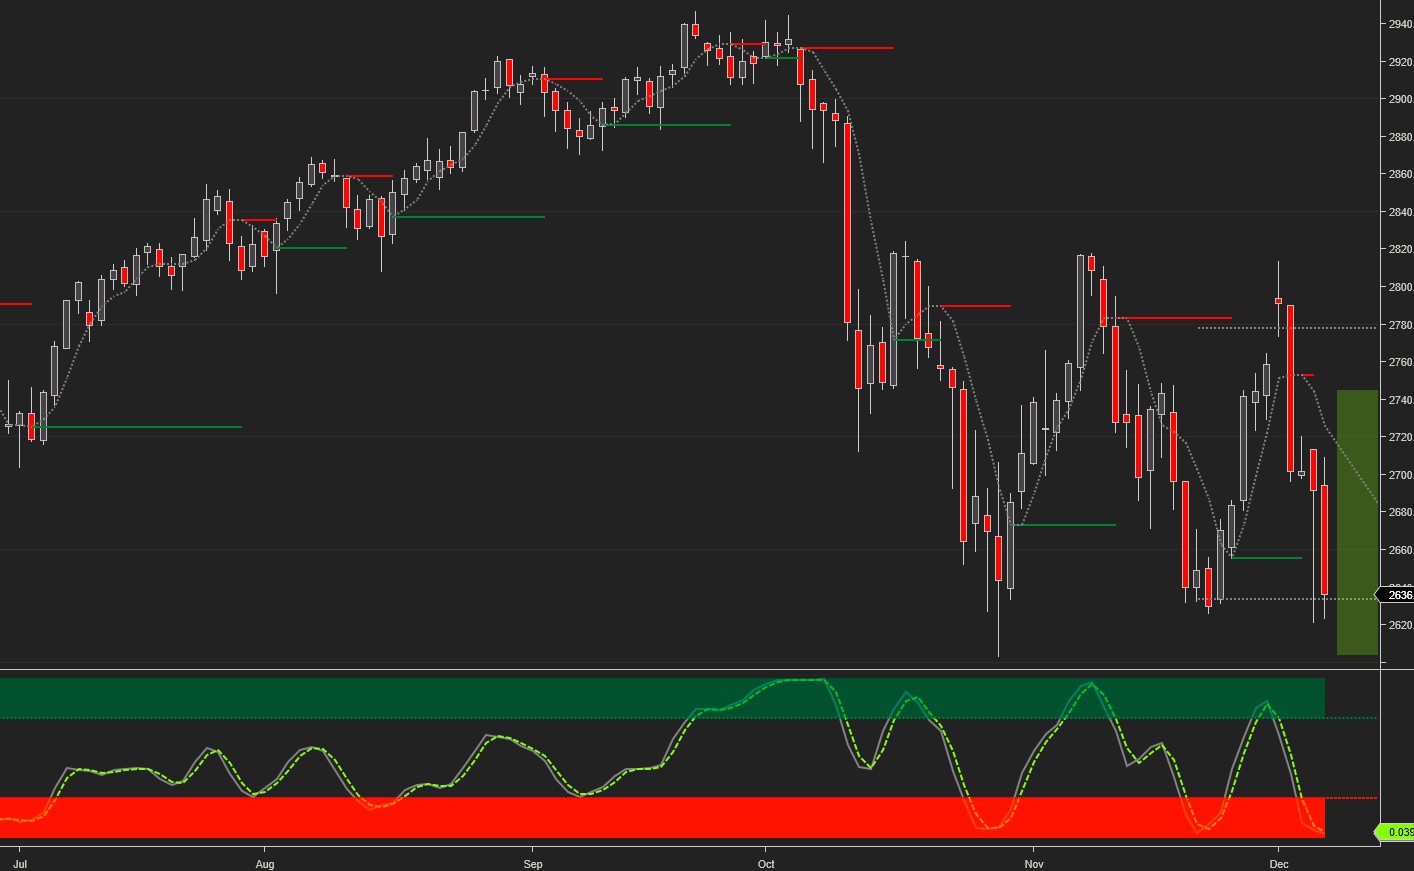
In a short, but action packed week, the SPX reached both our upside and downside targets. As mentioned last week, there’s a well defined support/resistance zone in play, and the longer-term trend will be determined by the ability of the SPX to break above the November 7 high (bullish) or below the November 23 low (bearish).
For the time-being, market breadth and sentiment indicators are all oversold which, barring some catastrophic news over the week-end, favors a rebound early next week.
After crossing the lower weekly target several times during the second half of the week, the SPX broke below it on Friday and dropped an additional 60 points. By definition, the weekly targets are designed to capture 80% of future price moves (the current rate is 85%), which raises the question of how to determine a lower/higher target on the rare occasions when an intraweek breakout/breakdown occurs. There are several ways of doing this (higher time-frame targets, channels, angles, technical support/resistance levels, etc.) but in addition, it's worth noting that the SPX found support at the daily lower target levels (dotted horizontal lines) both on Thursday:
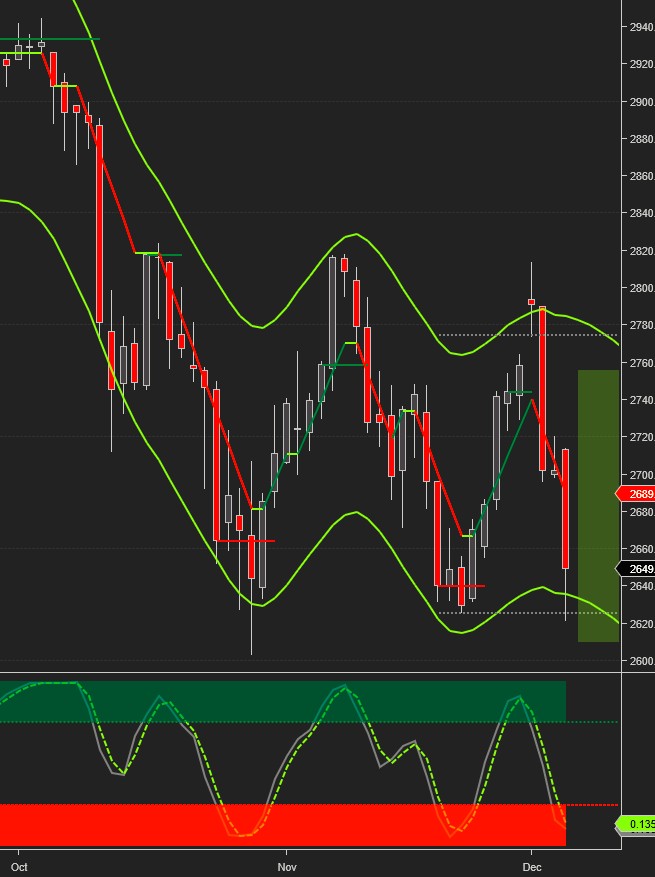
and on Friday:
The way they differ from channels is that they are fixed and predetermined, and don’t change values during the day.
Current signals*: Daily Sell, Weekly Sell, Monthly Sell
Weekly Buy pivot at 2660.
The projected trading range for next week for SPX is 2600-2750.
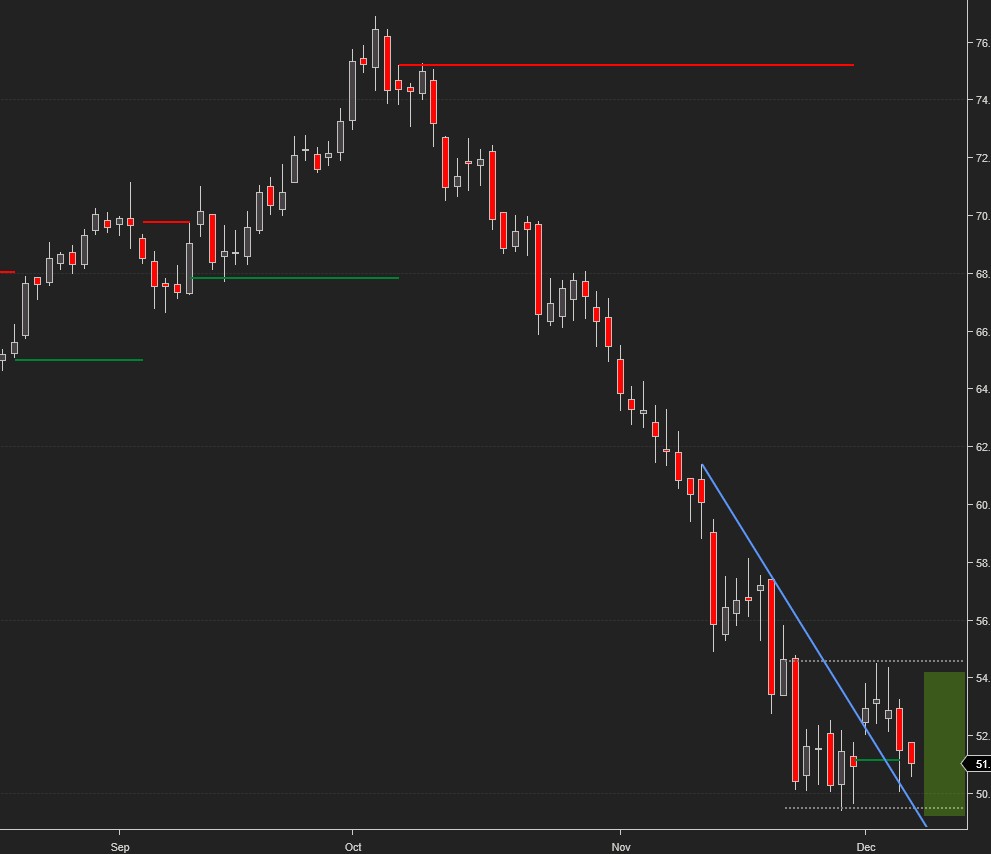
Oil continues trading above support at $50 on news of an OPEC supply cut deal. We would caution, however, that OPEC members are notorious quota cheaters and any such trial balloons should be taken with a grain of salt.
Current signals: Daily Buy/Hold, Weekly Sell.
Weekly Sell pivot at 50
The projected trading range for Oil for next week is 49.25 – 52.5:
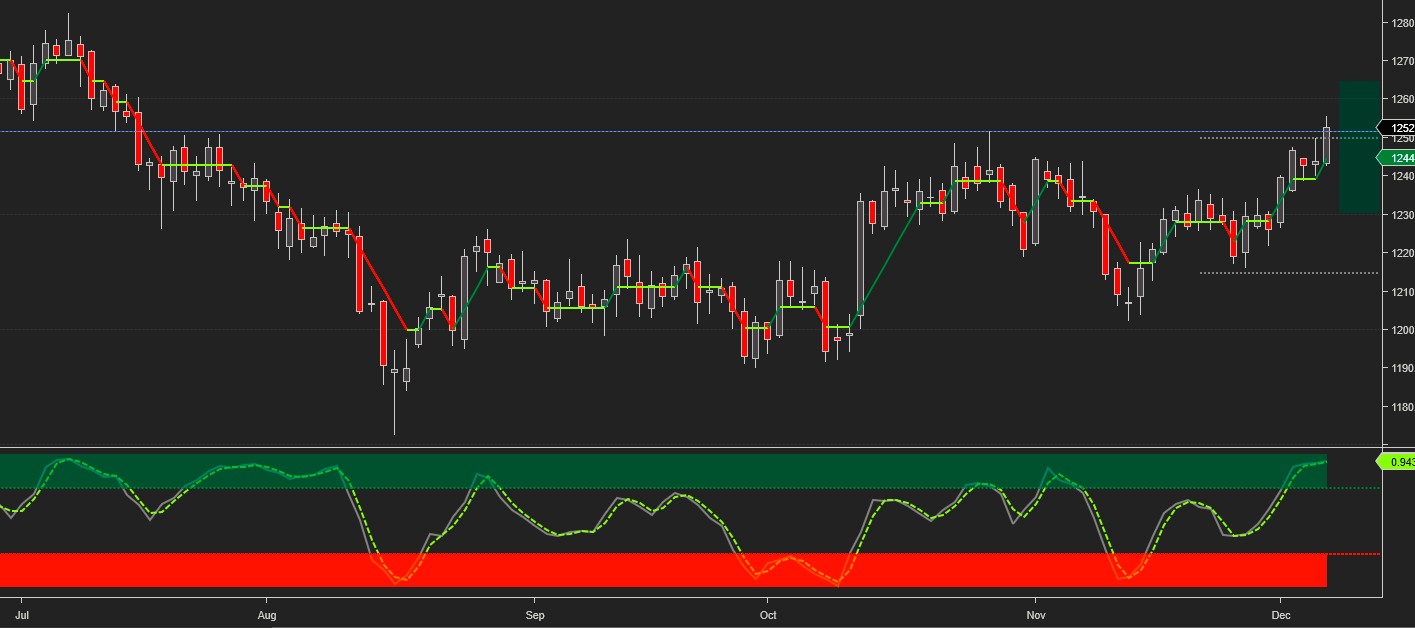
Gold remained on a buy signal and broke above the weekly upside target.
Current signals: Daily Buy, Weekly Buy
Weekly Sell pivot at 1240.
The projected trading range for Gold for next week is 1230 – 1265:
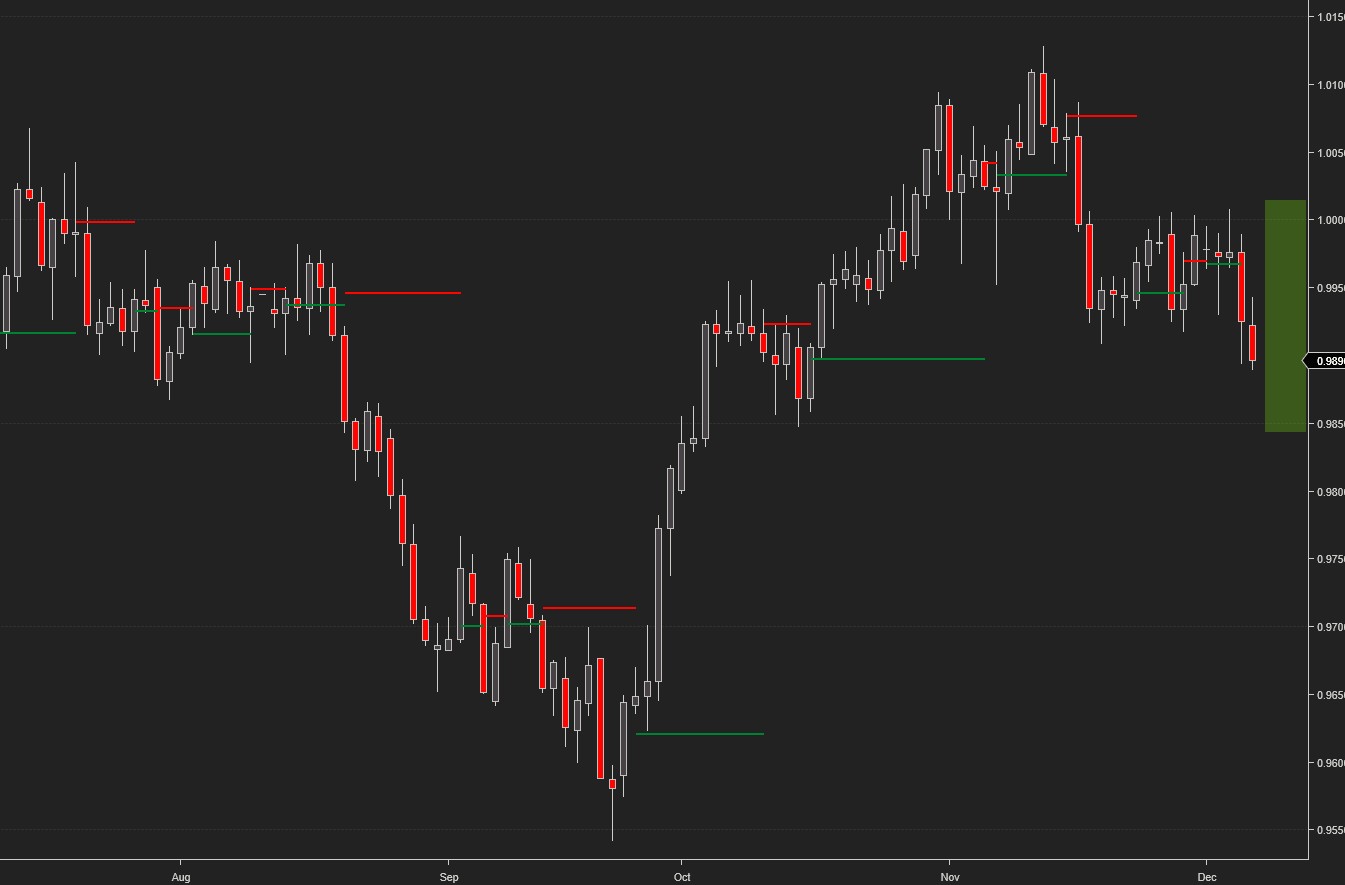
USDCHF failed several times to break above the key 1.00 level and faded lower during the second half of the week, triggering a sell signal.
Current signals: Daily Sell, Weekly Sell
Weekly Buy/ Sell pivot at 1.00
The projected trading range for USDCHF for next week is 0.984 – 1.001:
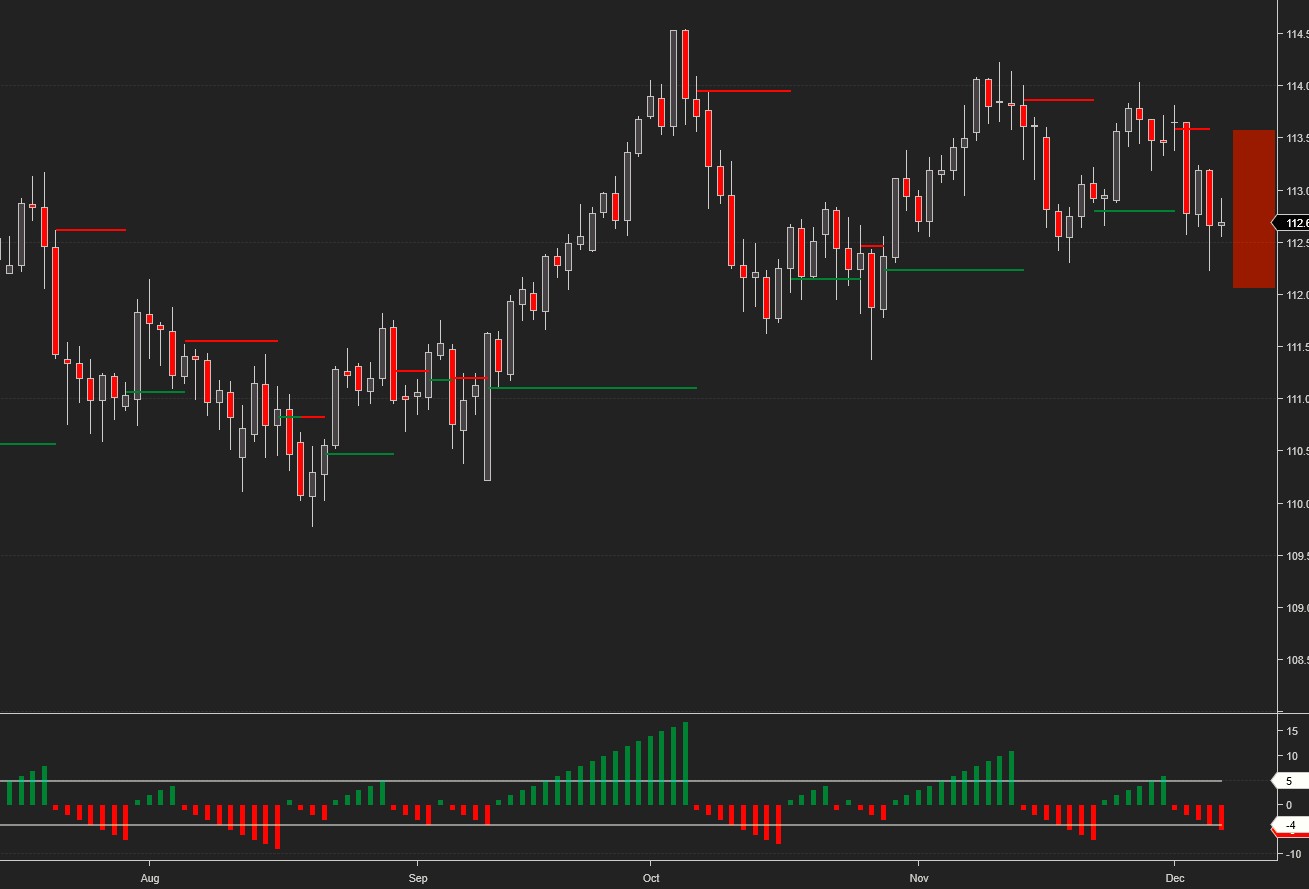
USDJPY finished the week a few pips below the weekly lower target. During the past couple of years, the 111.5 - 114.25 zone has provided support/resistance for months at a time.
Current signals: Daily Sell/Hold, Weekly Buy/Hold
Weekly Sell pivot at 112.25
The projected trading range for USDJPY for next week is 112 – 113.6:
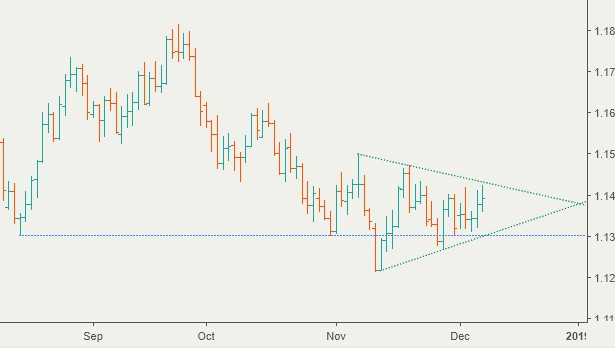
EURUSD traded mostly flat within the confines of a symmetrical triangle which defines the breakout/breakdown levels going forward. Once these levels are broken, there’s resistance at 1.15 and support at 1.12. The projected weekly trading range remains unchanged.
Current signals: Daily Buy, Weekly Buy
Weekly Sell pivot at 1.113
The projected trading range for EURUSD for next week is 1.128 – 1.15:
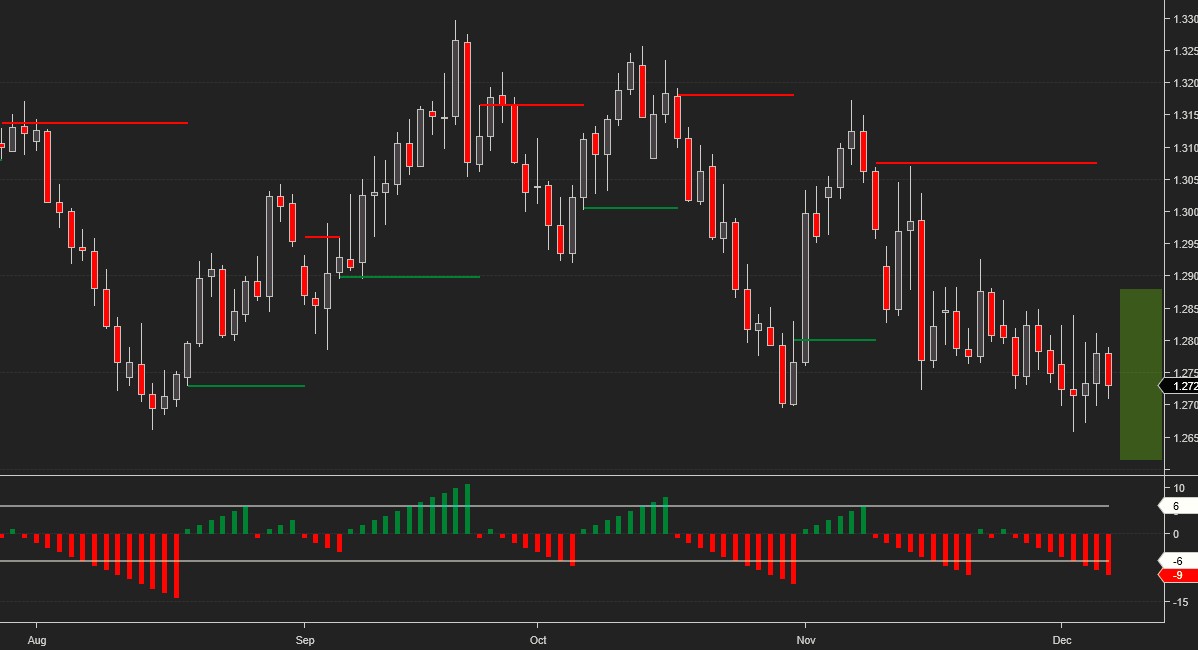
GBPUSD bounced off the lower weekly target and staged a modest rebound, unable to alter the bearish outlook.
Current signals: Daily Sell, Weekly Sell
Weekly Buy pivot at 1.29
The projected trading range for GBPUSD for next week is 1.2615 – 1.29:
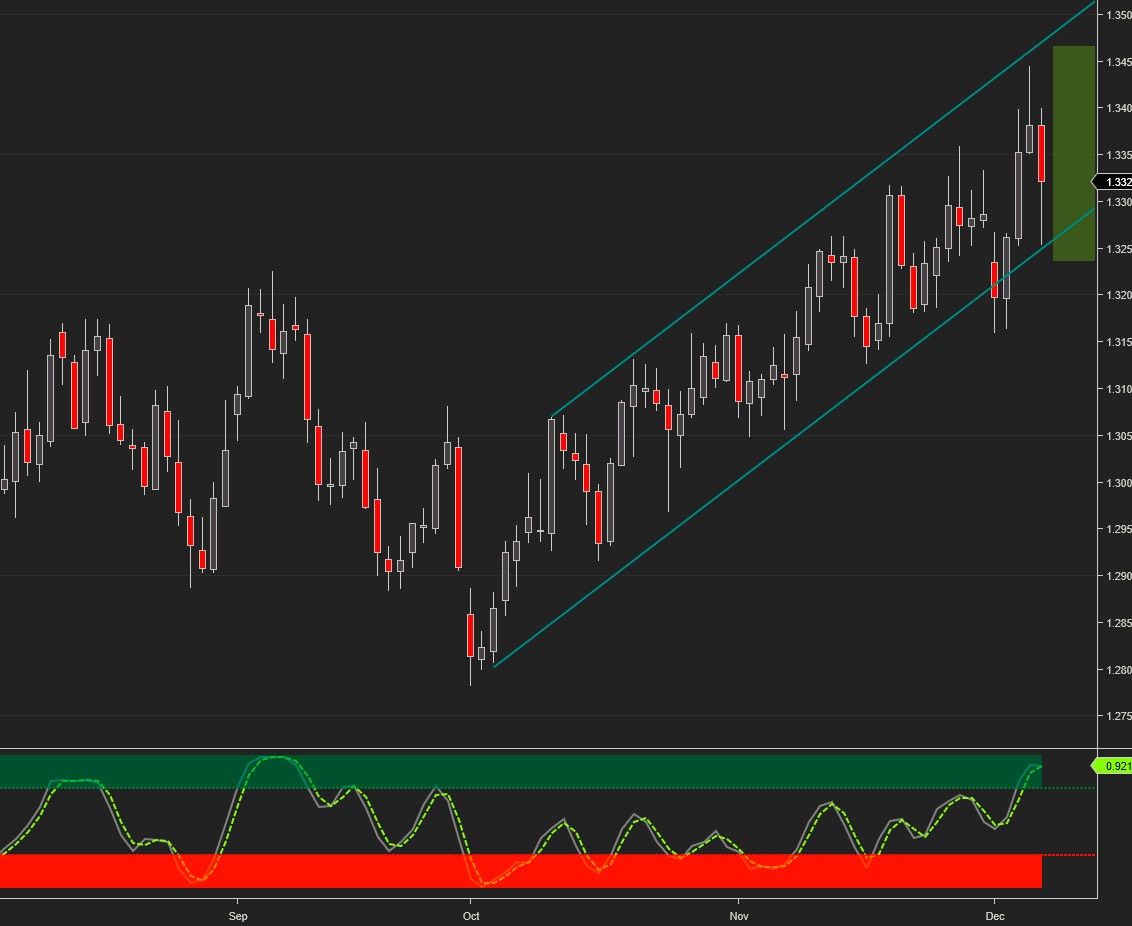
USDCAD reached both the weekly upside and downside targets. The pair remains in a well-defined uptrend channel providing good short-term swing trading opportunities with an overall bullish bias.
Current signals: Daily Buy, Weekly Buy
Weekly Sell pivot at 1.33
The projected trading range for USDCAD for next week is 1.323 – 1.346:
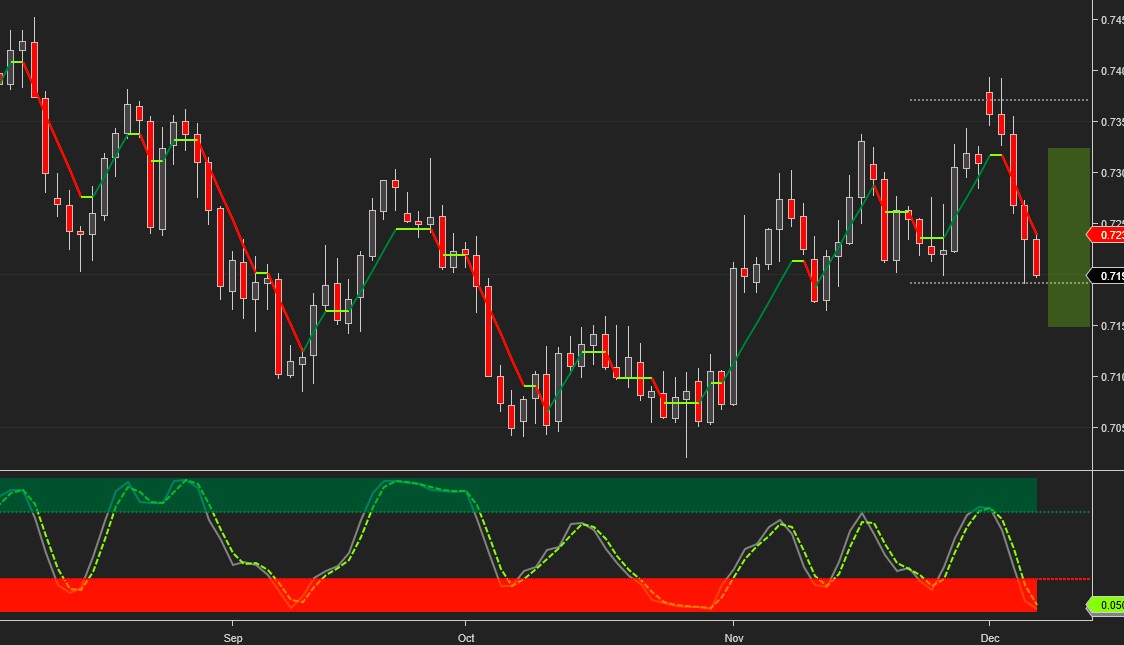
AUDUSD started the week with a gap up but got rejected at the upper weekly target and sold off relentlessly down to the lower weekly target. It painted a bearish outside weekly candle,a putting the November bounce in question.
Current signals: Daily Sell, Weekly Buy/Hold
Daily buy pivot for Monday at 0.725.
The projected trading range for AUDUSD for next week is 0.714 – 0.7325:
*Please note that the trading signals are in effect as of the close on Friday and may change as soon as the markets re-open. When the current signal is hold, we may also include the preceding buy or sell signal (e.g. Buy/Hold or Sell/Hold). Hold signals followed by a buy/sell signal in the direction of the preceding buy/sell signal can be considered for pyramiding the position.
Charts, signals and data courtesy of OddsTrader, CIT for TradingView and NinjaTrader 8
For intraday charts and update follow us on TradingView
Disclaimer:Futures and forex trading contains substantial risk and is not for every investor. An investor could potentially lose all or more than the initial investment. Risk capital is money that ...
more

