
Spread Between NAAIM Index And AAII Bulls In Red Zone — Risk-Reward Odds Unfavorable For Bulls, Particularly New Longs
NAAIM (National Association of Active Investment Managers) and AAII (American Association of Individual Investors) bulls do not always move hand in hand. Understandably so. They represent two different buying sources. Currently, they are going their separate ways. The spread between the two is fast approaching a level that in the past meant trouble for stocks.
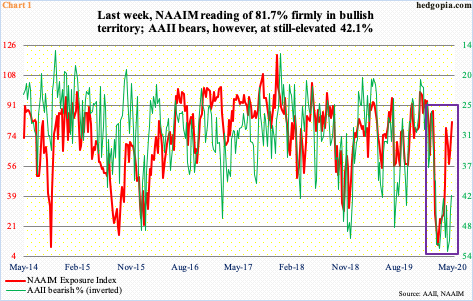
Last week – as of Thursday, to be precise – AAII bears edged lower by 2.9 percentage points week-over-week to 42.1 percent. This was down from 52.7 percent in the week through May 7. The S&P 500 large cap index rallied just under seven percent from that date. A reduction in bears’ count definitely provided a tailwind to stocks. Or, it is the other way around. They jumped onboard seeing stocks rally. The cause and effect notwithstanding, bears’ ranks remain elevated still.
The NAAIM Exposure Index, on the other hand, rose 18.4 points w/w to 81.7 last week (as of Wednesday). This was the highest reading in 14 weeks.In the week to February 19th when major US equity indices peaked, it stood at 87.9. The divergence between the two metrics is quite stark (box in Chart 1).
In an ideal scenario for equity bulls, AAII bears continue to turn into bulls and stocks continue to drift higher. This is not a scenario that can be dismissed easily. In fact, bears’ ranks may have already come down from last week’s, helping the ongoing rally in stocks. We will find out when this week’s number is reported tomorrow.
Be that as it may, there is one other factor to consider that is not looking very encouraging for the bulls.
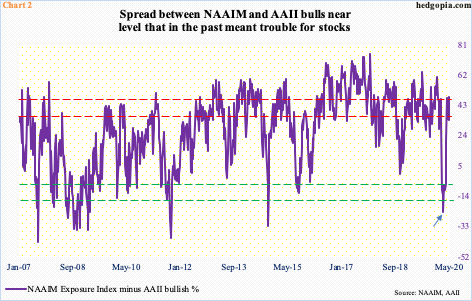
In Chart 2, a spread is calculated between the NAAIM index and AAII bulls. NAAIM represents the average exposure of its members to US equity markets. We are talking professionals and real money. The higher the reading, the more the number of bulls. For a contrarian, therefore, the higher it goes, the riskier it gets to put new money to work. The AAII survey, on the other hand, is just that – a survey – and focuses on the retail crowd.
Last week, the spread was 48.6 – NAAIM at 81.7 and AAII bulls at 33.1 percent – a 20-week high and into the red zone. For reference, in the week to March 18th, which preceded the March 23rd low in major equity indices, the spread dropped to minus 23.7 (arrow). The fear back then has been unwound, which helped stocks. The pendulum has now swung the other way – into greed territory. Several times in the past, the spread has managed to push still higher, but with each push higher risk-reward dynamics turn unfavorable for new longs in particular.


