
S&P/Case-Shiller Home Price Index: March Update
With today's release of the February S&P/Case-Shiller Home Price Index, we learned that seasonally adjusted home prices for the benchmark 20-city index were up 0.45% month over month which is cut to 0.20% with inflation adjustment.

With today's release of the March S&P/Case-Shiller Home Price Index, we learned that seasonally adjusted home prices for the benchmark 20-city index were up 0.47% month over month which is cut to 0.21% with inflation adjustment. The nonseasonally adjusted index was up 3.9% year-over-year.
Investing.com had forecast a 0.2% MoM seasonally adjusted increase and 3.3% YoY nonseasonally adjusted for the 20-city series.
Here is an excerpt from the analysis in today's Standard & Poor's press release.
"March’s data witnessed the first impact of the COVID-19 pandemic on the S&P CoreLogic Case-Shiller Indices,” says Craig J. Lazzara, Managing Director and Global Head of Index Investment Strategy at S&P Dow Jones Indices. “We have data from only 19 cities this month, since transactions records for Wayne County, Michigan (in the Detroit metropolitan area) were unavailable.
“That said, housing prices continue to be remarkably stable. The National Composite Index rose by 4.4% in March 2020, with comparable growth in the 10- and 20-City Composites (up 3.4% and 3.9%, respectively). In all three cases, March’s year-over-year gains were ahead of February’s, continuing a trend of gently accelerating home prices that began last autumn. March results were broad-based. Prices rose in each of the 19 cities for which we have reported data, and price increases accelerated in 17 cities.
“Importantly, today’s report covers real estate transactions closed during the month of March. Housing prices have not yet registered any adverse effects from the governmental suppression of economic activity in response to the COVID-19 pandemic. As much of the U.S. economy remained shuttered in April, next month’s data may show a more noticeable impact.” [Link to download PDF]
The chart below is an overlay of the Case-Shiller 10- and 20-City Composite Indexes along with the national index since 1987, the first year that the 10-City Composite was tracked. Note that the 20-City, which is probably the most closely watched of the three, dates from 2000. We've used the seasonally adjusted data for this illustration.

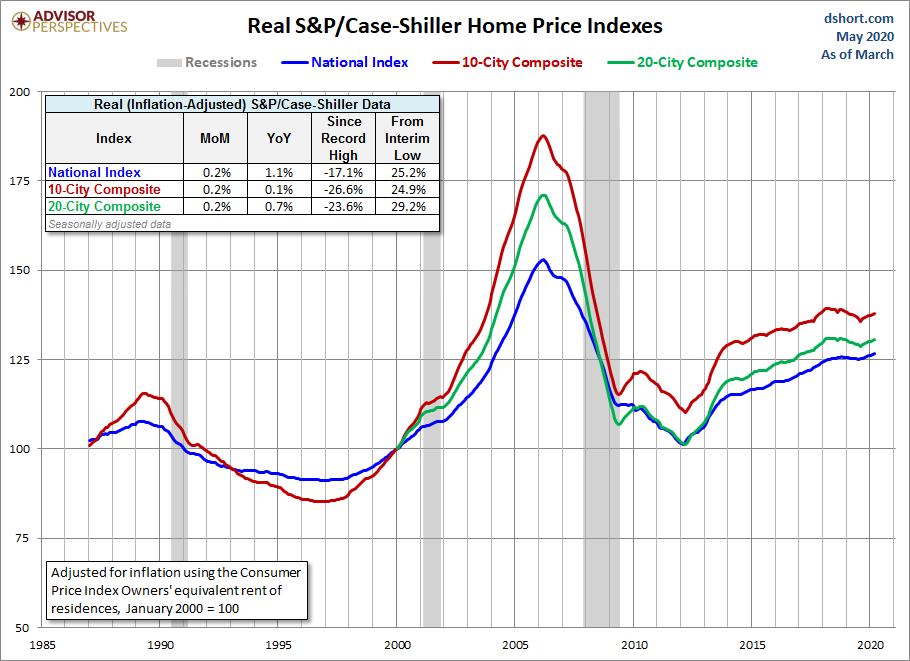
The next chart shows the year-over-year Case-Shiller series, again using the seasonally adjusted data.

Here is the same year-over-year overlay adjusted for inflation with the Consumer Price Index owners' equivalent rent of residences.

For a long-term perspective on home prices, here is a look at the seasonally and inflation-adjusted Case-Shiller price index from 1953, the first year that monthly data is available. Because the CPI owners' equivalent rent of residences didn't start until 1983, we've used the broader seasonally adjusted Consumer Price Index.

To get an even better idea of the trend in housing prices over long time periods, we compare the change in the seasonally-adjusted Case-Shiller Home Price Index and the Consumer Price Index since 1953.


