
S&P Repeating 2000 & 2007 Patterns Almost Exactly?
(Click on image to enlarge)
Does History Repeat? Is does rhyme sometimes!!!
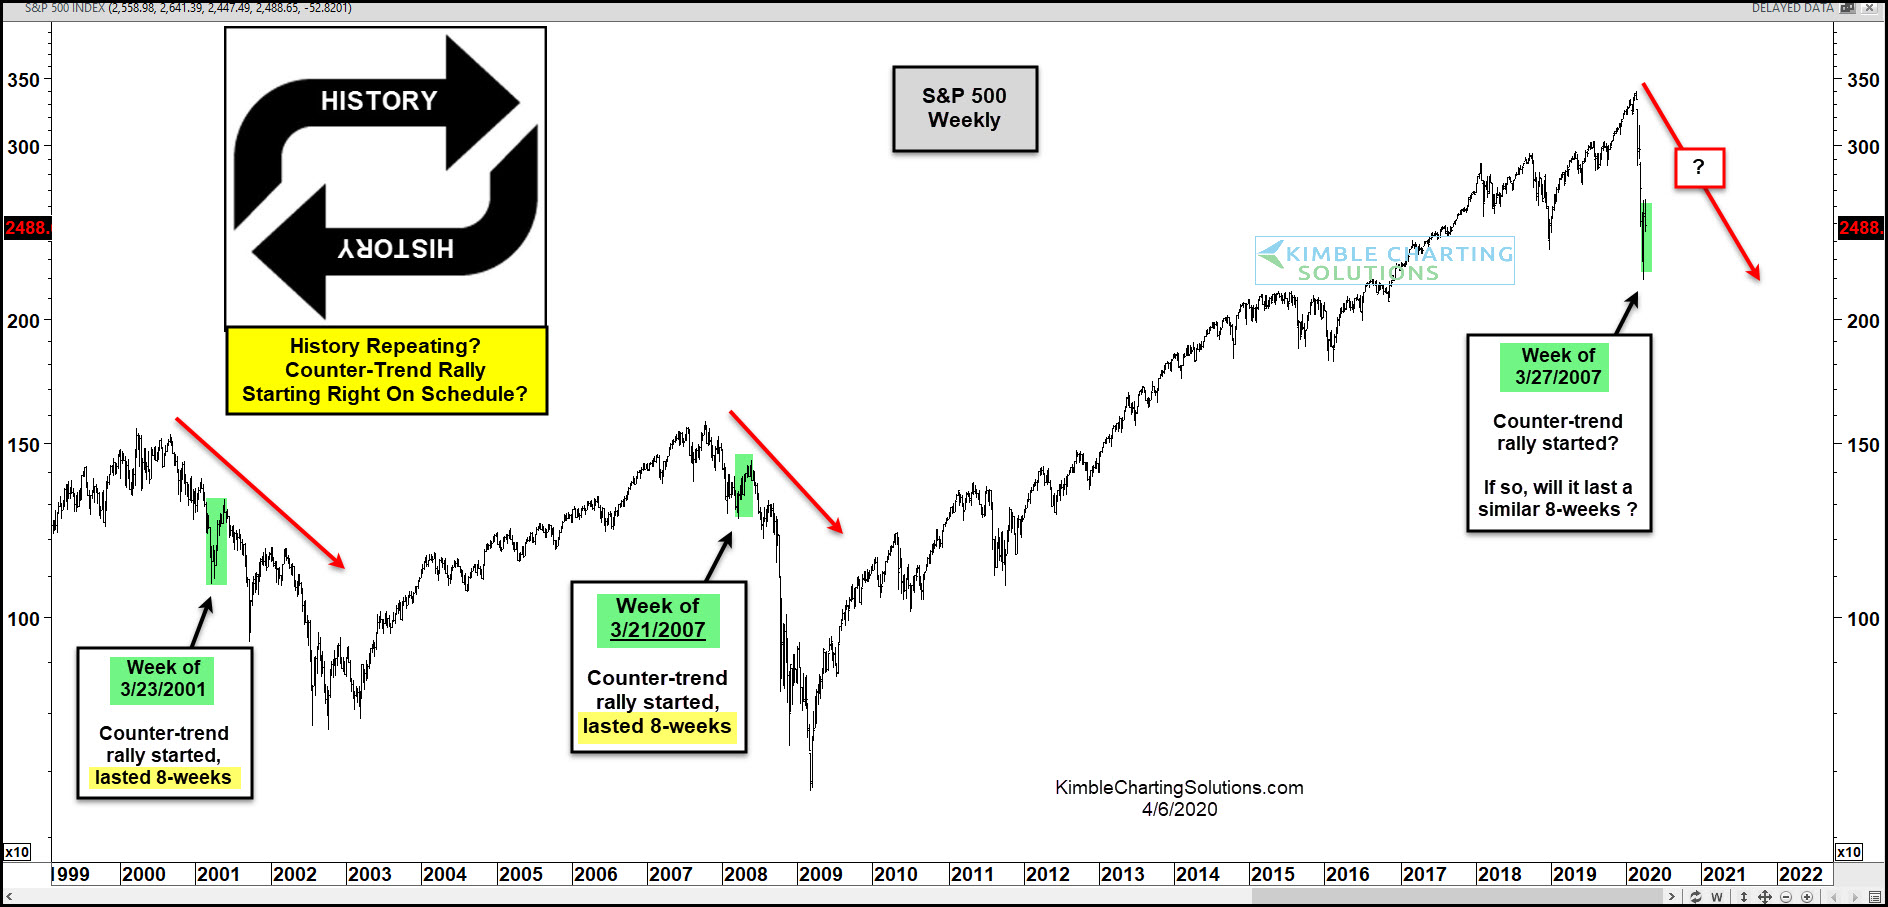
This chart looks at the S&P 500 on a weekly basis over the past 20-years.
The S&P declined by 50% during the 2000-2003 bear market. On the week of 3/23/2001, it experienced its first counter-trend rally, which lasted 8-weeks, before the bear market resumed.
The S&P declined by 50% during the 2007-2009 bear market. On the week of 3/21/2001, it experienced its first counter-trend rally, which lasted 8-weeks, before the bear market resumed.
Last month the S&P hit a low during the week of 3/27/20. Is a counter-trend rally starting right on schedule? If so, will it last 8-weeks again?
Both counter-trend rallies hit the same Fibonacci retracement level, before rolling over and resuming bear markets.
The odds are low the pattern repeats exactly! The impact would be big if it does!
We shared this pattern with members on 3/20/20, reflecting that a counter-trend rally was due to start the following week. I humbly feel it is to all of our benefits to be aware of this pattern and what to watch for in a very detailed degree, to see if the bigger pattern is repeating the bear markets of the past!


